
Accounts Receivable Turnover
Accounts receivable turnover is a financial ratio that measures how many times a company collects its average accounts receivable during a period, calculated by dividing net credit sales by average accounts receivable. A high ratio indicates fast, efficient collection and stronger cash flow, while a low ratio signals slow payments, tied-up cash, and higher bad-debt risk.
Table of Contents
- What accounts receivable turnover reveals about business cash flow
- Accounts receivable turnover formula
- Step-by-step calculation with a practical company example
- How do you convert turnover into days sales outstanding
- What a high turnover ratio signals to lenders and investors
- Why a low turnover ratio poses a risk to daily operations
- Industry context
- Common calculation mistakes and how seasonal sales distort results
- Actionable strategies to accelerate customer collections
What accounts receivable turnover reveals about business cash flow
Accounts receivable turnover provides a direct window into how quickly a business converts credit sales into actual cash. The ratio is calculated by dividing net credit sales by the average accounts receivable balance for the period, and the resulting figure shows how many times a company collected its average receivables during that time frame. A higher number indicates that customers are paying promptly and that the company is recycling its outstanding invoices into cash at a brisk pace. A lower number suggests that receivables are lingering on the books, tying up funds that could otherwise support operations, debt repayment, or growth initiatives. Because credit sales represent revenue that has been earned but not yet collected, the turnover ratio essentially measures the gap between making a sale and getting paid for it, which is one of the most consequential intervals in any business’s cash conversion cycle.
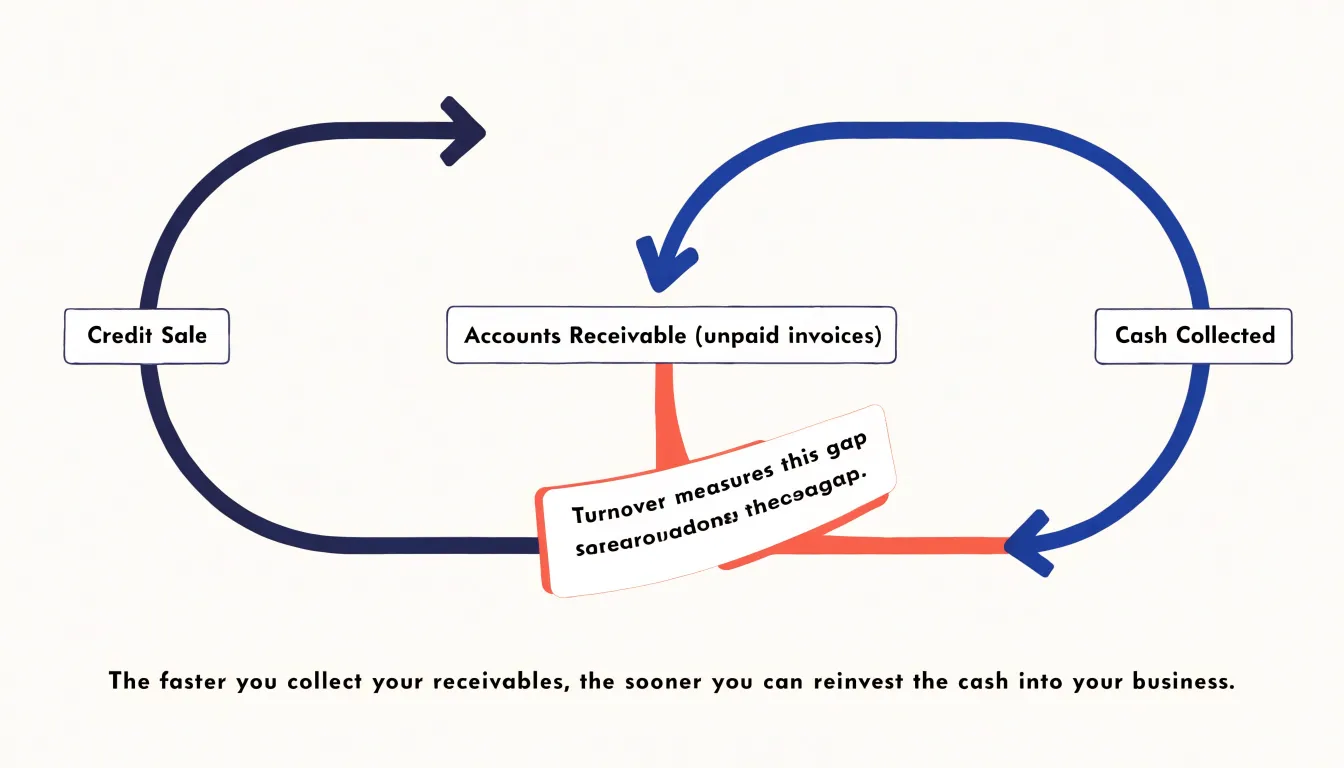
For liquidity, this metric carries significant weight. A company can report strong sales on its income statement while simultaneously struggling to meet payroll or supplier obligations if its receivables are slow to convert. The turnover ratio helps expose that mismatch by showing whether the cash locked in receivables is moving or stagnating. Lenders and creditors often examine this figure when assessing a borrower’s ability to service short-term obligations, since efficient collection reduces reliance on external financing and lowers the risk of a cash crunch. Internally, managers use the ratio to evaluate credit policies, spot troubling payment trends among customers, and decide whether to tighten terms or pursue more aggressive collection efforts.
The ratio also translates into a useful complementary measure: days sales outstanding, which expresses turnover as the average number of days it takes to collect payment. This makes the efficiency implied by the ratio tangible in calendar terms, allowing comparisons against industry norms and against the company’s own payment terms. When turnover declines, it can signal that customers are stretching payments, that credit standards have loosened, or that collection procedures need attention. Tracking the ratio over time gives stakeholders a practical gauge of whether the business is getting faster or slower at turning its credit sales into spendable cash, and that visibility is central to sound cash flow management.
Accounts receivable turnover formula
The accounts receivable turnover formula divides net credit sales by average accounts receivable, and each of the three components deserves close attention because the ratio’s usefulness depends on how carefully they are measured.
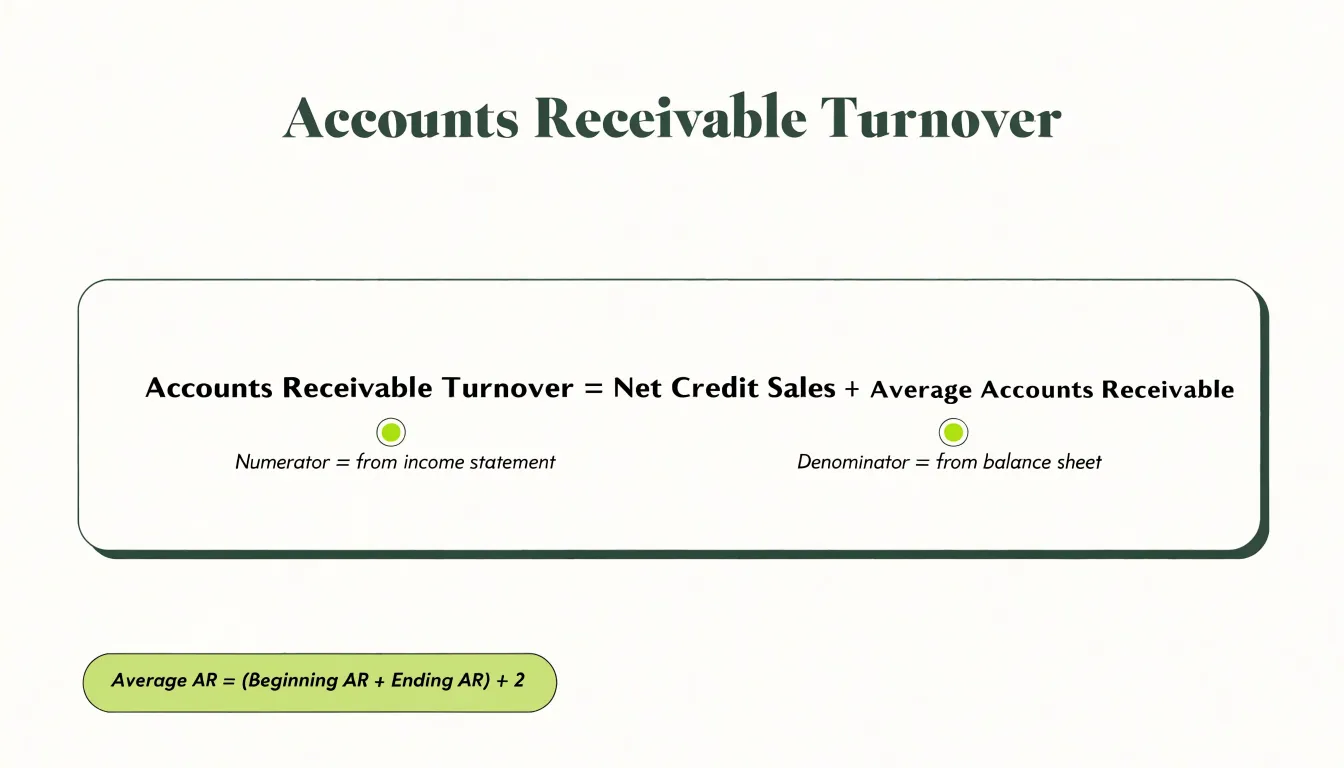
Net credit sales form the numerator. This figure begins with gross credit sales for the period and subtracts sales returns, sales allowances, and any early-payment discounts granted to customers. Cash sales are excluded entirely, since they never create a receivable. In practice, many analysts approximate net credit sales using total net sales when a company does not disclose the cash-versus-credit split; the resulting ratio is slightly understated, but it remains comparable across periods as long as the same convention is applied consistently. Companies that sell predominantly on credit, such as wholesale distributors, can use total net sales with little distortion.
The denominator, average accounts receivable, smooths out the seasonal and month-end fluctuations that make a single balance sheet date unrepresentative. The standard approach adds the beginning and ending receivable balances and divides by two. When monthly or quarterly data are available, a twelve-point average or the sum of each month-end balance divided by twelve produces a more accurate picture, particularly for businesses with strong seasonality. The ending balance alone is acceptable for quick estimates or when a company has just been acquired and no opening figure exists, but it can produce a misleading ratio if the closing date falls at an unusual point in the sales cycle.
A frequent point of confusion concerns gross versus net receivables. The allowance for doubtful accounts may be deducted to yield net receivables, which pairs logically with net credit sales, or the gross balance may be used to focus on collection speed before credit losses. Either is defensible provided the choice is disclosed and held constant.
Another common variation annualizes the result: dividing 365 by the turnover ratio yields days sales outstanding, expressing the same information as an average collection period. Analysts also compute the ratio on a trailing-twelve-month basis to neutralize interim seasonality. Whichever variation is chosen, the formula’s interpretive power rests on consistent definitions across the periods being compared, since a change in the treatment of discounts or allowances can shift the ratio independently of any change in collection performance.
Step-by-step calculation with a practical company example
To see how the accounts receivable turnover formula works in practice, consider a sample company we will call Northwind Supplies, a mid-sized distributor of industrial components. The calculation begins with two figures pulled directly from the balance sheet: the accounts receivable balance at the start of the period and the balance at the end. Suppose Northwind reported $180,000 in net receivables at the beginning of the fiscal year and $220,000 at the end. The first arithmetic step is to average these two figures. Adding them gives $400,000, and dividing by two yields an average accounts receivable balance of $200,000 for the year.
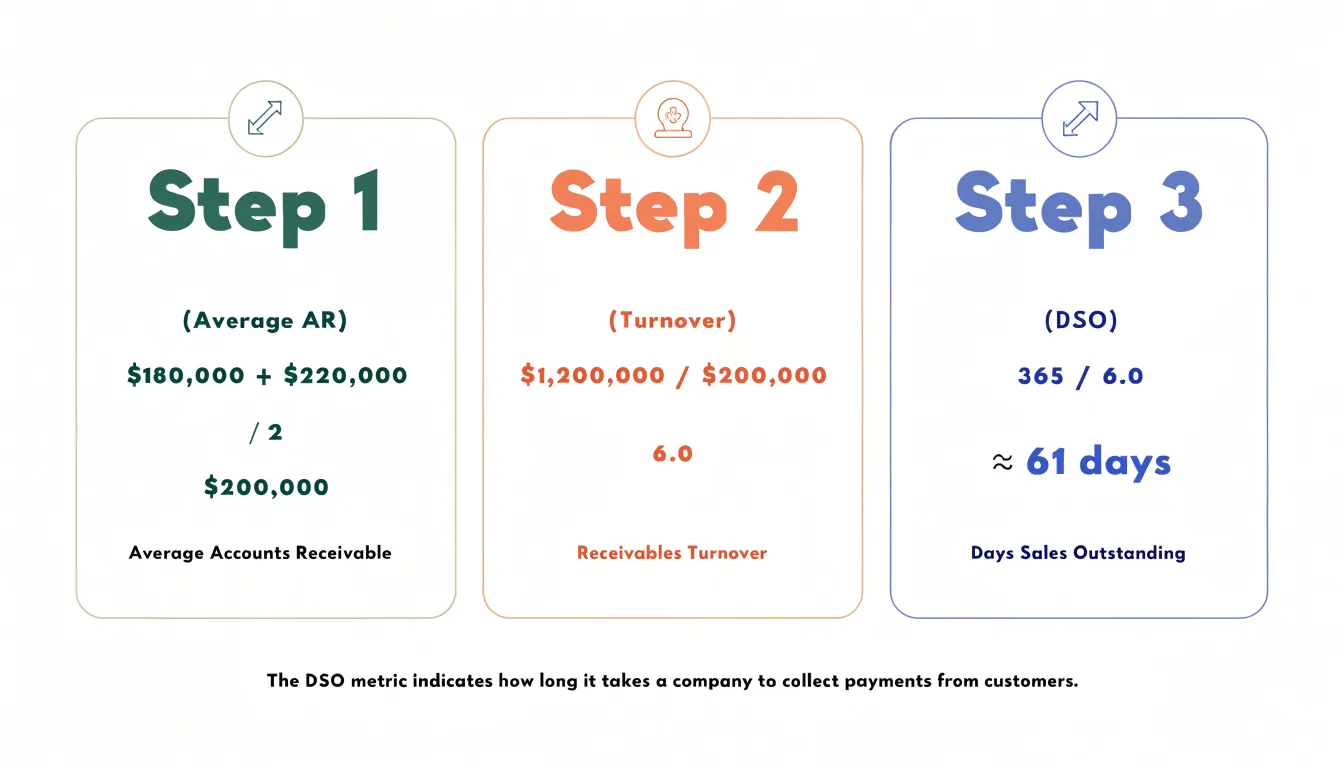
Next, the calculation requires net credit sales, which come from the income statement. Net credit sales represent total sales made on credit, less any returns, allowances, or discounts granted to customers. Assume Northwind recorded $1,200,000 in net credit sales during the year. With both inputs in hand, the turnover ratio is found by dividing net credit sales by the average accounts receivable balance: $1,200,000 divided by $200,000 equals 6.0. That figure means Northwind converted its average receivables balance into cash six times over the course of the year.
The turnover figure becomes more intuitive when converted into a collection period. Dividing 365 days by the turnover ratio of 6.0 produces an average collection period of roughly 61 days. In other words, after a credit sale is made, Northwind typically waits about two months before the customer pays. Management can then compare that 61-day figure against the company’s stated credit terms, such as net 30 or net 45, to judge whether customers are paying on schedule or whether collection efforts need tightening.
The walkthrough also highlights why the two-step structure of averaging the receivables balance and then dividing into net credit sales matters. Using a single year-end balance of $220,000 instead would yield a turnover of about 5.45 and a collection period closer to 67 days, a materially different picture. Averaging smooths out seasonal swings and gives a fairer representation of the company’s collection performance. Running the same arithmetic across several consecutive years allows Northwind’s finance team to spot trends, such as a steadily lengthening collection period, and to act before receivables become a drag on cash flow. The calculation is simple, but the discipline of applying it consistently is what turns the ratio into a useful management tool.
How do you convert turnover into days sales outstanding
Converting the accounts receivable turnover ratio into days sales outstanding gives the ratio a practical, time-based meaning. The turnover ratio tells you how many times receivables were collected during a period; days sales outstanding (DSO) tells you how long, on average, a customer takes to pay. The formula is straightforward: DSO equals 365 divided by the receivables turnover ratio. If the turnover ratio was calculated using a 365-day year, that same 365-day figure is used as the numerator, keeping the two metrics consistent. The result represents the average number of days credit sales remain outstanding before they are collected.
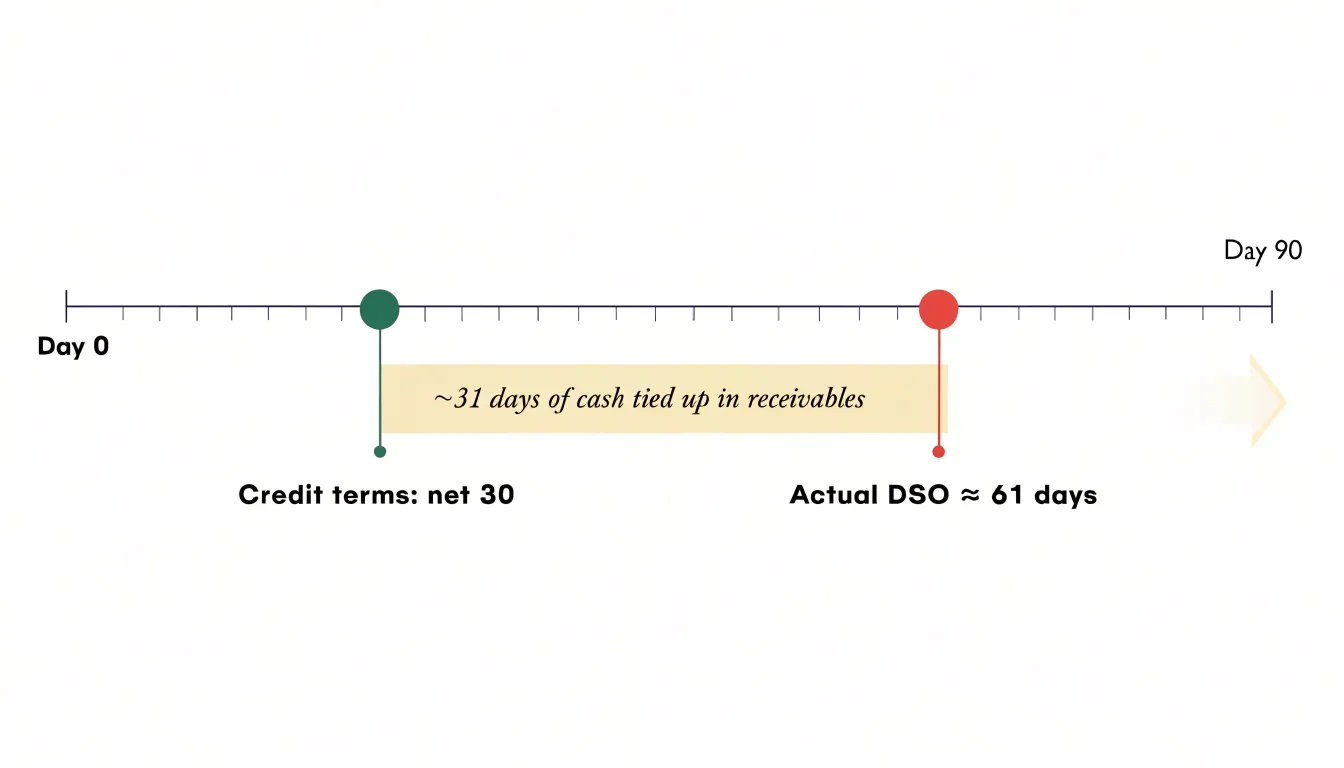
Consider a company with annual credit sales of $1,200,000 and average accounts receivable of $200,000. Dividing $1,200,000 by $200,000 gives a turnover ratio of 6. That means the company collected its average receivables balance six times during the year. Applying the formula, 365 divided by 6 equals roughly 60.8 days. On average, customers are taking about 61 days to pay. The same information can be reached by a slightly different route: $200,000 divided by $1,200,000 gives 0.1667, and multiplying by 365 yields the same 60.8 days. Both approaches illustrate that the ratio and the day count are two expressions of one underlying collection pattern.
That day count is easy to benchmark. If the company’s credit terms call for payment within 30 days, an average of 61 days signals that collections are running roughly a month behind schedule, tying up cash that could be used elsewhere. If terms are net 60, the same figure looks much healthier. Comparing DSO across months or quarters reveals trends: a DSO drifting upward shows collection slowing, while a falling DSO shows improvement. DSO also allows comparisons between companies or against industry norms, since expressing receivables in days normalizes for differences in sales volume.
When performing the calculation, keep the periods consistent. A turnover ratio built on a full year pairs with 365 days; a ratio built on a quarter pairs with 90 days or, if annualized, 365. Applying 365 to a quarterly turnover figure would overstate DSO. Used correctly, the conversion turns an abstract ratio into a concrete measure of how many days of sales are sitting uncollected in receivables.
What a high turnover ratio signals to lenders and investors
A high accounts receivable turnover ratio sends a clear signal to lenders and investors that a company converts its credit sales into cash quickly and reliably. The ratio measures how many times a business collects its average receivables during a period, so an elevated figure indicates that invoices are being paid promptly and that the collection process runs smoothly. For a lender evaluating a credit application, this efficiency translates directly into reduced risk. Fast collections mean cash arrives on a predictable schedule, giving the business the liquidity it needs to cover debt service, payroll, and supplier obligations without strain. A company that collects quickly is less likely to draw down a revolving line of credit or miss a payment because customers are sitting on overdue invoices.
Investors read the same metric as evidence of operational discipline and healthy cash flow. Strong collections shorten the cash conversion cycle, which frees up working capital that can be reinvested in inventory, product development, or growth initiatives. When receivables turn over rapidly, the business depends less on external financing to fund day-to-day operations, and reported earnings are more likely to be backed by actual cash rather than accounting accruals. Investors also note that efficient collection practices tend to correlate with a well-managed customer base and robust internal controls, both of which support sustainable performance.
At the same time, a high ratio deserves a closer look before it is treated as an unambiguous positive. An unusually elevated turnover figure can reflect an excessively strict credit policy that extends terms only to the safest customers or demands payment almost immediately. Such a policy may deter larger or slower-paying clients and constrain revenue growth over time. In some cases, a very high ratio simply means the company serves mostly cash customers, which makes the metric less meaningful as a measure of collection efficiency. Lenders and investors therefore typically pair the ratio with an examination of credit terms, customer concentration, and revenue trends to confirm that strong turnover reflects genuine operational strength rather than a restrictive sales posture that could limit future growth.
Why a low turnover ratio poses a risk to daily operations
A low accounts receivable turnover ratio signals that a company is collecting its outstanding receivables slowly, which introduces a range of operational risks that can destabilize day-to-day activities. When customers take longer to pay, the business faces a cash flow shortage: money that should be available for routine expenses—such as payroll, rent, utilities, inventory purchases, and supplier payments—remains tied up in unpaid invoices. This shortage can force the company to delay payments to its own suppliers, potentially damaging relationships and leading to less favorable credit terms or even supply disruptions. Additionally, slow collections often necessitate increased borrowing to cover operating costs. The company may need to draw on lines of credit or take out short-term loans to bridge the gap, which incurs interest expenses and reduces profitability. Over time, this reliance on debt can strain the company’s creditworthiness and limit its financial flexibility. Furthermore, a low turnover ratio heightens the risk of bad debt. The longer an invoice remains unpaid, the greater the likelihood that the customer will default, forcing the company to write off the receivable as uncollectible. This not only results in a direct financial loss but also consumes resources spent on collection efforts. The cumulative effect of these risks is a cycle of operational inefficiency: cash shortages lead to missed opportunities, such as taking advantage of early payment discounts from suppliers, and can erode employee morale if payroll or benefits are affected. Ultimately, a persistently low turnover ratio can threaten the company’s solvency and long-term viability, making it a critical metric for monitoring operational health.
Industry context
Accounts receivable turnover ratios vary widely from one industry to the next, and a figure that signals efficiency in one sector can look sluggish or suspiciously aggressive in another. Retail businesses, particularly those dealing in consumer goods, typically collect payment at the point of sale, which pushes their receivable balances close to zero and can produce turnover ratios that run extraordinarily high, sometimes into the hundreds. A retailer that extends generous trade credit to commercial buyers, by contrast, may post a far more modest ratio while still operating efficiently. Manufacturing firms present a different profile altogether. They often sell to distributors and large customers on negotiated terms of thirty, sixty, or ninety days, so their receivables remain outstanding for longer periods and their turnover ratios settle into a lower, steadier range. Construction, wholesale distribution, and professional services each have their own rhythms shaped by contract terms, billing cycles, and the bargaining power of buyers.
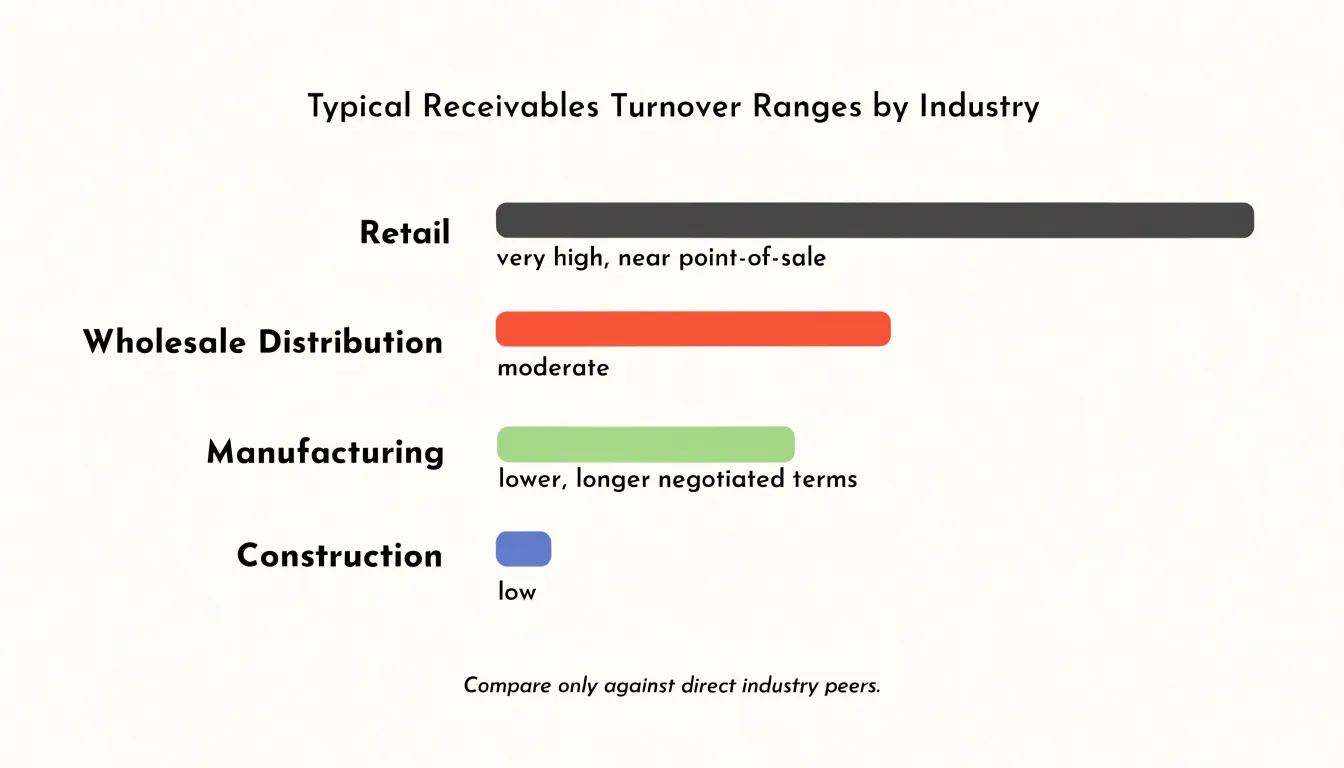
These structural differences mean that absolute thresholds have little meaning on their own. A turnover ratio of four might represent excellent performance for a heavy equipment manufacturer whose customers negotiate long payment windows, while the same ratio would suggest serious collection problems for a business that invoices consumers on standard thirty-day terms. Judging performance against a generic benchmark risks drawing the wrong conclusion about credit policy, collection efforts, or customer quality. The more reliable approach is to compare a company’s ratio against those of direct competitors and against its own historical trend. Peer benchmarking accounts for shared customer expectations, common contract structures, and similar working capital conventions, making deviations meaningful rather than misleading.
Analysts and business owners benefit from building a reference range drawn from close industry peers, ideally segmented by company size and customer mix. A ratio drifting toward the low end of that peer range may warrant a review of credit terms or collection procedures, while a ratio far above the peer norm could indicate overly restrictive credit that is costing sales. Used this way, accounts receivable turnover becomes a diagnostic tool grounded in context rather than a rigid pass-fail test, and the insights it produces are far more actionable for management and investors alike.
Common calculation mistakes and how seasonal sales distort results
One of the most frequent errors in calculating accounts receivable turnover is using total sales in the numerator instead of net credit sales. The turnover ratio is intended to measure how efficiently a company collects the money customers owe it on credit, so mixing in cash sales inflates the numerator and produces a ratio that looks stronger than reality. A related mistake is using year-end receivables rather than an average of beginning and ending balances. Because receivables can swing sharply within a year, a single point-in-time figure may reflect a temporary high or low, and averaging the two endpoints gives a more representative denominator that smooths out routine fluctuations.
Seasonal businesses face a particular challenge. A retailer that earns most of its revenue during a holiday quarter, or an agricultural supplier that ships heavily in spring, will show receivables peaking at predictable times. If the analyst pairs high seasonal sales with a low off-season receivables balance, the ratio spikes artificially. If the timing is reversed, the ratio can look weak even when collection performance is unchanged. The result is a metric that says more about the calendar than about the credit department.
Adjusting for seasonality starts with matching the numerator and denominator to the same period. Monthly or quarterly turnover calculations, rolled up into an annual average, capture the rhythm of the business far better than a single annual snapshot. Analysts can also use a trailing twelve-month average of receivables paired with trailing twelve-month credit sales, which spreads the seasonal peaks across the full cycle. Comparing the same quarter year over year, rather than consecutive quarters, removes the seasonal distortion entirely and highlights genuine changes in collection speed.
Finally, a business should document which receivables are included. Writing off uncollectible accounts, excluding intercompany balances, and separating notes receivable from trade receivables all keep the ratio clean. When these adjustments are applied consistently, the turnover figure becomes a reliable signal that management and lenders can trust across reporting periods.
Actionable strategies to accelerate customer collections
Accelerating customer collections begins with a clear, consistently enforced credit policy. Before extending terms to a new customer, establish written criteria for creditworthiness, including references, financial statements, or third-party credit scores, and set credit limits that reflect the assessed risk. Review these limits periodically and adjust them as payment behavior emerges. A policy only works when it is applied uniformly, so document the approval process and make sure sales staff understand that exceptions require formal sign-off rather than informal leniency.
Early payment discounts give customers a financial reason to settle invoices ahead of schedule. A common structure offers a small percentage reduction, such as one or two percent, for payment within ten days, with net terms at thirty days. The cost of the discount is often outweighed by the cash flow benefit and the reduction in collection effort. Communicate the offer clearly on every invoice and track how many customers take advantage of it, since participation rates indicate whether the incentive is priced correctly.
Automating invoicing and reminders removes delay from the collection cycle. Invoices should be generated and sent the moment goods or services are delivered, rather than batched at month end. Automated reminder sequences can follow a fixed schedule, sending a polite notice a few days before due dates, a follow-up on the due date, and escalating messages at set intervals afterward. Automation ensures no account slips through unnoticed and frees the collections team to focus on problem accounts rather than routine follow-up.
Segmenting customers by risk allows collection resources to be directed where they matter most. Customers can be grouped by payment history, outstanding balance, or credit score, with each segment receiving a different cadence of reminders and follow-up. High-risk accounts might warrant a phone call before the due date, while reliable customers can receive lighter-touch automated messages. Regular review of segment membership keeps the classification current as payment behavior changes. Together, these tactics shorten the gap between sale and cash receipt, lifting accounts receivable turnover and strengthening overall liquidity.
Frequently Asked Questions
How is accounts receivable turnover calculated?
It is calculated by dividing net credit sales by average accounts receivable for the period. Average accounts receivable is typically the beginning and ending receivable balances added together and divided by two.
Is a high accounts receivable turnover ratio always a good sign?
A high ratio signals that customers are paying promptly and cash is being converted quickly, which lenders and investors may view as reduced risk and operational discipline. However, an unusually elevated ratio can reflect an overly strict credit policy or a business that serves mostly cash customers, so it should be paired with credit terms, customer concentration, and revenue trends.
What does a low accounts receivable turnover ratio mean for a business?
It indicates that receivables are being collected slowly, which can create a cash flow shortage tied up in unpaid invoices and may force increased borrowing to cover operating costs. Slow collections also heighten the risk of bad debt and can strain supplier relationships, creditworthiness, and financial flexibility.
How do you convert accounts receivable turnover into days sales outstanding?
Days sales outstanding equals 365 divided by the receivables turnover ratio when the ratio is based on a 365-day year. Keep the periods consistent; for example, a quarterly turnover ratio pairs with 90 days rather than 365.
Why can seasonal sales distort accounts receivable turnover?
If high seasonal sales are paired with a low off-season receivables balance, the ratio can spike artificially, and the reverse timing can make collection performance look weak. Matching the numerator and denominator to the same period, using monthly or quarterly calculations, trailing twelve-month averages, or same-quarter year-over-year comparisons helps remove the distortion.
How can a company improve its accounts receivable turnover?
It can start with a clear, consistently enforced credit policy and early payment discounts that give customers a financial reason to pay ahead of schedule. Automating invoicing and reminders and segmenting customers by risk also help direct collection efforts and shorten the gap between sale and cash receipt.