
Burn Rate
Burn rate is the net cash a business spends over a period, typically a month, calculated as the gap between cash inflows (customer payments, loans) and outflows (payroll, rent, inventory). Gross burn is total monthly spend; net burn subtracts cash received, and dividing cash balance by average net burn gives runway in months.
Table of Contents
- What does burn rate actually measure in your cash flow?
- Gross burn versus net burn
- Step by step guide to calculating your monthly burn rate
- How to accurately calculate your remaining financial runway
- What is a safe runway length for early stage stability?
- Identifying non essential expenses that quietly drain cash
- Practical strategies to extend your financial runway immediately
- Revenue expansion
- How to monitor burn rate over time to prevent sudden cash shortages
What does burn rate actually measure in your cash flow?
Burn rate measures the net cash outflow of a business over a defined period, typically a month. The calculation starts with the cash balance at the beginning of the period and compares it to the cash balance at the end. If the ending balance is lower, the difference is the burn. Money that arrived from customers, loans, or asset sales counts as inflow; money paid for payroll, rent, inventory, software subscriptions, and everything else counts as outflow. Burn rate is simply the gap between those two totals, expressed as a positive number when the business is spending more than it brings in. A company burning $50,000 a month has seen its bank balance fall by roughly that amount over the period.
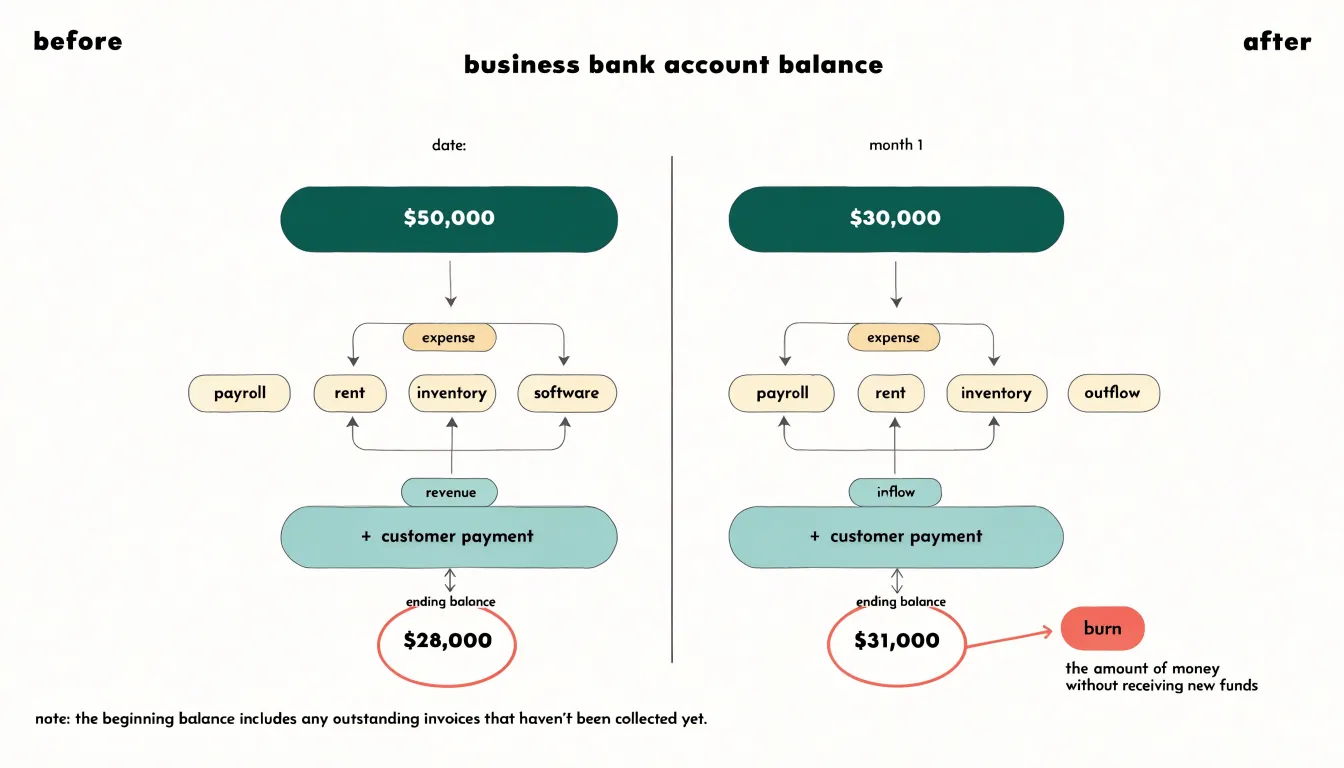
The critical distinction is between burn rate and accounting profit or loss. An income statement records revenue when it is earned and expenses when they are incurred, regardless of when cash actually moves. A business can show a healthy profit on paper while its bank account drains, because customers who were invoiced have not yet paid, or because a large inventory purchase was capitalized rather than expensed. The reverse also happens: a company can post a loss for the quarter while cash rises, thanks to a big prepayment from a customer or a delayed supplier payment. Burn rate ignores those accrual conventions entirely. It tracks only what has actually landed in or left the account, which is why it is the figure founders watch when they need to know how long the company can keep operating.
Cash flow timing matters because obligations arrive on fixed dates while receipts do not. Payroll must be met every two weeks, rent is due on the first, and loan payments follow a schedule set by the lender. Customer payments, by contrast, arrive whenever the customer decides, often thirty, sixty, or ninety days after the invoice. A profitable quarter can still end in a cash crisis if the money owed to the business is sitting in a customer’s accounts payable ledger while the company’s own bills come due. Burn rate captures that timing mismatch directly, showing the real pace at which liquidity is consumed. For planning purposes, it is the most honest measure of runway available to the business.
Gross burn versus net burn
Gross burn and net burn are two distinct measurements of how a company consumes cash, and understanding the difference helps founders and investors interpret a startup’s financial health accurately. Gross burn represents the total amount of cash a company spends in a given period, typically a month. It captures every outgoing payment: salaries, rent, software subscriptions, marketing spend, inventory purchases, and any other operating expense. Gross burn answers a straightforward question: how much does it cost to run this business for a month? For a company in early development, this figure provides a clear picture of the total resources required to keep operations moving, independent of any money coming in.
Net burn subtracts cash received during the same period from the gross figure. If a company spends $200,000 in a month on all expenses but collects $80,000 in customer payments, its net burn is $120,000. This number reflects the actual rate at which the cash balance declines, which is the figure that directly determines runway. When a founder asks how many months of operation remain before the bank account runs dry, net burn is the metric that answers the question.
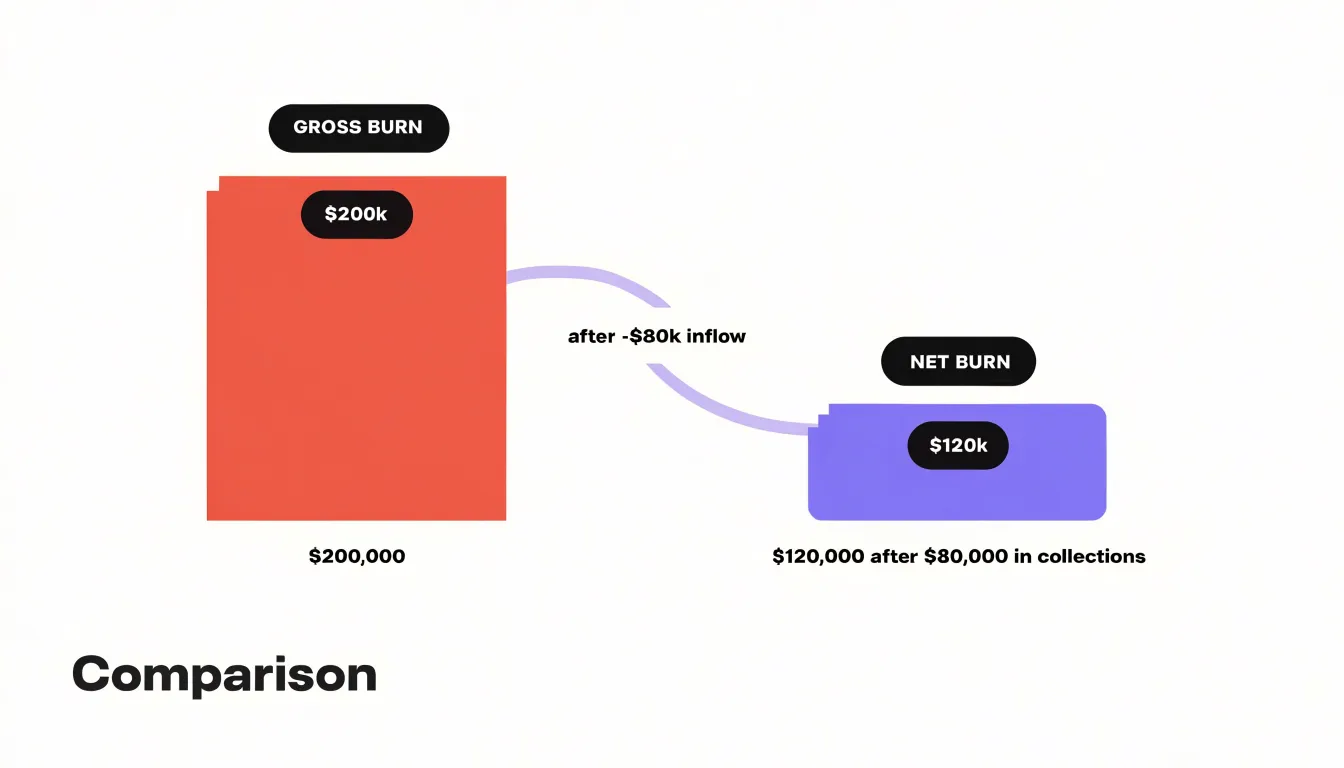
Each measure serves different purposes. Gross burn is most useful when evaluating the underlying cost structure of the business. A company with high gross burn but strong collections may look efficient on a net basis while still carrying substantial fixed obligations that must be met regardless of revenue timing. Investors examining cost discipline often look at gross burn to understand how lean the operation truly is. Net burn becomes the more relevant figure once revenue is flowing and predictable. It is the number used in runway calculations, fundraising timelines, and discussions about when the company might reach profitability. A business approaching break-even will see its net burn shrink toward zero even if gross burn remains steady, which signals progress toward self-sufficiency.
Watching both figures together gives the fullest picture. A rising gross burn paired with a flat net burn suggests spending is scaling in proportion to revenue generation. A falling net burn driven by higher collections rather than cost cuts tells a different story than one achieved through layoffs or deferred spending. Tracking both metrics over time helps leaders spot which lever is actually moving the cash position.
Step by step guide to calculating your monthly burn rate
Calculating monthly burn rate begins with collecting complete bank and credit card statements for the period you want to analyze. Pull at least three months of statements, ideally six, from every account the business uses, including payment platforms and petty cash records. Export transactions into a spreadsheet so every line item is visible and sortable. Once the data is assembled, classify each transaction as either an outflow or an inflow. Outflows cover payroll, rent, utilities, software subscriptions, vendor payments, loan repayments, taxes, and any owner draws. Inflows include customer receipts, refunds received, interest income, and any other cash entering the accounts. Summing all outflows for a given month gives gross cash spend, while summing inflows gives total cash received. Subtracting inflows from outflows produces the net burn figure, which shows how much cash the business consumed during that month. When inflows exceed outflows, the result is negative burn, meaning the business generated cash rather than spending it. Because a single month can be distorted by annual insurance premiums, quarterly tax payments, or a large one-off equipment purchase, averaging net burn across several months smooths these spikes and reveals the underlying monthly consumption rate. Add the monthly net burn figures together and divide by the number of months in the sample to arrive at the average. Track this figure on a recurring schedule, updating it each month as new statements arrive, so trends become visible over time. Document the categories used for classification so the process stays consistent from month to month, and keep the underlying statements archived alongside the spreadsheet. A consistent, repeatable routine turns burn rate from a rough estimate into a reliable metric that supports planning, budgeting, and conversations with investors or lenders.
How to accurately calculate your remaining financial runway
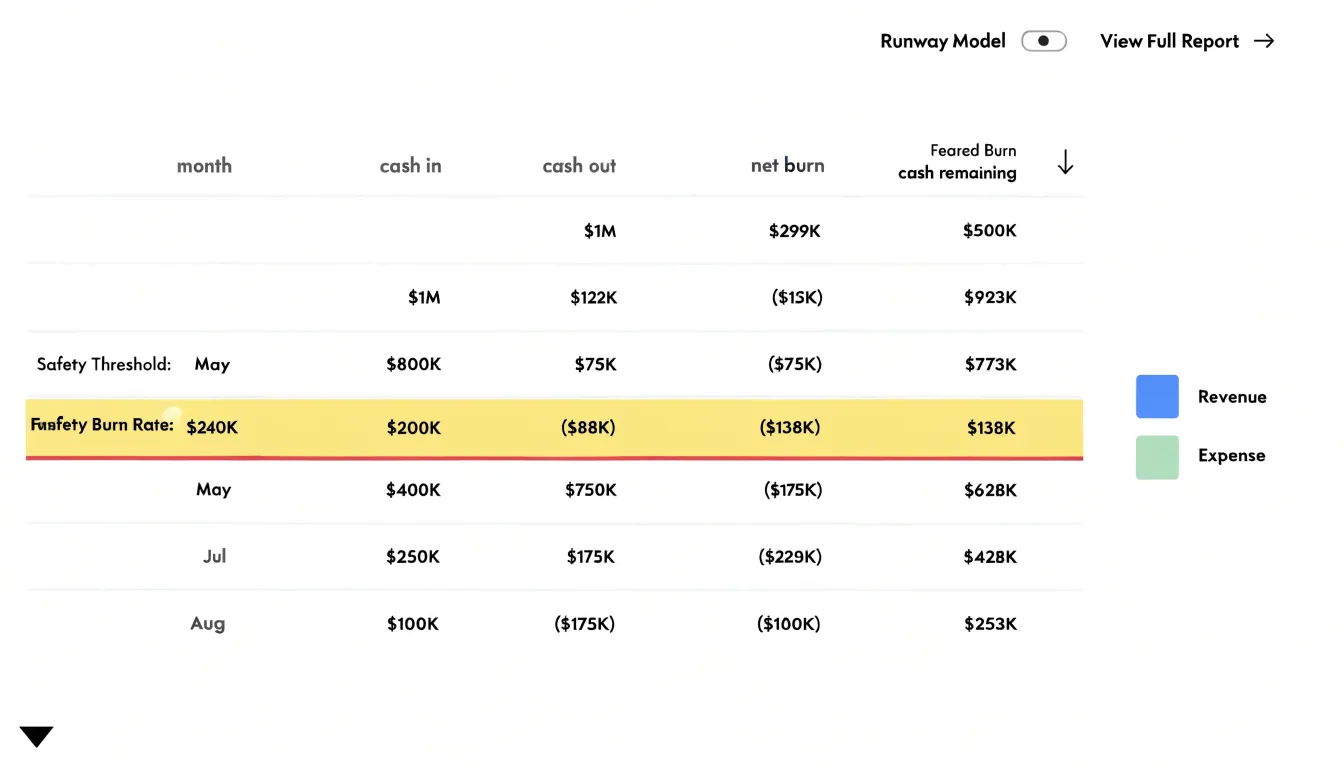
Calculating your remaining financial runway begins with a deceptively simple formula: runway equals your current cash balance divided by your average monthly net burn. The cash balance is straightforward — it is the total amount of liquid funds available in your bank accounts at a given moment. Net burn is where the nuance lives. Net burn is the difference between what you spend and what you bring in each month. If you spend $120,000 monthly and collect $40,000 in revenue, your net burn is $80,000. Divide a $960,000 cash balance by that $80,000 net burn and you arrive at a 12-month runway. The word average matters here, because a single month can mislead. A month with an annual insurance payment or a quarterly tax bill will spike burn temporarily, while a month with a large customer prepayment will depress it. Pulling a three- to six-month trailing average smooths out these lumpy movements and gives you a more honest picture of your underlying consumption rate. Once you have the baseline figure, adjustments turn a static number into a planning tool. Expected revenue growth changes the denominator over time. If you anticipate adding $15,000 in monthly recurring revenue by the third month, your net burn shrinks in later periods, and a simple division understates your true runway. You can model this by projecting burn month by month rather than dividing by a single average. Upcoming large expenses work in the opposite direction. A planned office build-out, a major equipment purchase, or a contractual payment owed in four months consumes cash in a concentrated way. Folding these known outflows into your projection prevents the unpleasant surprise of discovering your runway is shorter than the headline figure suggests. The practical approach is to build a short spreadsheet: list monthly cash in, monthly cash out including one-time items, compute net burn per month, and subtract cumulatively from the opening balance until the figure approaches zero. The month where cash crosses below your safety threshold is your true runway. Revisit the calculation monthly, since both cash and burn shift constantly.
What is a safe runway length for early stage stability?
Founders and investors often use a range of six to eighteen months as a rough reference point for early stage runway, and within that band the appropriate target shifts depending on where a company sits in its development. A team still searching for product-market fit typically needs a longer buffer, because the path to a fundable milestone is uncertain and the cost of raising a round before that milestone exists can be steep. Companies with early revenue and clear signals of demand can often operate with a shorter runway, since they have more leverage and more predictable cash inflows to draw on. The benchmark is useful as a starting frame, and the specific number should follow from a careful look at the company’s own circumstances.
Fundraising plans weigh heavily on the right runway. A company planning to raise its next round in six months needs enough cash to cover the raise itself, which often takes longer than anticipated, plus a cushion for the months after close when new hires and spending ramp up. The runway has to extend past the point where the round is expected to close, with margin for slippage. Teams that begin fundraising with only a few months of cash left tend to accept worse terms or scramble into bridge financing, and building the target runway around the raise timeline protects against that outcome.
Revenue predictability is the other major factor. Recurring, contracted revenue lets a company forecast cash with more confidence and justify a leaner runway, while lumpy or early-stage sales cycles argue for a larger reserve. A business with steady subscription income can plan spending against a known baseline; a business waiting on a handful of large deals needs a longer buffer to absorb delays.
A safe runway is one that covers the milestones the company needs to hit, the time those milestones realistically require, and the fundraising process that follows. Six to eighteen months offers a helpful starting range, and the right figure for any given company comes from its stage, its capital plans, and the reliability of its revenue forecast.
Identifying non essential expenses that quietly drain cash
A disciplined spending audit starts with the assumption that some cash is leaking through channels nobody is actively watching. Begin by pulling twelve months of bank and credit card statements into a single spreadsheet, then sort every line item by vendor and recurring amount. The goal is to see patterns rather than individual transactions, because leaks are rarely one-time purchases. They are small, regular charges that blend into the noise of monthly bookkeeping.
Subscriptions are the most common culprit. List every recurring service charge, from SaaS platforms to industry publications to cloud storage plans, and map each one to a specific owner inside the company. Any subscription without a named owner is a strong candidate for cancellation. Pay particular attention to annual renewals that auto-charge; these often slip past review because they arrive once a year and are coded as ordinary operating expenses. Contact vendors with overlapping tools and ask whether seats can be consolidated or downgraded.
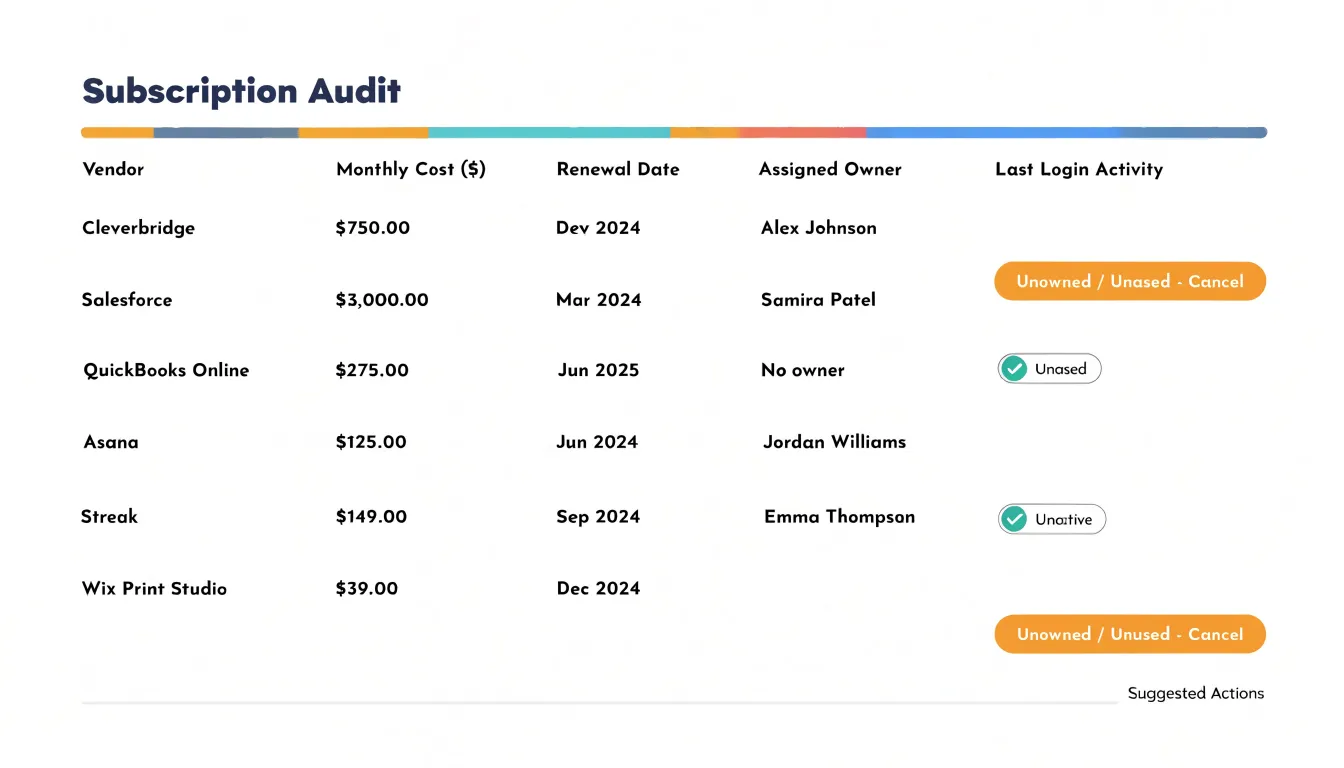
Software licenses deserve a separate pass. Compare the number of seats you pay for against actual login activity over the past ninety days. Tools that show heavy adoption among a few users and near-zero use elsewhere can be trimmed to match real demand. Many vendors offer usage dashboards or will provide activity reports on request. The same logic applies to storage tiers, API call volumes, and support plans that were sized for a busier period.
Travel and entertainment spending rewards a similar line-by-line review. Group expenses by trip or event, then ask whether the outcome justified the cost. Recurring conference attendance, upgraded fares, and team offsites with loose budgets tend to accumulate year over year. Consider whether virtual attendance, earlier booking, or consolidated trips would preserve the business value at a fraction of the spend. Finally, examine vendor contracts and professional services for scope creep: retainers for work that has wound down, maintenance agreements on equipment that is no longer critical, and consulting hours that have crept into routine operations. Each cut you identify should be tested against one question: does removing this expense threaten revenue, compliance, or delivery? Everything that survives that test is fair game for the chopping block.
Practical strategies to extend your financial runway immediately
Extending your financial runway starts with a clear-eyed review of where money is leaving the business right now. Begin with contracts. Pull every recurring agreement, from software subscriptions to professional services, and identify renewal dates and termination clauses. Many vendors have room to negotiate, especially if you offer a longer commitment or pay annually in advance. A modest discount on several large contracts compounds into meaningful savings over a quarter. Where negotiation fails, look for overlapping tools and cancel duplicates; teams often accumulate multiple products that serve the same function.
Hiring decisions deserve similar scrutiny. Freeze roles that do not directly generate revenue or support a critical launch, and spread remaining work across the existing team where feasible. For essential gaps, consider contractors or part-time arrangements that carry lower fixed costs and can be scaled back quickly. Every delayed hire preserves salary, benefits, and onboarding expenses that would otherwise hit the bank account within weeks.
Marketing spend is another lever that responds quickly to adjustment. Audit campaigns by return on investment and pause channels that produce weak or unmeasurable results. Shift budget toward proven acquisition paths and negotiate performance-based terms with agencies and media partners. Reducing spend does not require going dark; it means concentrating resources where the evidence supports them and cutting the experiments that have not earned their keep.
Vendor consolidation rounds out the immediate tactics. Request quotes from lower-cost alternatives for commodity services like shipping, cloud hosting, payroll processing, and office supplies. Switching providers often takes only a few weeks and can trim fixed costs by double-digit percentages. Combine this with renegotiating payment terms, asking suppliers to extend net-30 to net-60, which improves cash timing even when headline prices stay the same.
The common thread is speed. Each of these moves can be executed within a billing cycle, and together they slow the rate at which cash leaves the business. Track the savings in a simple dashboard so the impact on runway stays visible, and revisit the list monthly as circumstances change. Small, consistent reductions in burn buy the time needed to reach the next milestone or close the next round.
Revenue expansion
Revenue expansion is one of the most direct levers a company has for improving its cash position and extending its runway. The core idea is straightforward: every additional dollar of income reduces the gap between what the business spends and what it earns, pushing the point of profitability closer. There are several practical routes to achieving this, and each carries different implications for cash timing and operational effort.
Pricing adjustments offer the fastest path to revenue growth because they require no new production or distribution. A modest increase in prices, applied selectively to customers or products with low price sensitivity, can lift cash inflows almost immediately. Companies often overlook the compounding effect of small pricing changes, which flow directly to the bottom line without proportional cost increases.
Upselling existing customers builds on relationships already in place. Because acquisition costs are sunk, selling additional products, upgraded tiers, or expanded service packages to current buyers tends to be more cash-efficient than chasing new accounts. This approach also shortens the sales cycle, meaning cash arrives sooner.
Launching new products or services opens fresh revenue streams, though this route demands investment of time and resources before returns materialize. It works best when the new offering aligns with existing capabilities and customer demand, allowing the company to leverage its current infrastructure rather than building from scratch.
Accelerating collections addresses the timing side of revenue expansion. Even healthy sales figures mean little if invoices go unpaid for months. Tightening payment terms, offering small discounts for early payment, automating invoicing, and following up on overdue accounts all convert earned revenue into available cash more quickly. This improvement in the cash conversion cycle can fund operations without any increase in sales volume.
Taken together, these strategies give a business multiple ways to strengthen its cash inflows. The right mix depends on the company’s stage, its customer base, and how urgently it needs cash. A disciplined approach to revenue expansion, reviewed regularly against actual results, keeps the burn rate in check while the business works toward sustainable profitability.
How to monitor burn rate over time to prevent sudden cash shortages
Monitoring burn rate over time gives a business the visibility it needs to act before a cash shortage becomes a crisis. The foundation of that monitoring is a monthly cash flow dashboard. A well-built dashboard consolidates the numbers that matter most: opening cash balance, total inflows, total outflows broken down by category such as payroll, rent, software, and marketing, and the closing balance for the month. It should also show net burn, the difference between what the company spends and what it brings in, along with a runway figure calculated by dividing current cash by the average net burn. Building this dashboard in a spreadsheet or accounting tool and updating it on a fixed monthly schedule creates a reliable record that anyone in leadership can review at a glance. Consistency matters more than sophistication; a simple dashboard updated every month tells a clearer story than an elaborate one that gets abandoned.
Once the dashboard is in place, the next step is tracking burn rate trends rather than looking at any single month in isolation. One month of elevated spending might reflect a one-time purchase or an annual bill, while three consecutive months of rising net burn signals something structural. Plotting burn rate month over month reveals whether spending is creeping upward, whether revenue growth is keeping pace, and whether the runway is shortening faster than planned. Trend tracking also helps separate recurring costs from temporary spikes, which keeps decisions grounded in the underlying direction of the business rather than in noise.
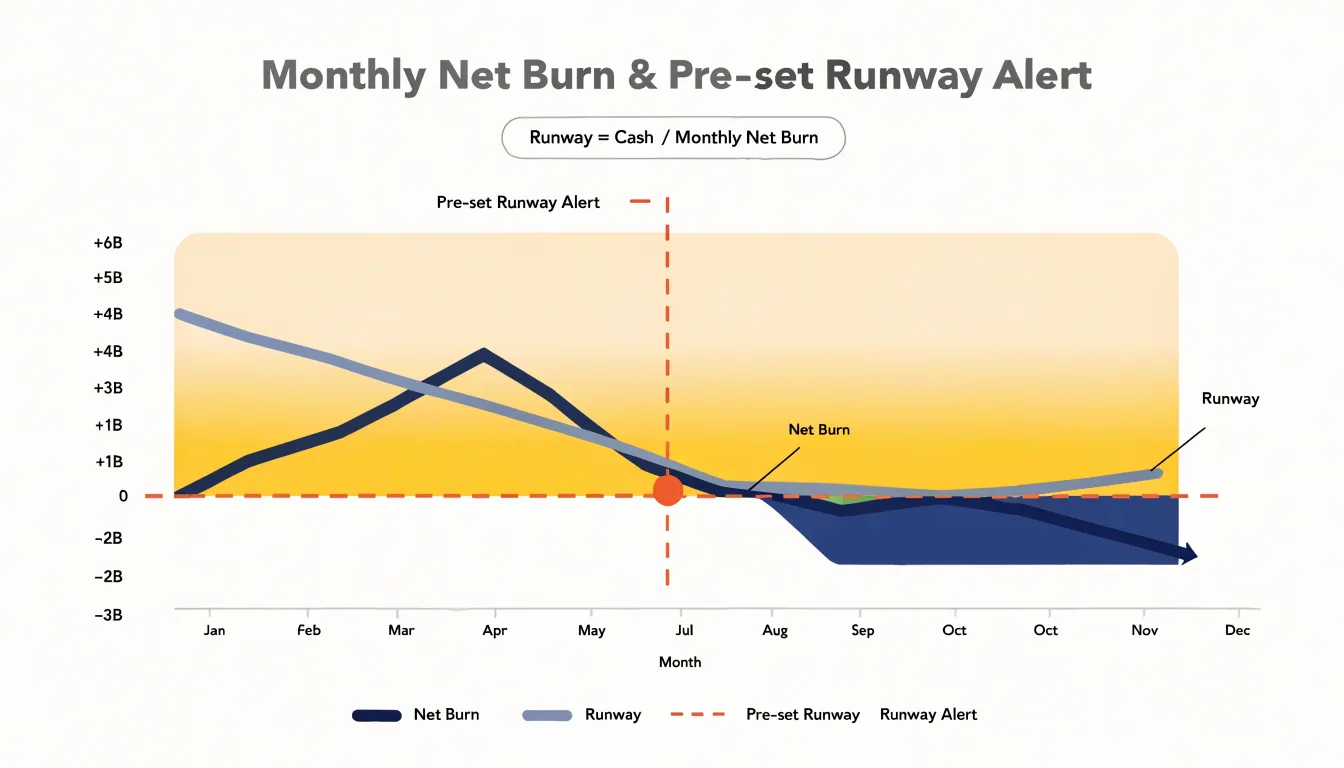
Triggers and alerts turn monitoring into action. Leadership can define thresholds in advance, such as a runway dropping below six months, net burn rising more than a set percentage over a three-month average, or the cash balance falling below a predetermined floor. When a threshold is crossed, the team has a pre-agreed response: reviewing discretionary spending, delaying non-critical hires, accelerating collections, or adjusting the revenue plan. Setting these triggers while cash is healthy removes the emotion from later decisions and ensures the company responds early, when small adjustments are still enough to protect the balance sheet.
Frequently Asked Questions
What does burn rate measure in a business?
Burn rate measures the net cash outflow over a defined period, typically a month, by comparing the beginning and ending cash balance. A company burning $50,000 a month has seen its bank balance fall by roughly that amount.
What is the difference between gross burn and net burn?
Gross burn is the total cash a company spends in a period, while net burn subtracts cash received during that same period from the gross figure. Net burn reflects the actual rate at which the cash balance declines and is used to determine runway.
How do I calculate my monthly burn rate?
Collect complete bank and credit card statements, classify every transaction as an outflow or inflow, then subtract total inflows from total outflows to produce net burn. Averaging net burn across several months helps smooth one-off spikes and reveal the underlying monthly consumption rate.
How do I calculate my remaining financial runway?
Runway equals your current cash balance divided by your average monthly net burn. Using a three- to six-month trailing average helps smooth lumpy movements and gives a more honest picture of your consumption rate.
What is a safe runway length for an early-stage company?
The article gives six to eighteen months as a rough reference range for early-stage runway, with the right target depending on the company’s stage, fundraising plans, and revenue predictability. Teams still searching for product-market fit typically need a longer buffer.
How can I extend my financial runway immediately?
The article recommends reviewing recurring contracts, freezing roles that do not directly generate revenue or support a critical launch, auditing marketing spend, consolidating vendors, and asking suppliers to extend payment terms. These moves can generally be executed within a billing cycle.