
Cash Flow Statement
A cash flow statement is a financial statement that converts accrual-based net income into actual cash movements across three sections—operating, investing, and financing activities—reconciling the period’s opening and closing cash balances. It exists because net income records revenue and expenses when earned or incurred, not when cash changes hands, so profitable companies can still run out of cash.
Table of Contents
- Why net income does not equal actual cash in the bank
- Operating activities and day to day business transactions
- Adjusting net income for non cash expenses like depreciation
- Investing activities
- Financing activities for debt equity and owner payouts
- How the three sections connect directly to your balance sheet
- Spotting red flags hidden inside a positive cash flow report
- What healthy cash flow looks like across different business stages
Why net income does not equal actual cash in the bank
Net income is calculated according to accrual accounting principles, which recognize revenue when it is earned and expenses when they are incurred, regardless of when cash actually changes hands. This timing difference creates a gap between the profit reported on the income statement and the cash sitting in the bank account. When a company delivers goods or services to a customer on credit, it records the revenue immediately and books an account receivable, even though no cash has arrived yet. The income statement shows a sale and a profit, but the bank balance remains unchanged until the customer pays. On the expense side, the same logic applies in reverse. A business may receive a utility bill, an inventory shipment, or professional services in a given month and record those costs right away, building up accounts payable, while the actual payment goes out weeks later. The expense reduces reported profit today; the cash leaves tomorrow.
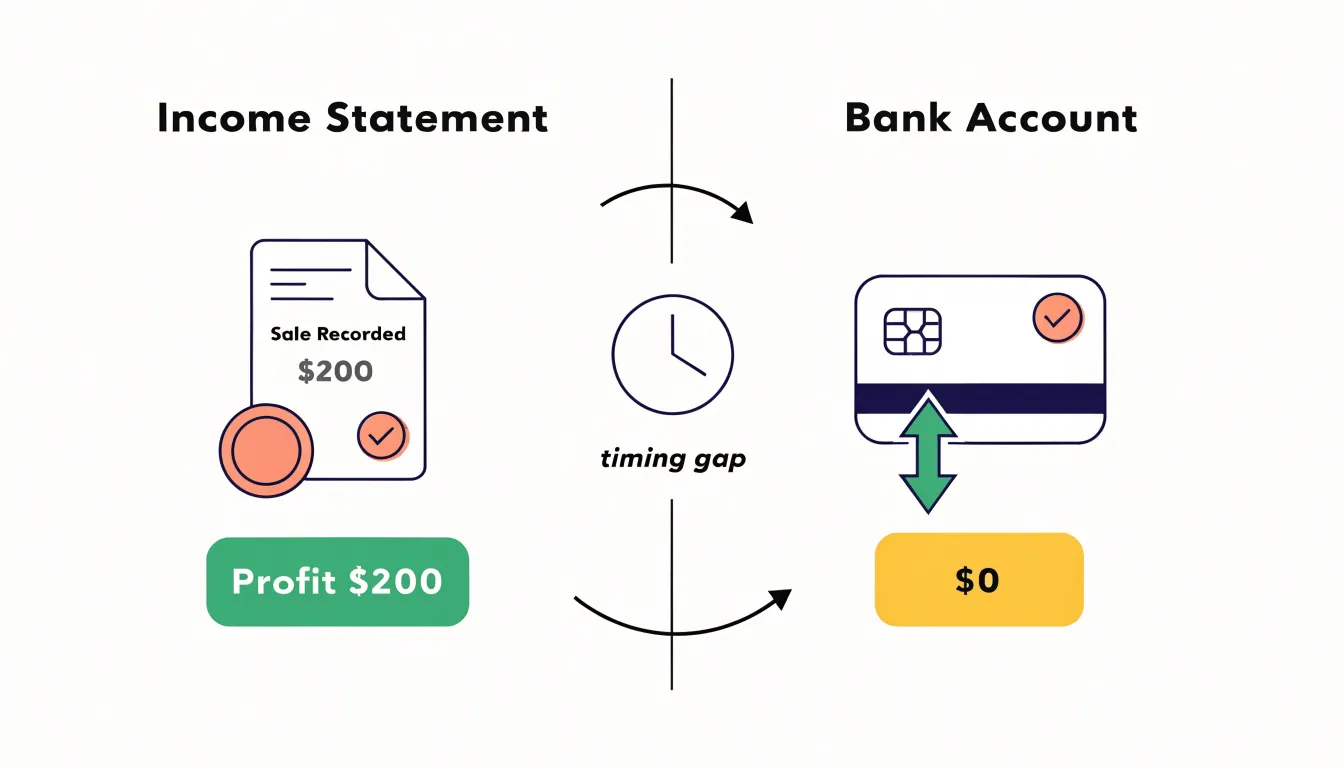
These timing mismatches accumulate in working capital accounts such as receivables, payables, and inventory, and they explain why a profitable business can still run out of cash. Consider a company that books a large sale on generous payment terms. It records revenue, pays commissions and taxes on the resulting profit, and may even invest in extra inventory to fulfill future demand, all before the customer settles the invoice. If several customers stretch their payments or a major client delays, the cash needed to cover payroll, rent, and supplier obligations may simply not be there, even though the income statement looks healthy. Rapid growth intensifies the problem, because each new sale requires cash outlays for materials and labor well before the corresponding collection occurs. A business can be growing its reported earnings quarter after quarter while its bank balance steadily drains.
This is why the cash flow statement exists as a companion to the income statement. It converts accrual-based profit back into actual cash movements by adjusting for non-cash items and changes in working capital, giving owners and managers a clear view of liquidity. Tracking the accrual gap helps a business anticipate shortfalls, tighten collection policies, negotiate supplier terms, and arrange credit lines before a cash crunch arrives.
Operating activities and day to day business transactions
The operating activities section of the cash flow statement focuses on the cash effects of the day-to-day business transactions that generate revenues and expenses. This section begins with cash received from customers for sales of goods or services. When a company makes a sale, it may not immediately collect cash; however, the cash flow statement captures the actual cash inflows from collections of accounts receivable, as well as cash sales. Similarly, cash payments to suppliers for inventory and raw materials, and to employees for wages and salaries, are recorded as outflows. These transactions are the core of the operating section because they reflect the primary revenue-generating activities of the business.
Changes in working capital accounts, such as receivables and inventory, are crucial in reconciling net income to cash flow from operations. An increase in accounts receivable indicates that sales were made on credit and cash has not yet been collected, which reduces operating cash flow relative to net income. Conversely, a decrease in receivables means that cash collections exceeded new credit sales, boosting operating cash flow. Inventory changes similarly affect cash flow: an increase in inventory implies that cash was used to purchase or produce more goods than were sold, leading to a cash outflow. A decrease in inventory suggests that cash was freed up as existing stock was sold. Other working capital items, such as prepaid expenses and accounts payable, also play a role. For example, an increase in accounts payable means that the company has delayed paying its suppliers, which temporarily increases operating cash flow. These adjustments are essential because they convert accrual-based net income into the actual cash generated or used by operations.
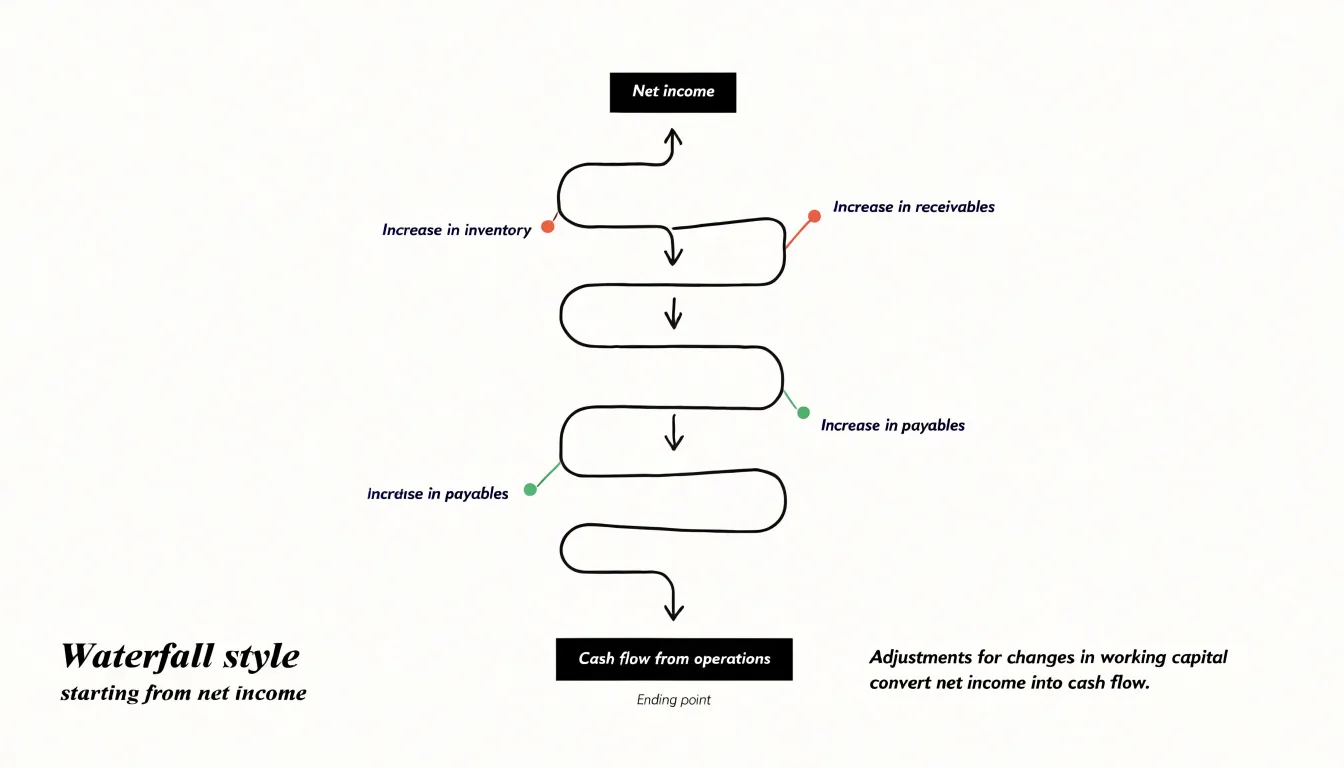
By analyzing the operating activities section, stakeholders can assess the company’s ability to generate cash from its core business. A positive cash flow from operations is generally a sign of financial health, indicating that the company can fund its ongoing operations without relying on external financing. Conversely, negative operating cash flow may signal liquidity issues or aggressive growth that consumes cash. Understanding how day-to-day transactions and working capital changes manifest in this section provides valuable insights into the company’s operational efficiency and cash management practices.
Adjusting net income for non cash expenses like depreciation
Depreciation and amortization are accounting allocations that spread the cost of long-lived assets over their useful lives. When a company purchases equipment, vehicles, or intangible assets like patents, the cash outflow occurs at the time of acquisition. However, accounting rules require that this cost be expensed gradually over the periods that benefit from the asset’s use. These expenses reduce reported net income on the income statement, but they do not involve any actual cash outlay in the period they are recorded. For this reason, when preparing the cash flow statement, depreciation and amortization are added back to net income to reconcile it to cash flow from operations. This adjustment ensures that the cash flow statement reflects the true cash-generating ability of the business, separate from non-cash accounting charges.
Beyond depreciation and amortization, several other non-cash items can distort the relationship between net income and cash flow. Stock-based compensation is a common example: companies often pay employees with equity rather than cash, and this expense reduces net income without affecting cash. Similarly, gains or losses on the sale of assets are non-cash items that must be removed from net income to avoid overstating or understating operating cash flow. Deferred taxes, which arise from timing differences between accounting and tax rules, also require adjustment. Impairment charges, such as write-downs of goodwill or inventory, are non-cash expenses that lower net income and should be added back. Provisions for doubtful accounts and other accruals that do not involve immediate cash movement are additional items to monitor. By carefully identifying and adjusting for all non-cash expenses, analysts and investors gain a clearer picture of a company’s cash-generating efficiency and its ability to fund operations, invest in growth, and return capital to shareholders.
Investing activities
Investing activities capture the cash movements tied to buying and selling long term assets, and this section of the cash flow statement records purchases and sales of property, plant, equipment, and financial investments as they actually affect the bank balance. When a company buys a building, machinery, or a stake in another business, the cash paid appears as an outflow in this section. When it sells a piece of equipment, disposes of a property, or liquidates an investment, the proceeds appear as an inflow. Depreciation does not belong here, since it is a non-cash charge that never moves money; only the actual cash exchanged on the transaction date is reported. The same logic applies to acquisitions of other companies, where the cash portion of the purchase price is shown as an outflow, and to the sale of a business unit, where the cash received is shown as an inflow. Lending money or collecting repayments on loans made to others also falls under investing activities, because these represent the deployment and recovery of long term resources rather than day to day trading.
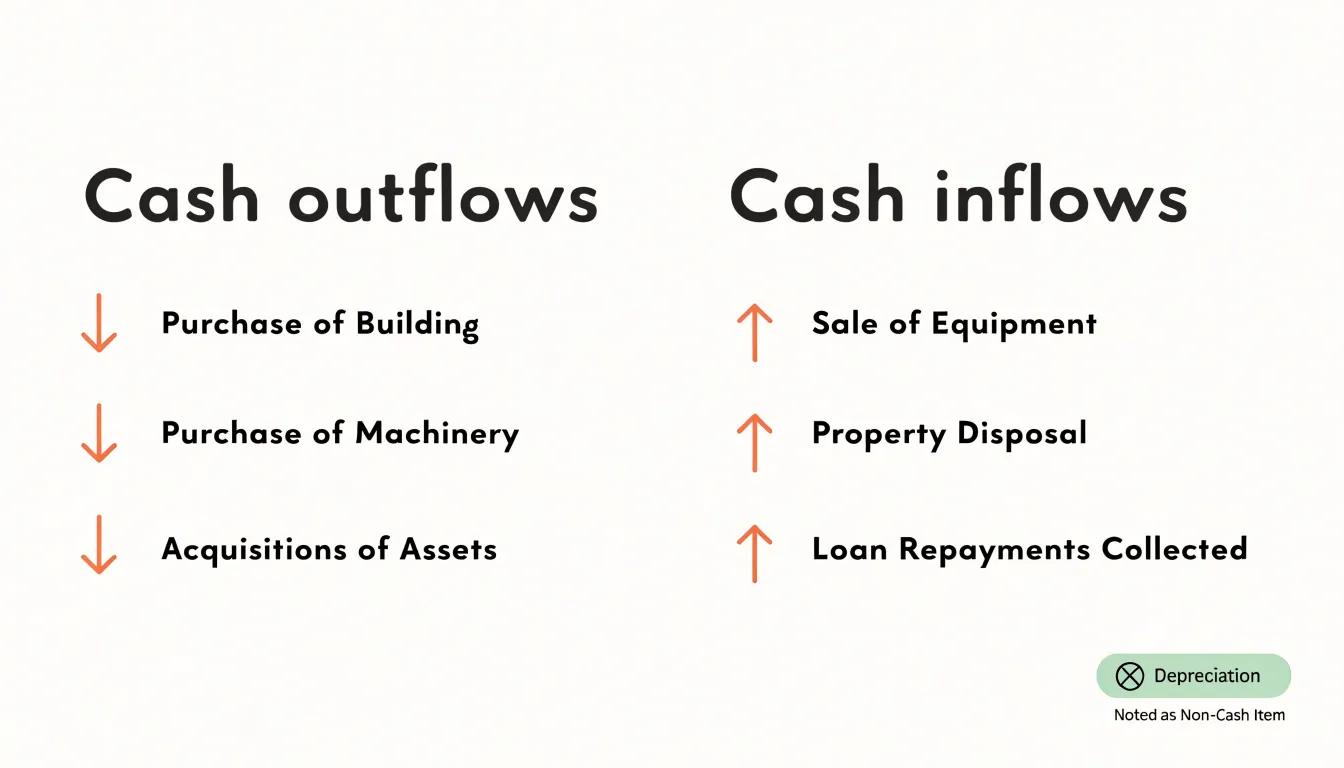
The pattern of investing cash flows offers a useful read on strategy. Heavy and sustained outflows for capital expenditure typically signal that management expects growth ahead and is committing money to expand capacity, upgrade facilities, or enter new markets. Investors often compare capital spending against depreciation to see whether a company is reinvesting enough to maintain or grow its asset base. A sudden spike in outflows can also reflect a large acquisition or a major infrastructure project, both of which carry execution risk alongside the growth potential. On the other side, persistent outflows that outstrip the cash generated by operations can indicate strain, forcing the company to fund the gap through debt or equity issuance. Recurring inflows from asset sales may point to divestment as a deliberate strategy to shed non-core operations, or they may hint at a business raising cash under pressure by selling off productive assets. Reading the investing section in context, alongside operating cash flow and financing activity, helps distinguish investment for expansion from asset liquidation driven by financial difficulty.
Financing activities for debt equity and owner payouts
Financing activities capture the cash flows that arise from how a business funds itself and returns value to its capital providers. On the inflow side, a company may raise cash by borrowing through bank loans, issuing bonds, or drawing on credit facilities. It may also issue shares of stock to investors, bringing in equity capital that does not carry a repayment obligation. These inflows appear in the financing section of the cash flow statement and represent the resources the business has assembled to support its operations and growth. On the outflow side, financing activities include repayments of loan principal, which reduce the debt burden but consume cash, and payments to owners in the form of dividends on shares. For smaller or privately held businesses, owner draws serve a similar function, reflecting cash taken out of the business by its proprietors.
The mix and timing of these financing choices shape a company’s financial flexibility, meaning its capacity to respond to opportunities and shocks without undue strain. A firm that relies heavily on debt takes on fixed obligations: principal repayments and interest must be met on schedule, which can squeeze cash during slow periods. Equity issuances avoid mandatory repayments, but they dilute existing ownership and may signal that the company prefers sharing upside over taking on fixed costs. Dividend payments and owner draws return cash to investors, which can build confidence and attract future capital, yet persistent large payouts can leave reserves thin when unexpected expenses arise.
Reading the financing section alongside the operating and investing sections gives a fuller picture. A company generating strong operating cash flow while steadily repaying debt and paying modest dividends typically enjoys room to maneuver. By contrast, one that repeatedly raises new debt to cover repayments or fund distributions may be masking underlying shortfalls. Analysts often watch the balance between new borrowings and principal repayments, since net borrowing trends reveal whether a company is strengthening or stretching its capital structure. Ultimately, the financing decisions recorded in this section determine how much cushion a business keeps and how confidently it can pursue its plans.
How the three sections connect directly to your balance sheet
The cash flow statement does not stand alone. Every figure in its three sections connects directly to the balance sheet, and the most visible link is the reconciliation of cash itself. The net change in cash shown at the bottom of the cash flow statement equals the difference between the cash balance on this period’s balance sheet and the cash balance on last period’s. If opening cash was 50,000 and closing cash is 68,000, the cash flow statement must explain the 18,000 increase through its operating, investing, and financing activities. When the statement is prepared correctly, this reconciliation balances to the dollar, which makes it a reliable internal check on the accuracy of both statements.
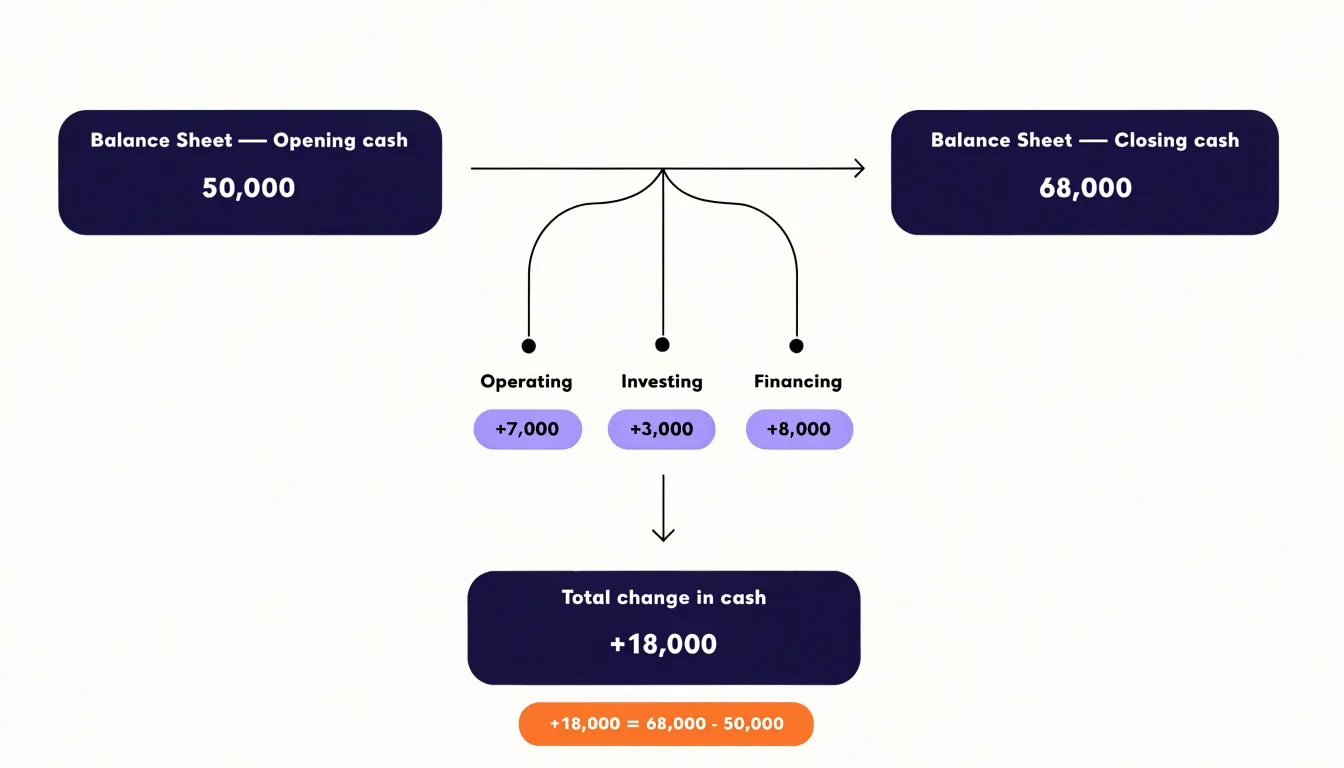
Beyond the cash line, each section of the cash flow statement maps onto movements in specific balance sheet accounts. Operating cash flow reflects the cash effects of the day-to-day items in working capital: receivables, inventory, payables, and accrued expenses. A rise in accounts receivable consumes cash, while a rise in accounts payable releases it, so the operating section effectively traces how changes in current assets and current liabilities translate into cash generated or used by the business.
Investing activities connect to long-term assets. Purchases of property, plant, and equipment increase the gross fixed asset balance, while proceeds from disposals reduce it, and acquisitions or sales of investments move the corresponding investment accounts. The investing section therefore explains the cash side of the changes you see in non-current assets on the balance sheet.
Financing activities tie to liabilities and equity. New borrowings raise debt balances, repayments lower them, share issuances increase equity, dividend payments reduce retained earnings, and treasury share purchases shrink equity. Reading the financing section alongside the balance sheet shows how the company funded itself and returned capital during the period.
Taken together, the three sections provide the transactional detail behind the balance sheet’s period-to-period changes. The balance sheet is a snapshot at a point in time; the cash flow statement explains the movement between two snapshots, showing which assets, liabilities, and equity accounts shifted and how those shifts affected liquidity.
Spotting red flags hidden inside a positive cash flow report
A positive cash flow report can be reassuring, yet it may conceal warning signs that warrant closer scrutiny. One common red flag is cash flow propped up by asset sales. When a company sells property, equipment, or other long-term assets, the proceeds appear as cash inflows from investing activities. While these inflows boost the overall cash balance, they are typically non-recurring and do not reflect the company’s ability to generate cash from its core operations. Investors should examine the composition of investing cash flows: frequent or large asset sales may indicate that the company is liquidating resources to sustain liquidity, which is unsustainable over the long term.
Another warning sign is stretching payables. Companies can temporarily improve operating cash flow by delaying payments to suppliers, which increases the cash balance in the short run. This tactic, often called stretching payables, can be detected by comparing the days payable outstanding (DPO) over time. A significant increase in DPO without a corresponding rise in sales or inventory turnover may suggest that the company is using supplier financing as a cash management tool. While some flexibility in payment terms is normal, consistently stretching payables can strain supplier relationships and may signal underlying liquidity issues.
One-time financing activities can also inflate cash flow. For example, a company might raise cash through debt issuance or equity offerings, which appears as a financing inflow. While this can provide a necessary boost during growth phases or distress, it is not a sustainable source of cash. Analysts should separate financing cash flows from operating cash flows and assess whether the company can generate sufficient cash from its operations to cover its obligations without relying on external financing.
To distinguish sustainable cash generation from temporary boosts, focus on operating cash flow and its relationship to net income. A healthy company typically generates operating cash flow that is consistently positive and grows in line with revenue and earnings. Comparing operating cash flow to net income can reveal discrepancies: if operating cash flow consistently exceeds net income due to non-cash items like depreciation, that may be acceptable, but if it lags or is volatile, it could indicate earnings quality issues. Additionally, examine the cash flow from operations to capital expenditures ratio (often called free cash flow) to see if the company can fund its investments and dividends from internally generated cash. By analyzing these components, stakeholders can better assess the durability of a company’s cash generation and spot potential red flags hidden within a positive cash flow report.
What healthy cash flow looks like across different business stages
Healthy cash flow looks different depending on where a business sits in its lifecycle. For startups, negative operating cash flow is often a normal and expected condition. Early-stage companies typically invest heavily in product development, customer acquisition, and building operational capacity before revenues scale enough to cover those costs. Investors and lenders who understand this dynamic focus on the burn rate, the runway, and the path to breakeven rather than on immediate positive cash generation. A startup with a clear plan for reaching positive operating cash flow within a defined timeframe, supported by adequate funding, can be considered financially healthy even while burning cash. The key benchmarks for startups include a burn rate that matches the funded plan, a runway of at least twelve to eighteen months, and a credible trajectory toward cash flow breakeven as the business matures.
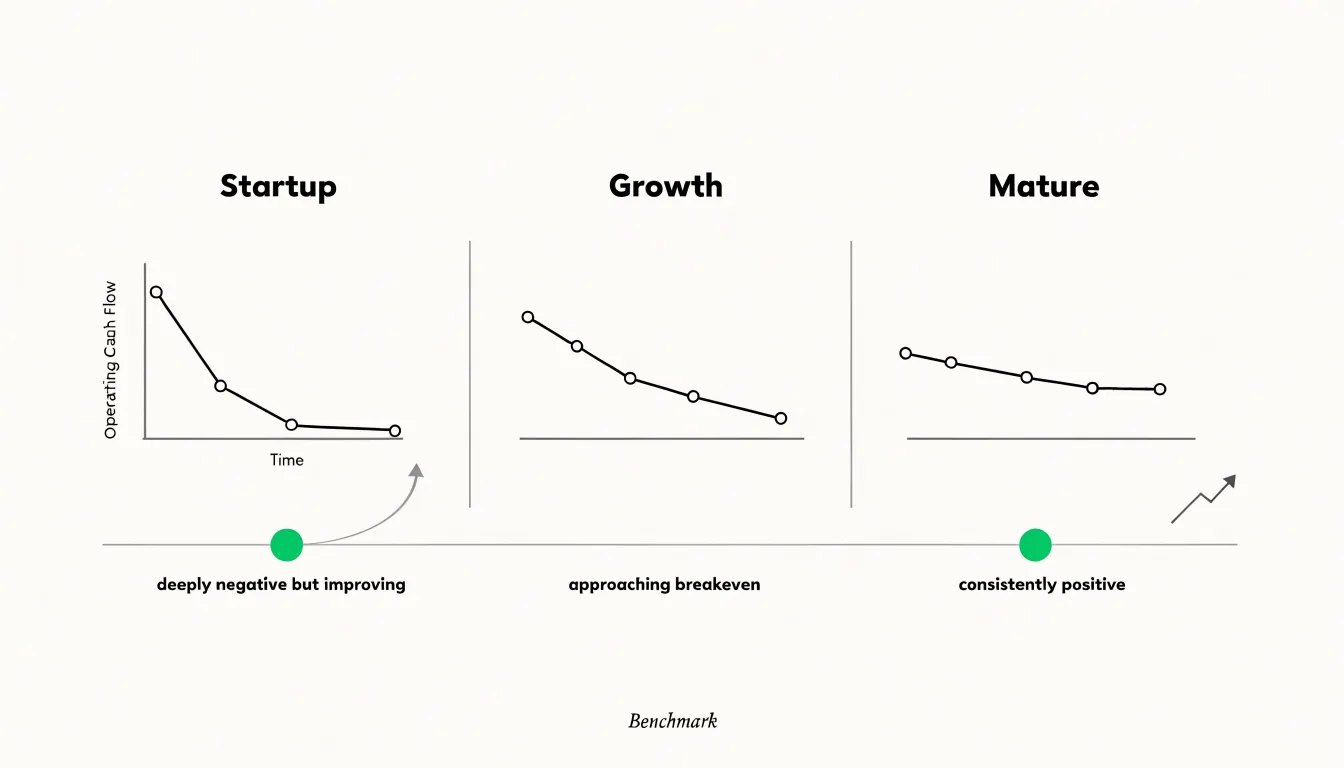
As a company moves into a growth phase, the cash flow picture becomes more nuanced. Growth companies often continue to consume cash as they invest in scaling operations, expanding into new markets, and hiring ahead of revenue. However, healthy growth-stage cash flow shows improving operating cash flow trends, with the gap between cash inflows and outflows narrowing over time. Investors look for operating cash flow that is either approaching breakeven or positive, supported by strong revenue growth and improving unit economics. A growth company that generates positive operating cash flow while still investing in expansion is in a strong position. Benchmarks here include a declining cash burn as a percentage of revenue, operating cash flow that turns positive within a predictable timeframe, and a balance between growth investment and cash generation that does not jeopardize liquidity.
For mature firms, the expectation shifts decisively toward consistent positive operating cash flow. Established businesses have typically completed their heaviest investment cycles and should be generating cash from core operations to fund maintenance capital expenditures, pay dividends, reduce debt, and return value to shareholders. Healthy mature cash flow is characterized by stable or growing operating cash flow, a strong cash conversion cycle, and sufficient free cash flow to cover obligations and strategic investments. Persistent negative operating cash flow in a mature company is a red flag, signaling underlying operational or competitive problems. Benchmarks for mature firms include operating cash flow that consistently exceeds net income, a healthy current ratio, and free cash flow margins that support long-term financial flexibility. Across all stages, the common thread is that healthy cash flow aligns with the company’s strategic phase and funding plan, providing the liquidity needed to operate and grow without undue financial stress.
Frequently Asked Questions
Why can a profitable business still run out of cash?
A profitable business can run out of cash because accrual accounting records revenue when earned and expenses when incurred, even if cash has not yet changed hands. Timing mismatches in working capital accounts such as receivables, payables, and inventory can leave a company without enough cash for payroll, rent, and supplier obligations, and rapid growth can intensify the problem.
What does the operating activities section of a cash flow statement show?
The operating activities section focuses on the cash effects of day-to-day business transactions that generate revenues and expenses. It captures cash received from customers, cash paid to suppliers and employees, and adjustments for working capital changes such as receivables, inventory, and accounts payable.
Why is depreciation added back to net income on the cash flow statement?
Depreciation and amortization reduce reported net income but do not involve an actual cash outlay in the period they are recorded. They are added back to net income to reconcile it to cash flow from operations and reflect the business’s true cash-generating ability separate from non-cash accounting charges.
What are investing activities in a cash flow statement?
Investing activities record cash movements tied to buying and selling long-term assets, such as property, plant, equipment, and financial investments. They also include acquisitions, sales of business units, and lending money or collecting repayments on loans made to others; depreciation does not belong here because it is non-cash.
What counts as financing activities on a cash flow statement?
Financing activities capture cash flows from how a business funds itself and returns value to capital providers. Inflows include borrowing through loans, bonds, or credit facilities and issuing shares, while outflows include repayments of loan principal, dividends, and owner draws.
How can a positive cash flow report hide red flags?
A positive cash flow report can hide warning signs such as cash flow propped up by non-recurring asset sales, stretching payables by delaying supplier payments, or one-time financing inflows. To assess whether cash generation is sustainable, the article says to focus on operating cash flow and its relationship to net income, and to examine free cash flow.