
Chart of Accounts
A chart of accounts is the master list of every category a business uses to record money coming in and going out, grouped into five types: assets, liabilities, equity, revenue, and expenses. Each account gets a name, a number, and a defined purpose, and every transaction is assigned to one account.
Table of Contents
- What is a chart of accounts and why your business needs one
- The core financial categories that form your account structure
- How does the standard account numbering system work
- Step by step process to build your custom chart of accounts
- Free template
- Common chart of accounts mistakes small business owners make
- How to scale your chart of accounts as your business grows
- Integrating your new account structure with bookkeeping software
What is a chart of accounts and why your business needs one
A chart of accounts is the master list of every category your business uses to record money coming in and money going out. Think of it as a filing system for your finances: each account gets a name, a number, and a defined purpose, and every transaction you make is assigned to one of those accounts. The list is typically grouped into five broad areas—assets, liabilities, equity, revenue, and expenses—and each area breaks down into more specific accounts such as Cash, Accounts Receivable, Rent Expense, or Sales Revenue. Once this structure is in place, bookkeeping stops being a pile of receipts and becomes an organized record where every dollar has a home.

The organizing power of a chart of accounts comes from consistency. When every sale is coded to the same revenue account and every utility bill lands in the same expense account, transactions stop being isolated events and start forming patterns. You can look at a single category and see its full history at a glance, compare one month to the next, or trace exactly where a sum of money went. Without that shared structure, similar transactions get recorded in different places, and the resulting records become difficult to interpret or trust.
The benefits show up in three practical areas. For reporting, a well-built chart of accounts lets you generate an income statement, balance sheet, and cash flow statement that actually reflect how the business is performing. Because transactions are already sorted into meaningful categories, reports assemble themselves from the underlying data rather than requiring hours of manual reconstruction. For tax preparation, the chart gives you clean, categorized totals for deductions, income, and payroll, which speeds up filing and reduces the risk of missed or double-counted items if you are ever examined. For decision-making, the chart turns your bookkeeping into a management tool: you can see which product lines are profitable, where expenses are creeping up, and how much you are spending on marketing versus operations. Those insights let you make choices based on evidence instead of guesswork. Setting up a chart of accounts takes a modest amount of time at the start, and it pays that time back every month thereafter.
The core financial categories that form your account structure
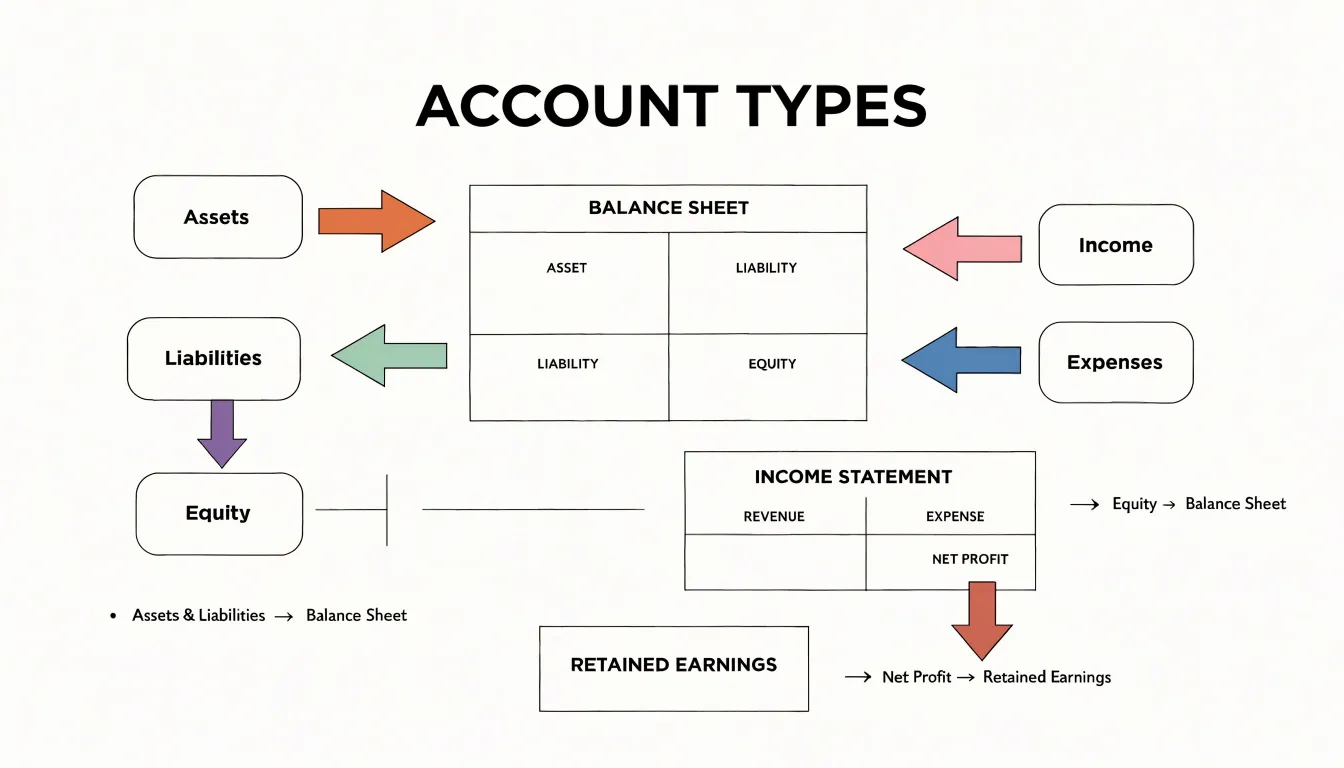
Every chart of accounts rests on five fundamental account types, and understanding each one is the first step toward building a structure that produces meaningful financial statements. These five categories—assets, liabilities, equity, income, and expenses—form the backbone of double-entry bookkeeping and determine where every transaction in your business ultimately lands.
Assets represent what your business owns or has a right to receive. Common examples include cash in the bank, accounts receivable from customers, inventory held for sale, equipment, vehicles, and prepaid expenses such as insurance paid in advance. Assets are typically divided into current assets, which convert to cash within a year, and fixed or non-current assets, which provide long-term value.
Liabilities are the obligations your business owes to others. This category includes accounts payable to suppliers, accrued wages, sales tax collected but not yet remitted, short-term loans, and long-term debt such as mortgages or equipment financing. Like assets, liabilities are usually split between current and long-term portions to give readers a clear picture of what is due soon versus what extends further out.
Equity, sometimes called owner’s equity or shareholders’ equity, represents the residual interest in the business after liabilities are subtracted from assets. It includes capital contributions from owners, retained earnings accumulated over time, and draws or distributions taken out of the business. Equity is the balancing figure that ties the balance sheet together.
Income accounts capture the money your business earns from its primary operations and other sources. Examples include product sales, service revenue, consulting fees, interest earned, and gains on the sale of assets. Income accounts are sometimes broken into operating revenue and other income to distinguish core business activity from incidental earnings.
Expense accounts record the costs incurred to generate revenue and run the business. Typical examples include cost of goods sold, rent, utilities, payroll, advertising, professional fees, depreciation, and interest expense. Expenses are often grouped by function—such as cost of sales, operating expenses, and non-operating expenses—to support meaningful profitability analysis.
These five categories map directly onto your three core financial statements. Assets, liabilities, and equity populate the balance sheet, with assets always equaling liabilities plus equity. Income and expense accounts flow into the income statement, where expenses are subtracted from income to arrive at net profit or loss. That net result then feeds into the equity section of the balance sheet as retained earnings, linking the two statements together. Structuring your chart of accounts around these five types ensures every transaction has a proper home and every report tells a coherent story.
How does the standard account numbering system work
The standard account numbering system rests on a simple but powerful idea: give every account in the chart of accounts a number whose leading digit identifies the account type. Under the most common convention, accounts numbered in the 1000s are assets, the 2000s are liabilities, the 3000s are equity, the 4000s are revenue, the 5000s are cost of goods sold or direct costs, and the 6000s through 9000s cover operating expenses and other accounts. Within each block, the second and third digits typically group accounts into subcategories. Cash might sit at 1010, accounts receivable at 1200, and inventory at 1300, while revenue accounts branch from 4010 for product sales to 4020 for services. Balance sheet accounts usually ascend in order of liquidity, so current assets come before fixed assets, and current liabilities before long-term debt. Because the first digit signals the account type at a glance, anyone reading a transaction, a journal entry, or a report can immediately tell what kind of account is involved without looking up a name.
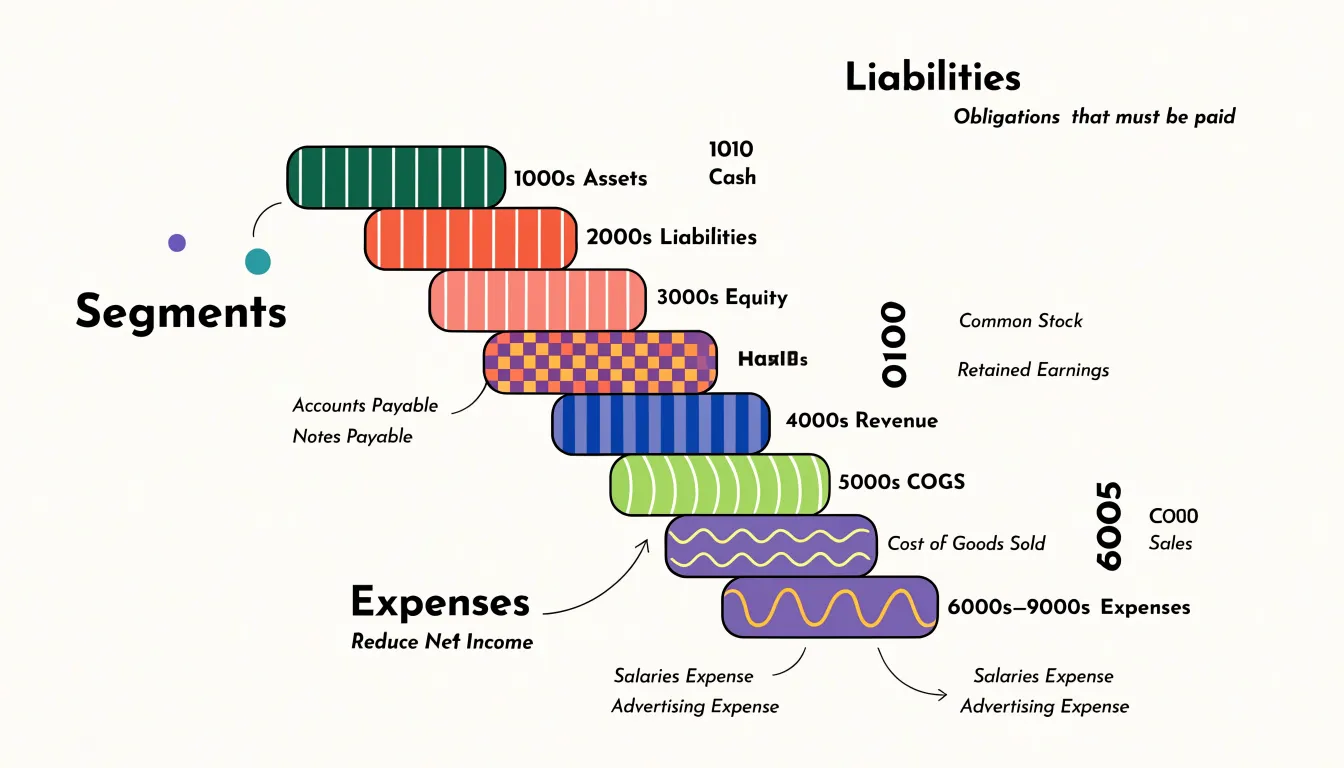
Consistent numbering matters because the number, not just the label, becomes the common language between the ledger, the financial statements, and the people who use them. When every asset lives in the 1000s, sorting a trial balance by account number automatically produces a balance sheet ordered the way readers expect. Software mappings, report templates, and audit sampling routines can rely on number ranges to pull the right accounts, which reduces manual reclassification and the errors that come with it. Consistency across periods also preserves comparability, since a renumbered account can silently break trend analysis and prior-year comparisons.
Leaving gaps is one of the simplest habits that protects that consistency. Rather than numbering accounts sequentially (1010, 1020, 1030), reserve blocks of ten or twenty numbers within each category so a new bank account, a new revenue stream, or a new expense line can be slotted in beside its logical neighbors instead of appended at the end of the range. Appending at the end forces the new account out of its natural group and often triggers a cascade of renumbering later. A brief written numbering policy, reviewed whenever the chart is updated, keeps the logic visible and ensures future accounts find a home without disrupting the structure.
Step by step process to build your custom chart of accounts
Building a custom chart of accounts begins with a clear-eyed inventory of what your business actually does. Before touching account numbers, spend time listing your primary activities: the goods or services you sell, the expenses you incur to deliver them, the assets you rely on, and the debts you carry. Walk through a typical month and note every transaction type you encounter, from payroll and rent to inventory purchases and client deposits. This activity list becomes the raw material for your account structure, ensuring that every real-world event has a logical place to land. Involving the people who handle day-to-day bookkeeping during this step often surfaces transactions that owners overlook.
With your activities documented, move to choosing account categories. Most small businesses organize around the five standard types: assets, liabilities, equity, revenue, and expenses. Decide which subcategories you genuinely need within each type. A service business may need only a handful of revenue accounts, while a retailer might separate sales by product line. Resist the urge to mirror an overly detailed template; each account should exist because you will actually post entries to it or report on it. Group related items together so the structure reads logically when someone reviews your financial statements.
Numbering comes next. The conventional approach assigns blocks of numbers to each category, beginning with 1000s for assets, 2000s for liabilities, 3000s for equity, 4000s for revenue, and 5000s for expenses. Leave gaps between numbers within each block so you can add accounts later without renumbering everything that follows. Consistency matters more than any specific scheme; the goal is a sequence that lets you and your accountant locate accounts quickly and sort them in a sensible order.
Naming accounts clearly is where many charts of accounts succeed or fail. Use plain, descriptive labels that anyone reviewing the books would understand. Avoid cryptic abbreviations, vague terms like miscellaneous, or names that overlap with another account. A well-named account explains itself at a glance. Once your list is complete, review it with your accountant before entering it into your accounting software. A professional review catches gaps, flags accounts that may create tax or reporting complications, and confirms that the structure aligns with how your financial statements will ultimately be prepared and interpreted.
Free template
A ready-to-use chart of accounts template gives small business owners a practical starting point without requiring them to build a numbering system from scratch. The template typically organizes accounts into the five standard categories: assets, liabilities, equity, revenue, and expenses. Within each category, common accounts are listed with suggested account numbers that follow a logical sequence, leaving gaps between ranges so new accounts can be inserted later without renumbering everything. For example, current assets might occupy the 1000–1999 range, with cash, accounts receivable, inventory, and prepaid expenses each assigned a block of numbers within that span.
The template includes accounts that most small businesses encounter in day-to-day operations: a checking account, a savings account, accounts receivable, inventory, fixed assets such as vehicles and equipment, accounts payable, credit card balances, owner’s equity, sales revenue, and routine expense categories like rent, utilities, payroll, supplies, insurance, and professional fees. Having these standard lines already in place means bookkeeping can begin immediately, and reports generated from the chart will follow familiar formats that accountants and lenders recognize.
Customization is where the template earns its value. A service business may have little need for inventory accounts but will want detailed subcategories for billable labor and subcontractor costs. A retail operation will expand the inventory section to track categories of goods and may add accounts for freight and shrinkage. A restaurant might add separate lines for food cost, beverage cost, and smallwares. Contractors often need job-costing accounts or cost-of-goods-sold groupings that tie directly to project estimates. The template should be treated as a framework to adapt, with accounts added, renamed, or removed to match how the business actually earns and spends money.
A few practical guidelines help with customization. Keep account names clear and consistent so anyone reviewing the books understands them. Avoid creating an excessive number of accounts early on; it is easier to add detail later than to consolidate a bloated chart. Reserve ranges within each category for future growth, and document any changes so the reasoning behind each account remains visible. Reviewing the chart annually alongside tax preparation or budgeting keeps it aligned with the business as it evolves.
Common chart of accounts mistakes small business owners make
Small business owners often build their chart of accounts quickly, usually at the urging of an accountant or while setting up accounting software for the first time, and that haste leaves room for recurring mistakes. One of the most common is an account list that is either far too long or far too short. Owners who copy a template designed for a much larger company end up with dozens of accounts that never see activity, which makes reports cluttered and hard to read. At the other extreme, an owner who keeps everything under a handful of catch-all categories loses the detail needed to see where money actually goes. When every supply purchase, from printer paper to raw materials, lands in one line, the income statement stops telling a useful story.
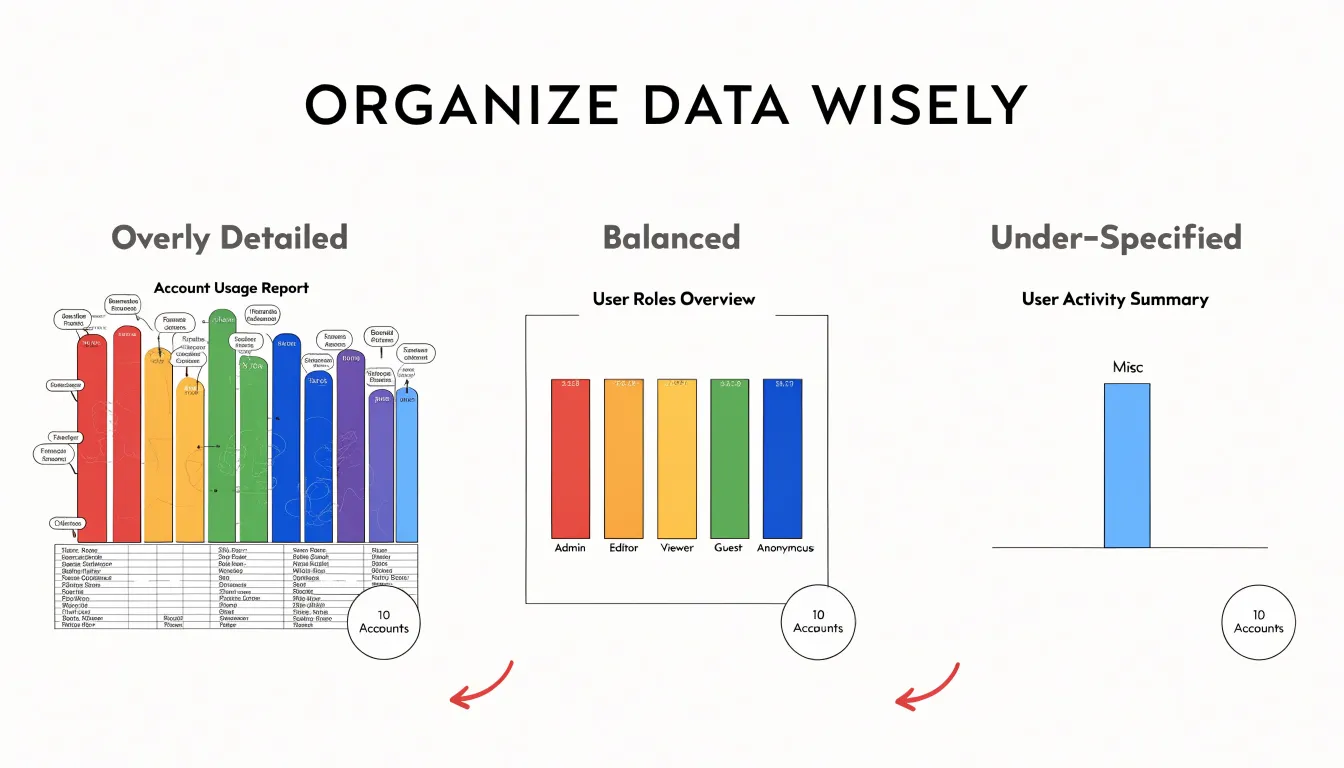
Inconsistent naming is another frequent pitfall. Accounts named “Misc,” “Other,” or “Supplies 2” create confusion for anyone reviewing the books, including the owner a year later. A chart works best when names are specific, consistent in format, and matched to numbered account ranges so that similar items group together logically. Software makes it easy to add accounts on the fly, and without a naming convention the list drifts into chaos over time.
Mixing personal and business expenses is perhaps the most damaging mistake. When an owner pays a personal bill from the business account and records it as a business expense, the books misstate profit, complicate tax filing, and blur the line between the entity and its owner. The remedy is a dedicated owner’s draw or distribution account and discipline about keeping personal spending out of business records entirely.
Finally, many owners never revisit the chart after the initial setup. A business that adds a product line, opens a second location, or shifts from services to goods needs accounts that reflect those changes. An outdated chart forces new activity into old categories that no longer fit. Reviewing the chart once or twice a year, and adjusting it as the business evolves, keeps financial reports accurate and meaningful.
How to scale your chart of accounts as your business grows
As a business grows, its chart of accounts needs to grow with it. A structure that worked well for a single founder selling one product line quickly becomes a bottleneck once you add staff, locations, or new revenue streams. The goal is to anticipate that growth and adjust the chart in deliberate steps, rather than waiting until your bookkeeping has become tangled and hard to interpret.
The most common scaling move is adding sub-accounts. When a single line item like Advertising or Travel starts carrying enough transactions that you can no longer tell what is driving the balance, it is time to break it into sub-accounts. For example, Advertising could split into Digital, Print, and Events. Sub-accounts keep the parent category intact for high-level reporting while giving you detail underneath. A useful rule of thumb is to add a sub-account when you find yourself repeatedly asking which part of a category a transaction belongs to, or when a reviewer needs that breakdown to make decisions.
Multiple locations and product lines call for a similar approach. Many businesses handle this with a combination of segment codes and sub-accounts, so that each location or product line can be reported on independently while still rolling up to company totals. Department or class tracking in your accounting software often complements the chart of accounts here, letting you slice the same account by location without duplicating every line. Decide early whether location belongs in the account name or in a separate tracking field, because changing that convention later is disruptive.
Disruption is the main risk when restructuring. Historical reporting depends on consistency, so any change to account names, numbers, or hierarchy should preserve the past. The safest approach is to add new accounts for new activity rather than renumbering existing ones, and to retire old accounts instead of deleting them. Map each old account to its new home so prior-period reports remain comparable. Document the change, note the effective date, and review the updated structure with your bookkeeper or accountant before applying it, so that the chart keeps telling a clear story across every stage of your growth.
Integrating your new account structure with bookkeeping software
Once your chart of accounts has been designed on paper, the next step is getting it into your bookkeeping software so that every transaction flows into the right category automatically. Most popular platforms, including QuickBooks and Xero, let you import a chart of accounts from a spreadsheet rather than typing each line by hand. Both systems publish a template with specific columns, typically account number, account name, account type, and a description field. Matching your design to those column headings before importing saves a great deal of cleanup later, because a mismatched account type can cause the software to place an account in the wrong section of the financial statements. Accounting software also uses its own terminology for account types, so a line you think of as a cost of sale may need to be tagged with the platform’s equivalent label. After the import, review the list inside the software and confirm that the account numbering and hierarchy appear as intended.
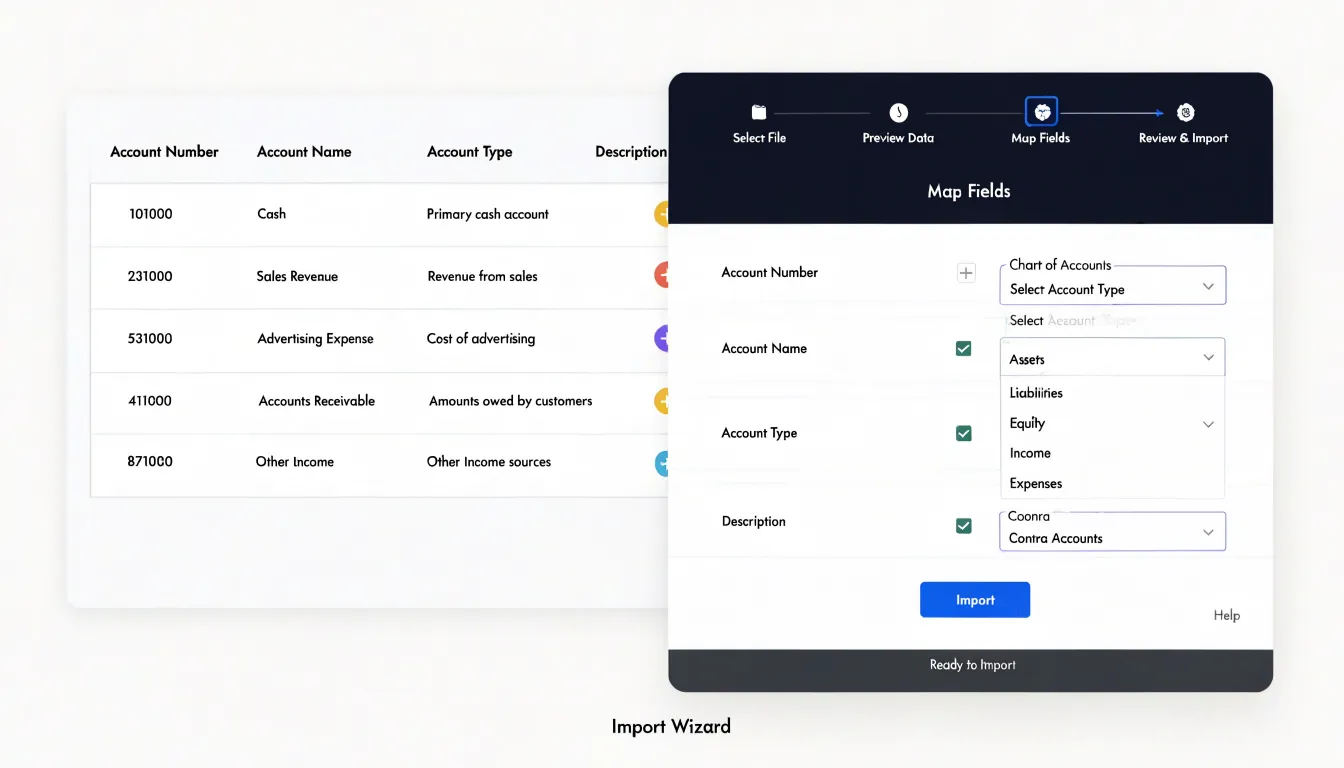
Existing transactions require separate attention. If you are migrating from another system or from a spreadsheet, you will need to map each old account to its counterpart in the new structure. Export a list of your historical accounts along with their balances, then build a mapping table that pairs each old account with the new one it rolls into. Imported historical transactions can then be re-coded in bulk using the software’s batch editing tools, which is far faster than adjusting entries one at a time. Where two old accounts now combine into a single new account, note the change so that anyone reviewing prior periods understands why the totals look different.
Maintaining consistency going forward depends on a few simple habits. Restrict the ability to create new accounts to one or two people, and require that any addition follow the existing numbering scheme. Review the account list at the end of each quarter to catch duplicates or accounts that have fallen out of use, and archive rather than delete them so historical reports remain intact. Documenting these conventions in a short internal guide gives new team members a clear reference and keeps your reporting stable as the business grows.
Frequently Asked Questions
What is a chart of accounts?
A chart of accounts is the master list of every category your business uses to record money coming in and money going out. Each account gets a name, a number, and a defined purpose, and every transaction is assigned to one of those accounts.
What are the five main account types in a chart of accounts?
The five fundamental account types are assets, liabilities, equity, income, and expenses. These categories form the backbone of double-entry bookkeeping and determine where every transaction ultimately lands.
How does the standard account numbering system work?
Under the most common convention, the leading digit identifies the account type: 1000s are assets, 2000s are liabilities, 3000s are equity, 4000s are revenue, 5000s are cost of goods sold or direct costs, and 6000s through 9000s cover operating expenses and other accounts. Leaving gaps between numbers within each block helps you add accounts later without renumbering everything.
How do I build a custom chart of accounts?
Start with a clear inventory of what your business actually does, including the goods or services you sell, expenses you incur, assets you rely on, and debts you carry. Then choose account categories, number them conventionally, name accounts clearly, and review the list with your accountant before entering it into accounting software.
What common mistakes should small business owners avoid with a chart of accounts?
Common mistakes include an account list that is far too long or too short, inconsistent naming, mixing personal and business expenses, and never revisiting the chart after initial setup. A dedicated owner’s draw or distribution account and regular review help keep the chart accurate and meaningful.
How do I integrate a chart of accounts with bookkeeping software?
Most popular platforms, including QuickBooks and Xero, let you import a chart of accounts from a spreadsheet using columns such as account number, account name, account type, and description. After importing, review the list inside the software, map existing historical accounts to their new counterparts, and restrict new account creation so additions follow the existing numbering scheme.