
Contribution Margin
Contribution margin is revenue minus variable costs—the money each sale leaves to cover fixed costs and profit. Calculated per unit as selling price minus variable cost per unit, or as a ratio of contribution to revenue, it shows how much each sale contributes. Divide fixed costs by contribution margin to find the break-even point.
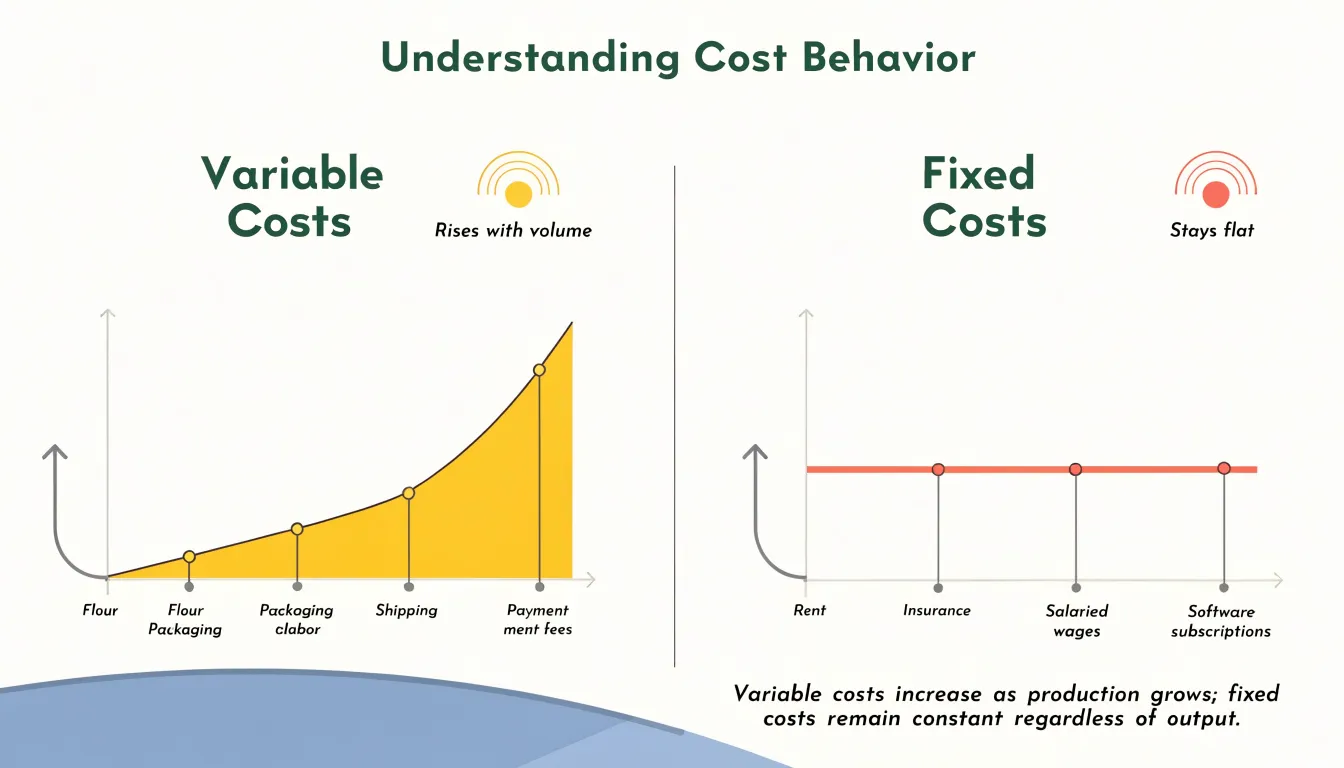
Table of Contents
- What is contribution margin and why does it matter for profit
- The basic contribution margin formula and how to calculate it per unit
- Total contribution margin
- Identifying variable costs versus fixed costs in your business
- Contribution margin ratio
- Step by step example of calculating contribution margin for a retail product
- How does contribution margin differ from gross profit margin
- How to use contribution margin to calculate your break even point
- Setting smarter prices based on your margin data
- When should you stop selling a product based on low contribution margin
What is contribution margin and why does it matter for profit
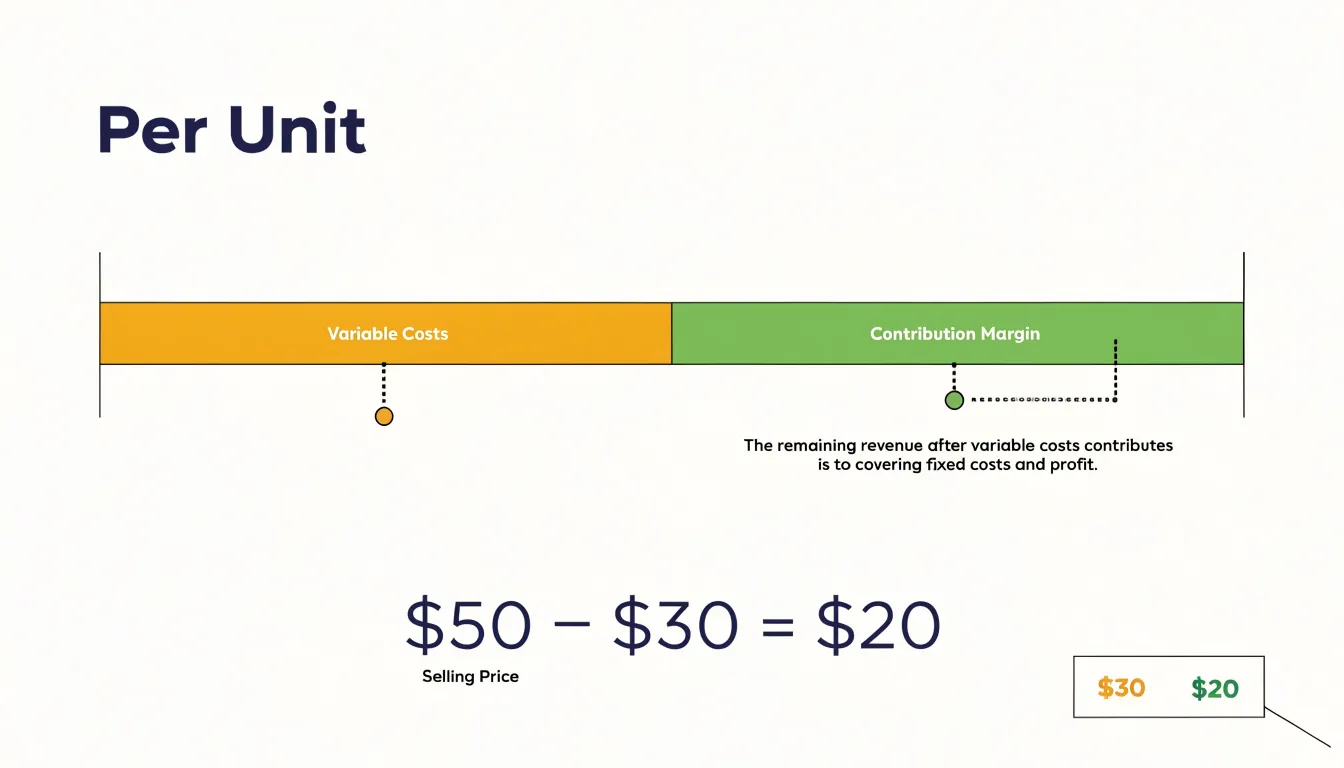
Contribution margin is the amount of money a business retains from sales after subtracting the variable costs directly tied to producing and selling its goods or services. It is calculated as revenue minus variable costs. Variable costs include expenses that rise and fall with sales volume, such as raw materials, packaging, direct labor, sales commissions, and shipping fees. When a company sells a product for $50 and incurs $30 in variable costs to deliver it, the contribution margin is $20 per unit. That $20 represents the money available to put toward the business’s fixed costs and, once those are covered, toward profit.
Contribution margin matters because fixed costs, such as rent, insurance, salaries for administrative staff, and equipment depreciation, must be paid regardless of how many units are sold. Each sale contributes its margin toward covering these obligations. A business can track how many units it needs to sell before total contribution margin equals total fixed costs, which is the break-even point. Every sale beyond that threshold adds directly to operating profit at the rate of the contribution margin. Understanding this relationship gives managers a clear view of how sales volume translates into profitability and how sensitive profit is to changes in price or variable cost.
Contribution margin also serves as a tool for assessing product-level profitability. Two products can generate identical revenue yet differ dramatically in how much they contribute once their variable costs are accounted for. A high-volume item with a thin margin may consume considerable resources while adding little toward fixed costs. A lower-volume item with a strong margin may be far more valuable. Comparing contribution margins across products, product lines, or customer segments helps managers decide where to focus sales efforts, how to allocate production capacity, and which offerings may need price adjustments or cost reductions.
This metric supports pricing decisions as well. When a manager knows the contribution margin per unit, they can evaluate whether a discount still leaves enough margin to be worthwhile or whether a price increase would meaningfully improve profitability. It also informs decisions about accepting special orders, since any price above variable cost contributes something toward fixed costs and profit. By separating variable from fixed costs, contribution margin gives a business a practical way to see how individual sales and products build toward overall financial health.
The basic contribution margin formula and how to calculate it per unit
The contribution margin formula begins with a single, straightforward relationship: contribution margin per unit equals the selling price per unit minus the variable cost per unit. That subtraction captures the amount of money each sale contributes toward covering a company’s fixed costs and, once those costs are covered, toward generating profit. Variable costs are the expenses that rise and fall directly with the number of units produced or sold — raw materials, direct labor, packaging, sales commissions, and shipping fees among them. Fixed costs, by contrast, stay constant regardless of volume, so they are deliberately excluded from the per-unit formula and handled afterward at the level of the total business.
A simple example makes the concept concrete. Suppose a company manufactures ceramic mugs and sells each one for $20. The variable costs tied to a single mug include $4 for clay and glaze, $3 for direct labor, $2 for packaging, and $1 for shipping, for a total variable cost per unit of $10. Applying the formula, $20 minus $10 gives a contribution margin of $10 per mug. This figure means that every mug sold leaves $10 available to pay the rent on the workshop, the salaries of administrative staff, insurance, and other fixed obligations. If the business’s total fixed costs amount to $5,000 per month, it must sell 500 mugs just to break even, since 500 multiplied by $10 equals $5,000. Every mug sold beyond that point adds $10 directly to operating profit.
The per-unit figure is useful because it stays stable across a wide range of sales volumes, which makes it easy to apply in planning. A manager can quickly test scenarios: selling 800 mugs yields $8,000 in total contribution, enough to cover fixed costs and leave $3,000 in profit. The same calculation can be expressed as a ratio, dividing contribution margin by price — in this case, 50 percent — which shows the proportion of each sales dollar that remains after variable costs. Whether the company works in dollars per unit or as a percentage, the underlying arithmetic is the same, and the resulting number gives a clear, immediately usable measure of how much each sale adds to the bottom line.
Total contribution margin
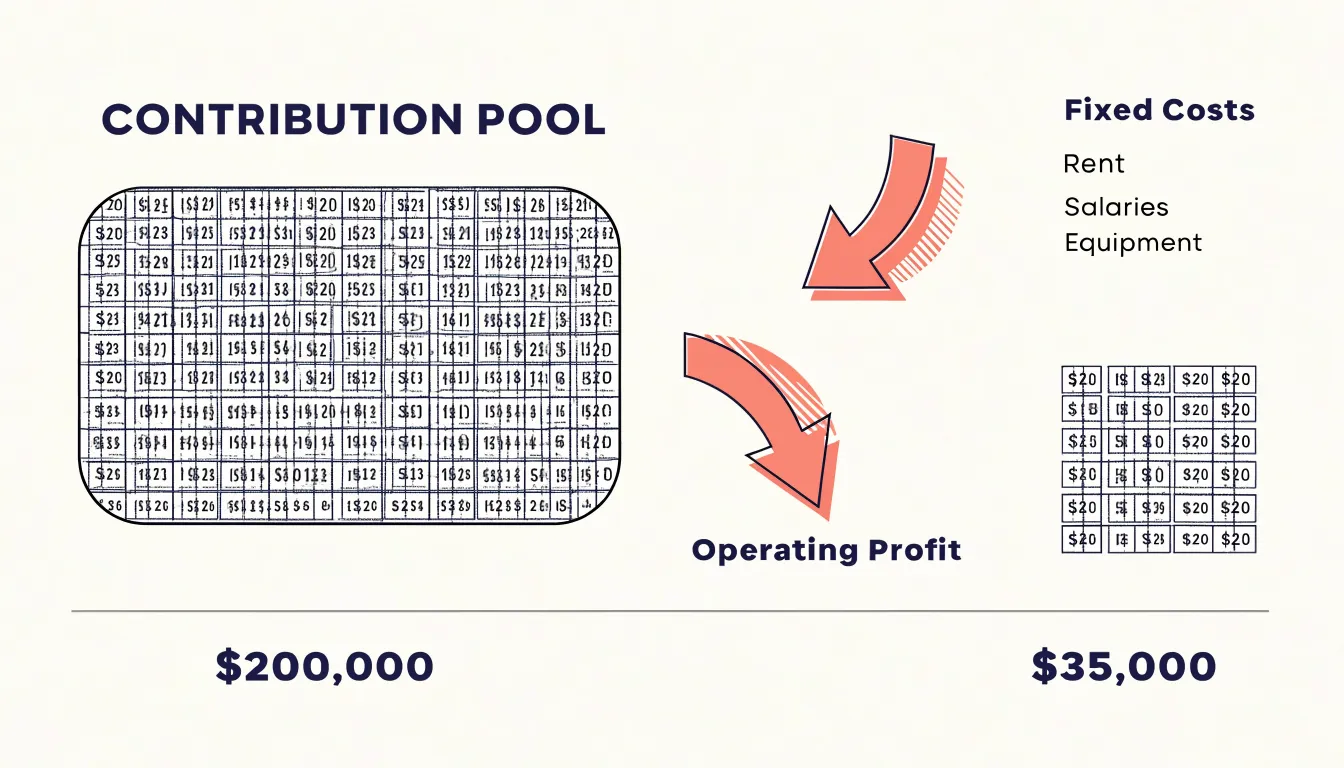
Total contribution margin takes the per-unit figure and scales it up to the level of the entire business, giving managers a view of how much money all sales together contribute toward fixed costs and profit. The calculation is straightforward: take the contribution margin for a single unit, which is the selling price minus variable costs, and multiply it by the number of units sold. If a product sells for $50, carries $30 in variable costs per unit, and the company sells 10,000 units in a period, the per-unit contribution margin is $20, and the total contribution margin is $200,000. That $200,000 is the pool of money available to cover rent, salaries, equipment, and other fixed expenses, with whatever remains becoming operating profit.
This aggregate figure matters because per-unit margins alone can mislead. A product with a thin per-unit margin may generate a substantial total contribution if volume is high, while a product with a rich per-unit margin may contribute little overall if it sells in small numbers. Computing total contribution margin across every product line lets a business see which offerings actually drive the dollars that keep the lights on. It also supports break-even analysis: dividing total fixed costs by the per-unit contribution margin shows how many units must be sold to break even, and comparing that threshold to actual volume reveals the margin of safety.
Total contribution margin also exposes the profit impact of changes in sales volume, price, or variable cost structure. Because the total scales directly with quantity, a ten percent increase in units sold raises total contribution by ten percent, assuming price and variable costs hold steady. Management can use this relationship to model scenarios, evaluate promotional campaigns, and decide where to concentrate sales effort. When reviewed alongside the contribution margin ratio, which expresses contribution as a percentage of revenue, the total figure gives a complete picture of how efficiently sales convert into funds for covering fixed obligations and generating profit. Tracking it over successive periods highlights trends in overall profitability and helps leaders spot when rising variable costs or price erosion are quietly shrinking the contribution the business depends on.
Identifying variable costs versus fixed costs in your business
Separating variable costs from fixed costs is one of the foundational exercises in understanding your business’s economics. Variable costs are those expenses that rise and fall directly with your level of production or sales volume. When you sell more units, these costs increase; when sales slow down, they shrink accordingly. Common examples for a small business include raw materials, packaging supplies, hourly labor tied directly to output, payment processing fees, shipping charges, and sales commissions. A bakery, for instance, spends more on flour, butter, and eggs during a busy holiday week and less during a quiet one. An online retailer pays more in shipping labels and merchant fees as order volume climbs. The defining trait is proportionality: each additional sale carries its own increment of cost.
Fixed costs, by contrast, stay largely the same regardless of how much you produce or sell in a given period. Rent, insurance premiums, salaried manager wages, software subscriptions, equipment leases, and loan payments typically fall into this category. A bakery pays the same monthly rent whether it bakes fifty loaves or five hundred. A retailer’s website hosting fee and bookkeeping subscription remain steady through slow months and busy ones. These costs provide the capacity to operate, and they must be covered whether or not a single sale occurs.
Practical classification requires judgment, because some costs straddle the line. A utility bill has a fixed base charge plus a usage component that rises with production, so it may be worth splitting into two lines. Employees who work a set schedule regardless of volume behave like fixed costs, while those called in only for rush orders are variable. To sort your own expenses, ask a simple question about each one: if my sales doubled next month, would this cost increase? If the answer is yes, and roughly in proportion, treat it as variable. If it would stay flat, treat it as fixed. Some owners find it helpful to review a year of bank and credit card statements line by line, tagging each transaction. This exercise not only cleanly separates the two categories but also reveals costs that could be renegotiated or restructured, giving you a clearer picture of how profit responds as your sales volume changes.
Contribution margin ratio
The contribution margin ratio expresses contribution margin as a percentage of sales revenue, giving managers a scale-free way to compare profitability across products, divisions, or time periods. The formula is straightforward: divide the contribution margin by total revenue, where contribution margin itself equals revenue minus all variable costs. If a company generates $200,000 in revenue and incurs $120,000 in variable costs, its contribution margin is $80,000, and the ratio is $80,000 divided by $200,000, or 0.40—expressed as 40 percent. Because the numerator and denominator are measured in the same units, the result tells you how many cents of each sales dollar remain after variable costs to cover fixed costs and build profit.
Interpreting the ratio begins with that per-dollar meaning. A 40 percent contribution margin ratio means 40 cents of every revenue dollar contribute toward fixed expenses and, once those are covered, toward operating income. The remaining 60 cents go toward variable costs such as materials, direct labor, commissions, and shipping. Managers can use this figure to set sales targets: if fixed costs are $80,000 and the ratio is 40 percent, the break-even revenue level is $200,000, since each dollar of sales contributes 40 cents toward those fixed costs. The same ratio also supports quick what-if analysis, showing how a given change in revenue translates into a change in profit.
A higher ratio indicates that a larger share of each sales dollar is available to absorb fixed costs and generate profit, which generally means greater resilience to sales declines and stronger operating leverage when sales rise. A lower ratio leaves less cushion per dollar and typically requires higher sales volume to reach break-even. The ratio is most useful when tracked over time and compared across product lines, since differences often reveal which offerings carry the strongest underlying economics. It complements, rather than replaces, dollar-based contribution margin figures, because a high percentage on a low-revenue product may contribute less in absolute terms than a moderate percentage on a high-volume one. Reading the percentage alongside the dollar amounts gives the fullest picture of where profit is generated.
Step by step example of calculating contribution margin for a retail product
To illustrate contribution margin in a retail context, consider a small boutique that sells a particular style of leather handbag. The first step is to identify all variable costs associated with selling one handbag. These are costs that change directly with the number of units sold. For this handbag, the boutique purchases each unit from a supplier for $40. Additionally, each sale incurs a $2 credit card processing fee and $3 for packaging and shipping materials. The total variable cost per handbag is therefore $40 + $2 + $3 = $45. The selling price of the handbag is $100. With these figures, the contribution margin per unit is calculated as the selling price minus the variable cost per unit: $100 - $45 = $55. This $55 represents the amount each handbag contributes toward covering the boutique’s fixed costs, such as rent and salaries, and eventually toward profit.
Next, consider the total contribution margin. Suppose the boutique sells 200 handbags in a month. The total contribution margin is the per-unit contribution margin multiplied by the number of units sold: $55 × 200 = $11,000. Alternatively, it can be computed as total sales revenue minus total variable costs. Total sales revenue is $100 × 200 = $20,000, and total variable costs are $45 × 200 = $9,000, yielding the same $11,000. This figure shows how much money is available to cover all fixed costs for the month; any amount remaining after fixed costs is the boutique’s profit.
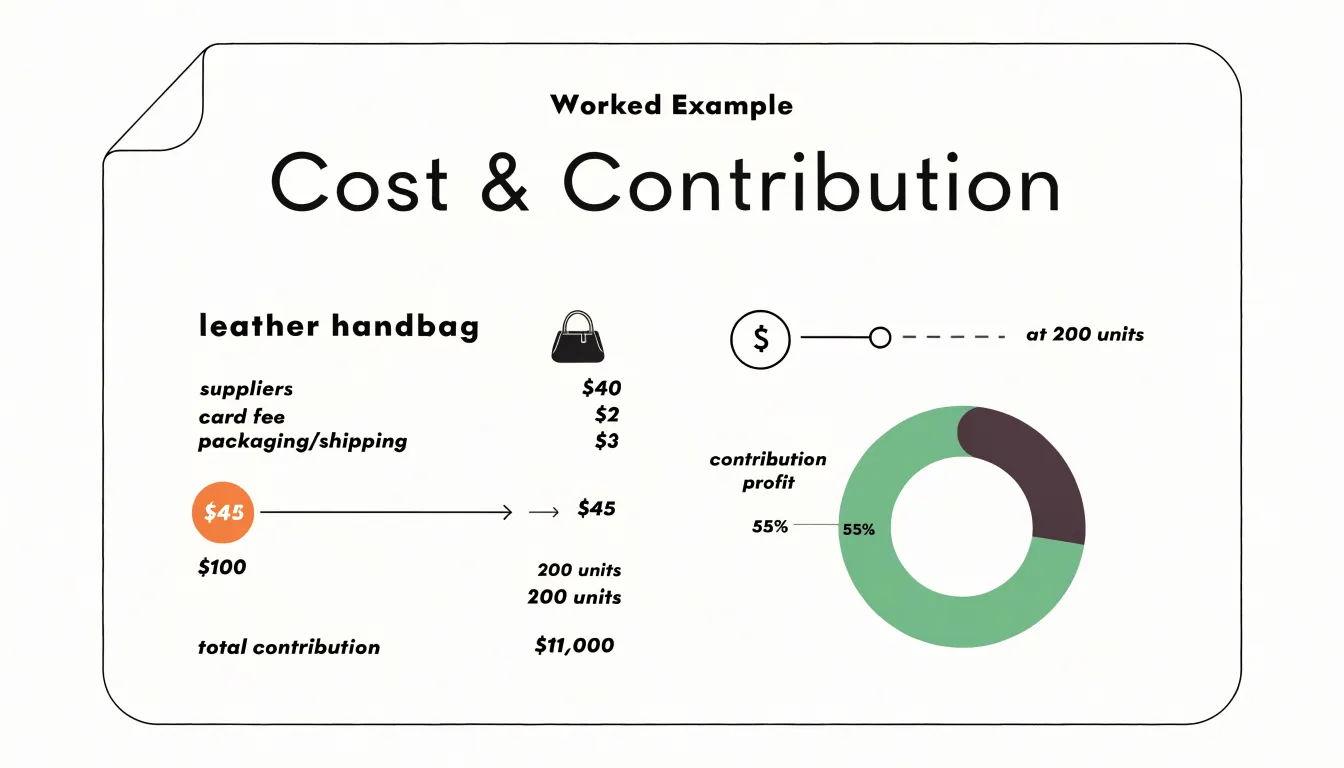
Finally, the contribution margin ratio expresses the per-unit contribution margin as a percentage of the selling price. It is calculated as ($55 / $100) × 100 = 55%. This ratio indicates that 55 cents of every sales dollar are available to cover fixed costs and contribute to profit. The ratio is particularly useful for comparing products with different price points or for forecasting how changes in sales volume will affect overall profitability. For instance, if the boutique expects a 10% increase in sales, it can estimate a corresponding 10% increase in total contribution margin, assuming the per-unit variable costs and selling price remain constant. By walking through these calculations, a retailer can clearly see the financial impact of each sale and make informed decisions about pricing, cost control, and product mix.
How does contribution margin differ from gross profit margin
Contribution margin and gross profit margin both measure profitability, yet they draw their boundaries around costs in different places, and understanding those boundaries is essential for using either metric correctly. Gross profit margin begins with revenue and subtracts cost of goods sold, the direct costs of producing the goods or services a company sells: raw materials, direct labor, and manufacturing overhead. What remains is gross profit, expressed as a percentage of revenue. This figure reflects the profitability of production itself and is a standard line on the income statement, which makes it familiar and easy to compare across companies.
Contribution margin starts from the same revenue figure but subtracts all variable costs, a broader category than cost of goods sold. Variable costs include everything that rises or falls with sales volume, and that set extends beyond production. Sales commissions, shipping and delivery charges, transaction fees, packaging, and variable utilities all count as variable costs even though none of them appear in cost of goods sold. As a result, contribution margin typically comes out lower than gross margin for the same company and period, because it absorbs more of the costs that scale with activity.
The distinction matters because the two metrics answer different questions. Gross margin speaks to production efficiency and pricing power on the goods themselves. Contribution margin speaks to how much each sale adds toward covering fixed costs and generating profit, which makes it the more useful figure for decisions such as whether to accept a special order, how to allocate a constrained resource, or where to set a break-even target. A product with a healthy gross margin can still carry a thin contribution margin if selling and distribution costs are heavy.
A simple example illustrates the gap. A company sells a product for $100 with $40 of cost of goods sold and $15 of variable selling and shipping costs. Gross profit is $60, a 60 percent margin, while contribution margin is $45, or 45 percent. Both numbers are accurate; they simply account for different slices of the cost structure. Analysts often look at both side by side to see how much profitability survives once all volume-driven costs are counted.
How to use contribution margin to calculate your break even point
Once you know your contribution margin, you can use it to determine your break-even point—the sales volume at which total revenue equals total costs, resulting in neither profit nor loss. The break-even formula is straightforward: fixed costs divided by contribution margin per unit. This gives you the number of units you need to sell to cover all fixed costs. Alternatively, if you prefer to work in sales dollars, divide fixed costs by the contribution margin ratio. The contribution margin ratio is contribution margin per unit divided by selling price per unit. Both approaches yield the same break-even point, just expressed in different units.
To apply the formula, start by identifying your fixed costs—those expenses that don’t change with production or sales volume, such as rent, salaries, and insurance. Next, calculate your contribution margin per unit by subtracting variable costs per unit from the selling price per unit. Variable costs are those that vary directly with volume, like materials and direct labor. With these figures, simply divide total fixed costs by the contribution margin per unit. For example, if your fixed costs are $10,000 per month and your contribution margin per unit is $5, your break-even point is 2,000 units. That means you must sell 2,000 units each month to cover all costs. Any sales beyond that contribute to profit.
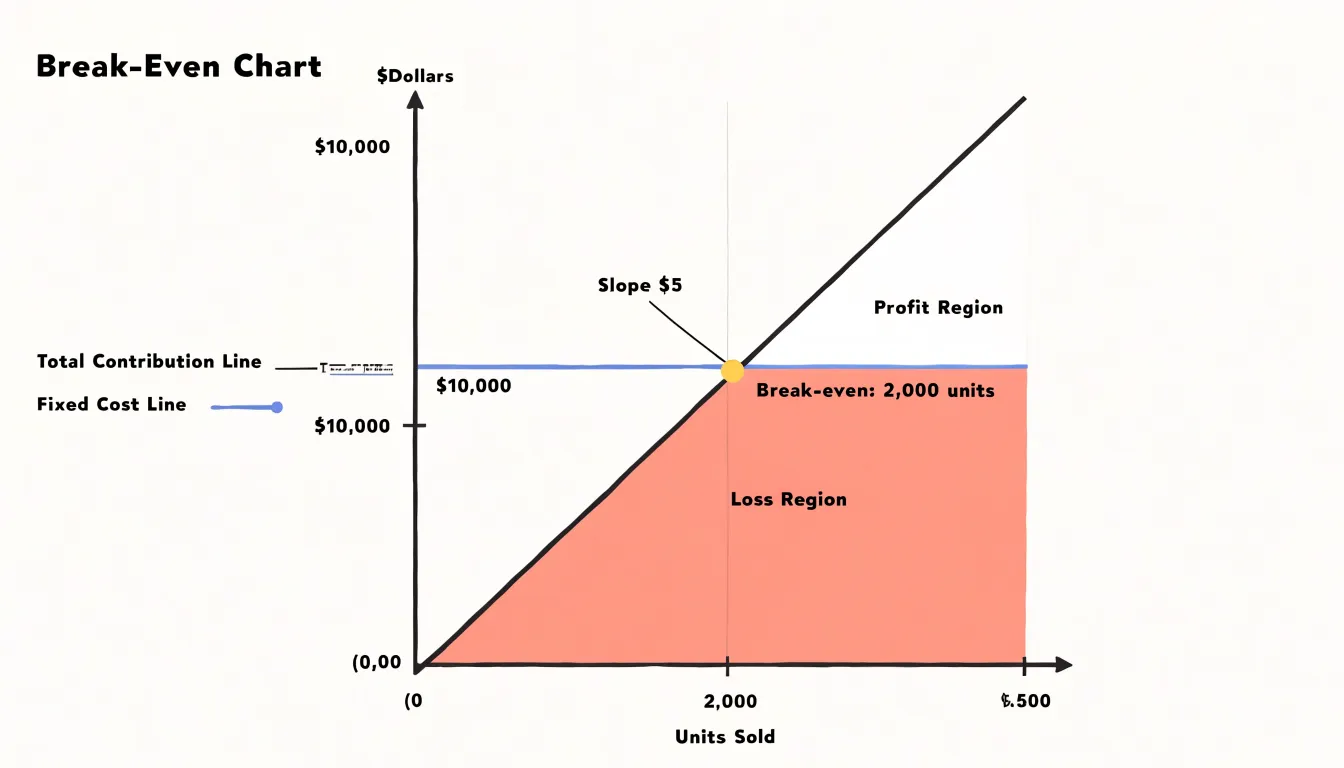
Using the contribution margin ratio works similarly. Suppose your contribution margin ratio is 40% (meaning 40 cents of every sales dollar contributes to covering fixed costs and profit). With fixed costs of $10,000, you divide $10,000 by 0.40 to get $25,000 in sales revenue needed to break even. This dollar-based break-even point is especially useful for businesses with multiple products, where unit sales volume may be less meaningful. By understanding your break-even point, you can set sales targets, evaluate pricing strategies, and assess the impact of cost changes on profitability. It also helps in decision-making, such as whether to introduce a new product or enter a new market, by showing the minimum performance required to avoid losses.
Setting smarter prices based on your margin data
Contribution margin analysis gives you a practical foundation for pricing decisions because it shows exactly how much each sale contributes toward covering fixed costs and generating profit. To set smarter prices, start by calculating the contribution margin per unit for each product or service: subtract variable costs, such as materials, direct labor, and transaction fees, from the selling price. That figure, expressed either in dollars or as a percentage of revenue, becomes the lens through which every pricing question can be evaluated.
Target margin pricing builds directly on this calculation. Begin with the contribution margin percentage you need across your product mix to cover fixed costs and hit your profit goals. From there, work backward to determine the minimum price that achieves that margin given your variable cost structure. If a product’s variable costs are $40 and you need a 40 percent contribution margin, the floor price is roughly $67. This approach keeps pricing grounded in the economics of your business rather than in guesswork or competitor imitation alone.
Evaluating price changes is where contribution margin analysis becomes especially useful. When you consider raising a price, the analysis shows how many units you can afford to lose before the higher price stops improving total contribution. A ten percent price increase on a high-margin product often outweighs a modest drop in volume, while the same increase on a low-margin product may be far more sensitive to customer loss. When considering discounts, run the same calculation in reverse: a ten percent price cut requires a substantial volume increase to preserve the same total contribution, and seeing that number in concrete terms often reveals whether a discount is genuinely worthwhile.
Apply the analysis across your whole catalog as well. Products with strong contribution margins can absorb competitive pressure or support promotional pricing, while low-margin items may need price adjustments, cost reductions, or reconsideration of their place in the lineup. Reviewing margin data regularly, and revisiting it whenever variable costs shift, keeps pricing decisions aligned with the financial realities of the business and builds a disciplined, evidence-based approach to setting prices.
When should you stop selling a product based on low contribution margin
Deciding when to discontinue a product because of low or negative contribution margin requires looking beyond the raw number itself and examining the context in which that number arises. Contribution margin, calculated as revenue minus variable costs, measures how much each product contributes toward covering fixed costs and generating profit. A product with a consistently negative contribution margin consumes more in variable costs than it brings in, meaning every sale deepens the loss. In most cases, a product that remains negative across multiple periods, after reasonable pricing and cost adjustments have been attempted, is a strong candidate for discontinuation. A product with a persistently low but positive margin deserves closer scrutiny, since it still contributes something toward fixed costs.
Fixed cost allocation is a critical consideration. Many companies allocate fixed overhead across products, and this allocation can make a product appear unprofitable when its actual cash contribution is positive. Before discontinuing, isolate the truly variable costs from allocated fixed costs. If a product covers its variable costs and makes a positive contribution, dropping it may simply shift its share of fixed costs onto remaining products, leaving total company profit unchanged or worse. Discontinuation decisions should rest on contribution margin calculated with genuine variable costs, not fully loaded costs.
Strategic value also matters. Some products are sold at low or negative contribution margin because they drive traffic, anchor customer relationships, complete a product line, or support the sale of higher-margin items. A loss leader that reliably increases sales of complementary products may justify its place. Similarly, a product may be held during a market-entry phase or to block a competitor, with an explicit plan and timeline for reaching target margins. The key is to make this strategic rationale explicit and time-bound rather than allowing chronic underperformance to persist unexamined.
Practical guidelines include setting a review threshold, such as a negative contribution margin sustained for two or more consecutive quarters, and requiring a documented strategic justification for any exception. Evaluate the impact of discontinuation on shared fixed costs, customer relationships, and complementary sales before acting. Where a product is retained despite weak margins, assign a clear improvement plan with pricing, sourcing, or volume targets and a defined review date, so that the decision remains deliberate and grounded in the numbers.
Frequently Asked Questions
What is contribution margin?
Contribution margin is the amount of money a business retains from sales after subtracting the variable costs directly tied to producing and selling its goods or services. It is calculated as revenue minus variable costs and represents money available to cover fixed costs and, once those are covered, profit.
How do you calculate contribution margin per unit?
Contribution margin per unit equals the selling price per unit minus the variable cost per unit. That figure captures how much each sale contributes toward covering fixed costs and, after that, toward profit.
What does the contribution margin ratio tell you?
The contribution margin ratio expresses contribution margin as a percentage of sales revenue by dividing contribution margin by total revenue. A 40 percent ratio means 40 cents of every sales dollar remain after variable costs to cover fixed costs and build profit.
How is contribution margin different from gross profit margin?
Gross profit margin subtracts cost of goods sold from revenue, while contribution margin subtracts all variable costs, a broader category that can include sales commissions, shipping, transaction fees, and packaging. As a result, contribution margin typically comes out lower than gross margin for the same company and period because it absorbs more volume-driven costs.
How do you use contribution margin to calculate break-even point?
To find break-even units, divide fixed costs by contribution margin per unit; to find break-even sales dollars, divide fixed costs by the contribution margin ratio. Both approaches yield the same break-even point expressed in different units.
How can contribution margin help with pricing decisions?
Contribution margin shows how much each sale contributes toward fixed costs and profit, so managers can evaluate whether a discount or price increase is worthwhile. It also supports target margin pricing by working backward from the contribution margin percentage needed to cover fixed costs and hit profit goals to determine a minimum price.