Cost of Capital
Cost of capital is the minimum return a company must earn on investments to satisfy lenders and shareholders, acting as a hurdle rate for capital budgeting. It blends the after-tax cost of debt and the cost of equity, weighted by their proportions in the capital structure, into a single figure called the weighted average cost of capital (WACC).
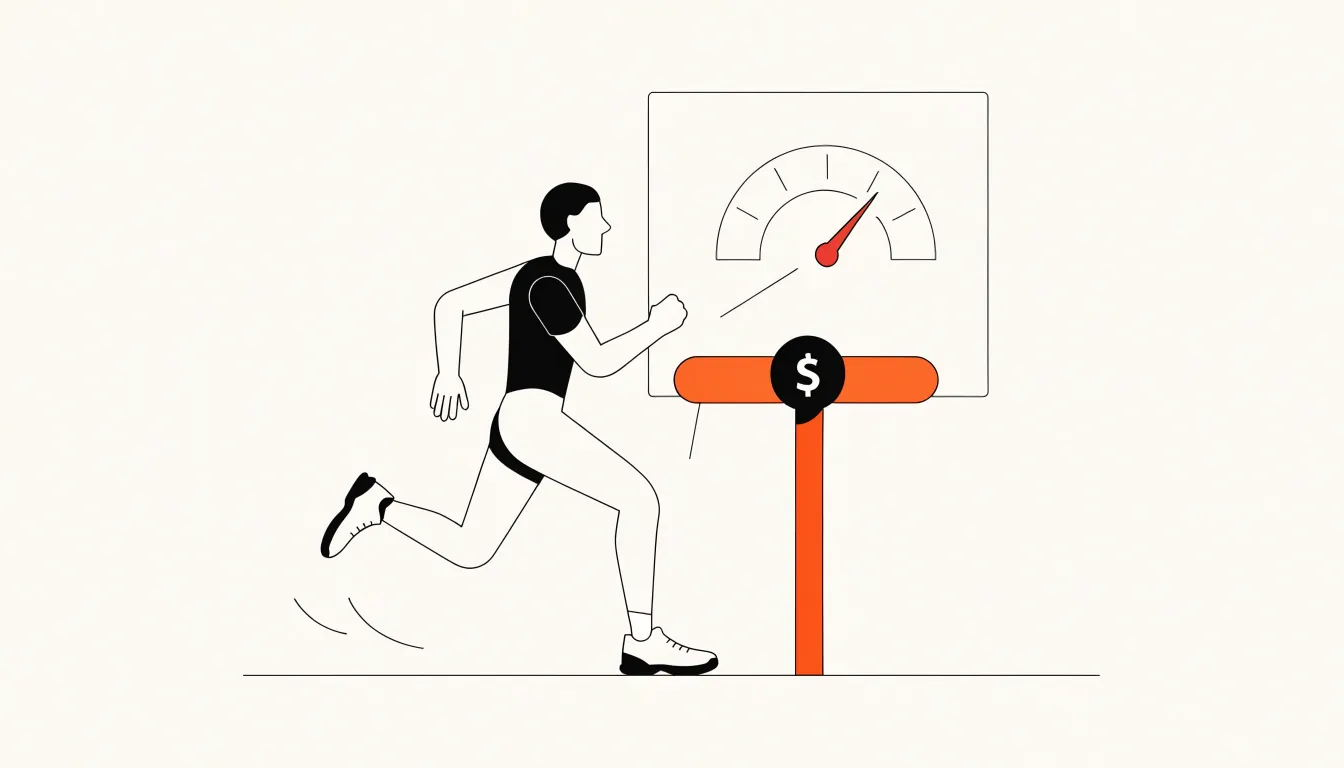
Table of Contents
- What cost of capital means for a business
- Debt versus equity
- How cost of debt works and how to measure it
- Estimating the cost of equity using common finance methods
- Weighted average cost of capital
- How do you calculate your company weighted average cost of capital?
- Key factors that raise or lower your cost of capital
- Practical application
- What is the difference between cost of capital and discount rate?
- Simple ways small business owners can reduce their overall capital costs
What cost of capital means for a business
Cost of capital represents the minimum return a company must earn on its investments to satisfy its lenders and shareholders. It acts as a hurdle rate for decision-making: any project or investment must generate a return above this rate to create value. When a company evaluates a new factory, a product line, or an acquisition, the cost of capital provides the benchmark against which the expected return is measured. If the projected return falls below the cost of capital, the investment destroys value because the company would be better off returning the capital to its investors or paying down debt. This hurdle rate applies across the board, from capital budgeting to performance evaluation, ensuring that resources are allocated to ventures that can cover the cost of the funds used.
The cost of capital also reflects the risk perceived by lenders and investors. Lenders demand interest payments that compensate for the risk of default, while shareholders expect returns that account for the volatility of the company’s earnings and the opportunity cost of their investment. A company with stable cash flows and a strong balance sheet can borrow at lower rates and attract equity capital more cheaply, resulting in a lower overall cost of capital. Conversely, a company in a volatile industry or with high leverage will face higher costs for both debt and equity, as providers of capital require a larger premium to bear the added risk. In this way, the cost of capital serves as a market-driven signal of how risky the business is perceived to be.
Finally, the cost of capital offers insight into a company’s financial health. A rising cost of capital can indicate deteriorating creditworthiness, increased business risk, or a shift in investor sentiment. It may also signal that the company is taking on too much debt or that its earnings are becoming less predictable. A low and stable cost of capital, on the other hand, suggests that the company is viewed as a safe bet, with reliable cash flows and a conservative financial policy. By monitoring changes in the cost of capital, management and investors can gauge whether the company is maintaining a healthy balance between risk and return, and whether it is likely to sustain its access to affordable funding for future growth.
Debt versus equity
Every business needs funding, and the money generally arrives through one of two channels: debt or equity. Each channel carries its own set of obligations and rewards, and the balance between them directly influences a company’s overall cost of capital.
Debt involves borrowing money with a contractual promise to repay principal and interest on a set schedule. The lender’s return is fixed, which gives the borrower certainty about future cash outflows. Interest payments are typically tax-deductible, lowering the effective cost of borrowing below the stated rate. This tax shield makes debt an attractive funding route for many firms. The trade-off is the rigid repayment obligation: missed payments can trigger default, damage creditworthiness, or push a company toward insolvency. Debt also raises financial risk, which can increase the return shareholders demand on their equity.
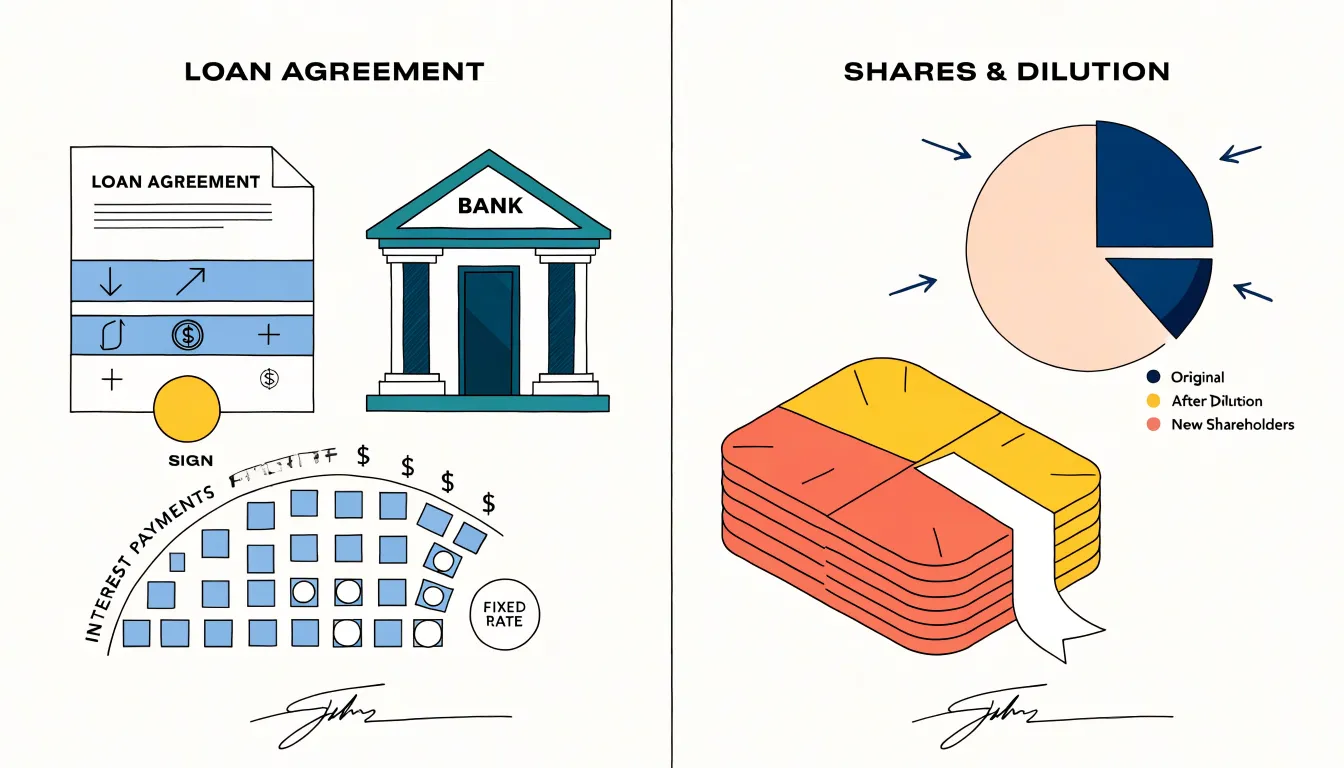
Equity means selling a stake in the business. Investors who buy shares contribute capital without any promise of repayment, and dividends are discretionary rather than contractual. This flexibility protects cash flow during lean periods. In exchange, existing owners accept dilution: their percentage ownership and claim on future profits shrink with each new share issued. Equity investors also expect a return through dividends and capital appreciation, and because they bear residual risk, that expected return is typically higher than the interest rate on debt. The cost of equity therefore tends to sit above the cost of debt.
The overall cost of capital is a blended figure reflecting the proportions of debt and equity in the capital structure. Because debt is usually cheaper and tax-advantaged, adding some borrowing can lower the weighted average cost of capital. Beyond a certain point, rising financial risk pushes up the cost of both debt and equity, and the blend becomes more expensive. Companies that carry too little debt may forgo the tax benefits and discipline of fixed obligations, while those that borrow heavily court distress. Management’s task is to find the mix that minimizes the overall cost of funding while keeping risk at a level the business can comfortably carry. That mix, revisited as conditions change, sits at the heart of capital structure decisions and shapes the hurdle rate against which investments are judged.
How cost of debt works and how to measure it
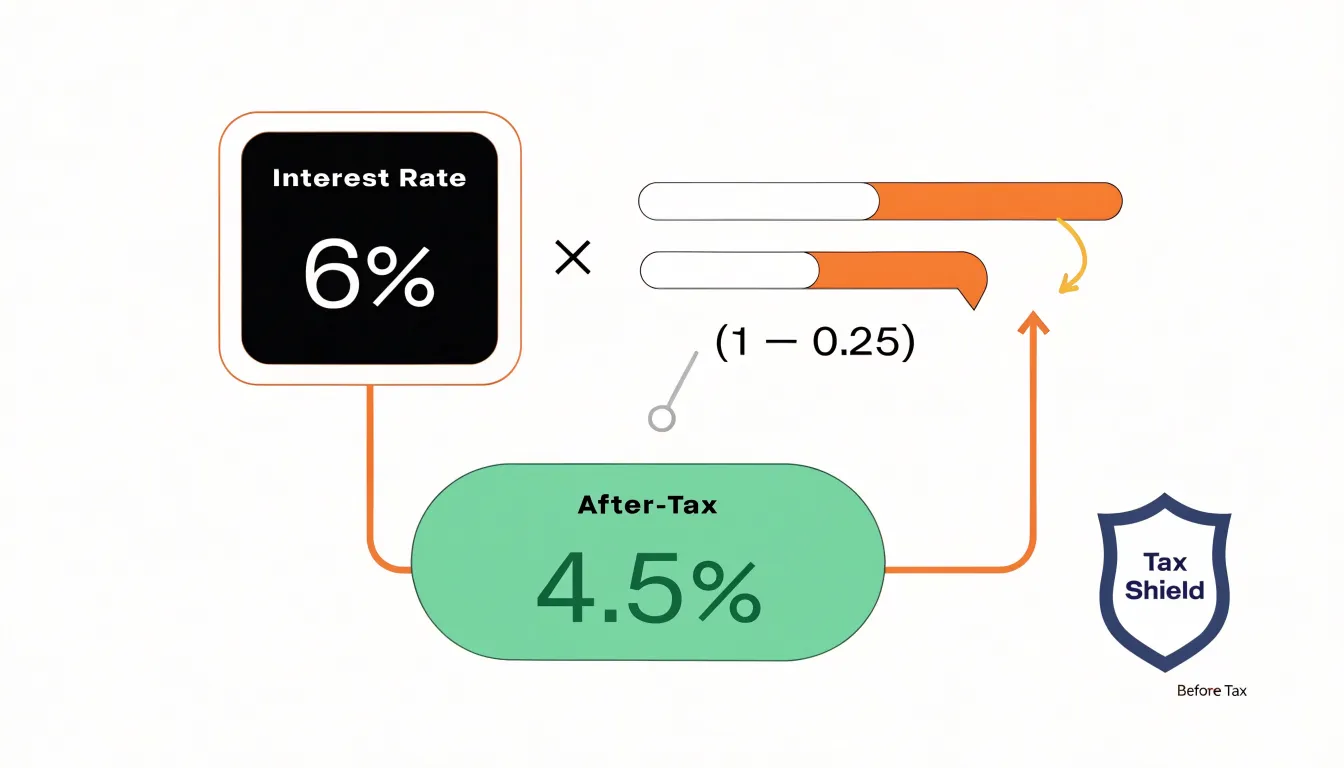
The cost of debt is the effective rate a company pays on its borrowed funds, and it forms one half of the weighted average cost of capital. For a business, debt comes with a distinct advantage: interest payments are tax-deductible. This tax shield reduces the real burden of borrowing, so the relevant measure is the after-tax cost of debt. The formula is straightforward: after-tax cost of debt = pre-tax interest rate × (1 − corporate tax rate). For example, if a company borrows at 6% and faces a 25% tax rate, the after-tax cost is 6% × (1 − 0.25) = 4.5%. The adjustment matters because the government effectively subsidizes part of the interest expense. Ignoring the tax shield would overstate the cost of debt and distort capital budgeting decisions, potentially leading a firm to reject profitable projects or misprice its overall cost of capital.
When a business has multiple loans, each with different interest rates and terms, the pre-tax cost of debt is not simply one rate. Instead, it is the weighted average of the interest rates on all outstanding debt, weighted by the market value or book value of each loan. To estimate the effective rate, list each debt instrument, note its principal and interest rate, and compute the total interest expense. Then divide total interest by total debt. This yields the weighted average pre-tax rate. For instance, if a company has a $1 million loan at 5% and a $500,000 loan at 7%, total interest is $50,000 + $35,000 = $85,000 on $1.5 million of debt, giving a pre-tax rate of 5.67%. Apply the tax shield to this blended rate to obtain the after-tax cost. In practice, analysts may also use the yield to maturity on existing bonds or the rate on new borrowing as a forward-looking estimate. For small businesses, the effective rate can be approximated from the loan statements or by asking the lender. The key is to capture the actual mix of debt and the tax environment, ensuring the cost of debt reflects the firm’s true borrowing costs.
Estimating the cost of equity using common finance methods
Estimating the cost of equity sits at the heart of any cost of capital calculation, since equity holders bear residual risk and therefore demand a return that reflects it. Because that required return is not directly observable, analysts rely on models that infer it from market data. The most widely used is the Capital Asset Pricing Model. CAPM builds the cost of equity from three inputs: the risk-free rate, typically taken from the yield on long-dated government securities; the stock’s beta, which measures its sensitivity to movements in the broader market; and the market risk premium, the excess return investors expect from equities over the risk-free asset. The formula combines these as the risk-free rate plus beta multiplied by the market risk premium. Its appeal lies in simplicity and a clear theoretical link between systematic risk and expected return, which makes it the default choice for listed companies with reliably estimated betas.
The dividend growth model offers a second route. It treats the cost of equity as the return implied by the current share price, the expected dividend, and the anticipated growth rate of those dividends, typically expressed as expected dividend yield plus growth. This approach works best for mature, dividend-paying firms with a stable and predictable payout policy, such as utilities or established consumer staples companies. It struggles where dividends are irregular, suspended, or absent, and it is highly sensitive to the assumed growth rate, since small changes in that input can move the estimate substantially.
Choosing between the approaches depends on the firm and the data available. CAPM suits listed companies with sufficient trading history to estimate beta credibly, and it remains usable even for non-dividend payers. The dividend growth model fits firms with consistent distribution records and transparent growth expectations. In practice, many analysts compute both and compare the results, using the range as a sanity check on the estimate. That triangulation helps guard against the weaknesses inherent in any single model and produces a cost of equity figure robust enough to feed into the weighted average cost of capital.
Weighted average cost of capital
Most companies fund their operations through a mix of sources rather than a single channel. A firm might carry bank loans, issue corporate bonds, and sell equity shares to investors, all at the same time. Each of these sources carries its own price tag: lenders demand interest, and shareholders expect a return on the money they have committed. The weighted average cost of capital, or WACC, is the tool that pulls these separate costs together into one composite figure. It works by taking the after-tax cost of debt and the cost of equity, then weighting each one according to the proportion it represents of the firm’s total capital structure. A company financed 40 percent by debt and 60 percent by equity, for instance, would weight its debt cost at 0.4 and its equity cost at 0.6, then add the two products together.
The logic behind this blending is straightforward. Every dollar the firm raises carries an implicit price, and the firm’s true cost of funding is the average price across all its dollars. If half the capital comes from relatively cheap debt and half from more expensive equity, the overall cost sits between the two, tilted toward whichever source dominates. This is why capital structure decisions matter so much: shifting the mix toward cheaper debt lowers the WACC, while leaning more heavily on equity raises it. The after-tax adjustment on debt reflects the fact that interest payments are tax-deductible, which effectively reduces what borrowing costs the firm.
The resulting figure serves as the firm’s overall required return, a single benchmark against which investment opportunities can be judged. When a company considers a new factory, an acquisition, or a product line, it needs a hurdle rate, and WACC supplies that rate. Projects expected to earn more than the WACC are generally value-creating, since they cover the cost of the capital deployed. Projects falling below it destroy value. In this sense, WACC translates the expectations of lenders and shareholders into a practical decision rule that management can apply consistently across the business. It also anchors valuation work, since analysts discount future cash flows at the WACC to estimate what a company or project is worth today. Understanding how the components combine, and how sensitive the total is to changes in the mix or in market conditions, gives managers a clearer picture of what their funding really costs.
How do you calculate your company weighted average cost of capital?
To calculate your company’s weighted average cost of capital (WACC), you need to determine the proportion of debt and equity in your capital structure, apply the respective costs to each, and combine them into a single percentage. Here is a step-by-step worked example.
First, gather the market values of debt and equity. For equity, use the current share price multiplied by the number of shares outstanding. Suppose your company has 10 million shares trading at $20 each, giving a market value of equity of $200 million. For debt, use the market value of outstanding bonds or the book value if market value is not readily available. Assume your company has $100 million in debt. Total capital is $300 million.
Next, compute the weights. Equity weight is $200 million divided by $300 million, or 66.7%. Debt weight is $100 million divided by $300 million, or 33.3%. These weights sum to 100%.
Then, determine the cost of equity and the after-tax cost of debt. The cost of equity can be estimated using the Capital Asset Pricing Model (CAPM): risk-free rate plus beta times the market risk premium. Assume a risk-free rate of 3%, a beta of 1.2, and a market risk premium of 6%, giving a cost of equity of 3% + 1.2 × 6% = 10.2%. The cost of debt is the yield to maturity on the debt, say 5%. Since interest is tax-deductible, use the after-tax cost of debt: 5% × (1 - 0.30) = 3.5%, assuming a 30% tax rate.
Now apply the WACC formula: WACC = (E/V) × Re + (D/V) × Rd × (1 - Tc). Plugging in the numbers: (0.667 × 10.2%) + (0.333 × 3.5%) = 6.80% + 1.17% = 7.97%. So your WACC is approximately 8.0%.
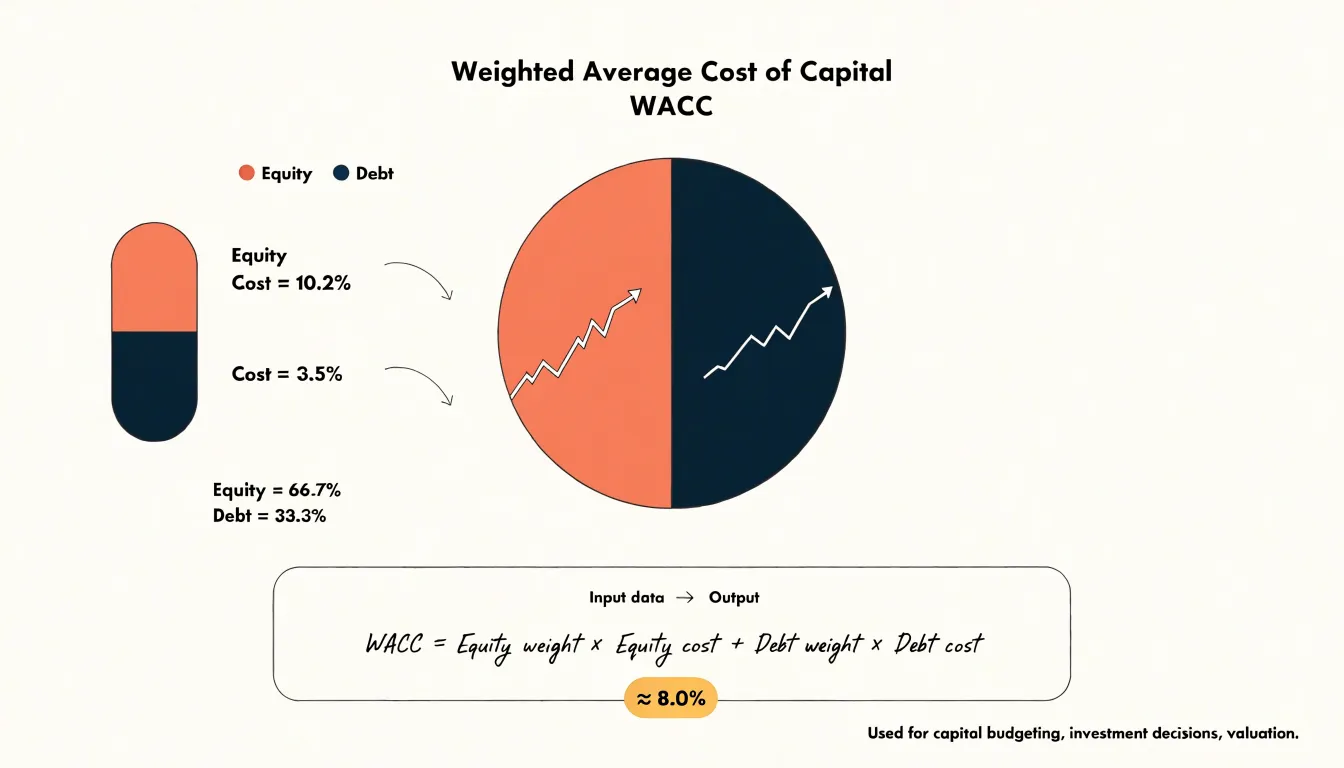
Interpret this percentage as the minimum return your company must earn on new investments to satisfy its debt and equity holders. If a project’s expected return exceeds 8.0%, it adds value; if it falls below, it destroys value. WACC also serves as the discount rate for evaluating cash flows in capital budgeting and reflects the overall risk of the company’s existing assets.
Key factors that raise or lower your cost of capital
The cost of capital is shaped by a set of interconnected forces, each of which shifts the return investors and lenders expect to receive. Prevailing interest rates serve as the foundation. When central banks raise benchmark rates, the yields on government bonds climb, and since those bonds represent a low-risk alternative, investors demand higher returns from businesses to justify tying up their money elsewhere. Falling rates have the opposite effect, pulling the overall cost of capital downward across the economy.
A company’s credit rating translates its financial health into a concrete price for borrowing. Lenders rely on ratings from agencies to gauge default probability, and a strong investment-grade rating signals reliability, allowing a firm to issue debt at lower yields. A downgrade forces the company to pay a premium, directly elevating the cost of debt and, by extension, the blended cost of capital.
Business risk reflects how predictable a company’s earnings are. Firms operating in stable, recession-resistant industries with diversified revenue streams present less uncertainty to investors, who accept a lower risk premium. Companies in volatile sectors, or those dependent on a handful of customers or products, must offer higher expected returns to attract capital.
Capital structure, the mix of debt and equity, plays a central role. Debt is generally cheaper than equity because interest payments are tax-deductible and lenders accept lower returns given their priority claim on assets. However, adding debt increases financial risk, and beyond an optimal point, both lenders and shareholders demand higher returns, pushing the overall cost of capital back up.
Company size matters as well. Larger firms benefit from greater liquidity, more analyst coverage, and easier access to capital markets, all of which reduce the premium investors require. Smaller companies often face higher costs because of perceived instability and thinner trading volumes.
Finally, market conditions create swings that individual firms cannot control. During periods of economic uncertainty or market stress, risk aversion rises, credit spreads widen, and equity valuations fall, raising the cost of capital for nearly everyone. In buoyant markets, abundant liquidity and confident investors compress the returns demanded, lowering the price of raising money.
Practical application
The cost of capital becomes most useful when it is put to work as a decision tool for new investment projects. In practice, a company’s weighted average cost of capital serves as the minimum acceptable return, often called the hurdle rate, that any proposed project must clear before management commits resources. The logic is straightforward: capital has a price, and a project that earns less than that price destroys value even when it produces an accounting profit. Comparing a project’s expected return against the hurdle rate therefore gives managers a consistent, defensible benchmark for saying yes or no.
Two standard techniques translate this comparison into numbers. Net present value discounts a project’s projected cash flows at the cost of capital and subtracts the initial outlay; a positive NPV signals that the project earns more than the capital it consumes. Internal rate of return takes the opposite approach, solving for the discount rate at which NPV equals zero, and then compares that rate directly to the hurdle rate. A project whose IRR exceeds the cost of capital is generally acceptable, while one that falls short should be rejected or reworked. Used together, NPV and IRR give managers both an absolute measure of value created and an intuitive percentage return that is easy to communicate to boards and investors.
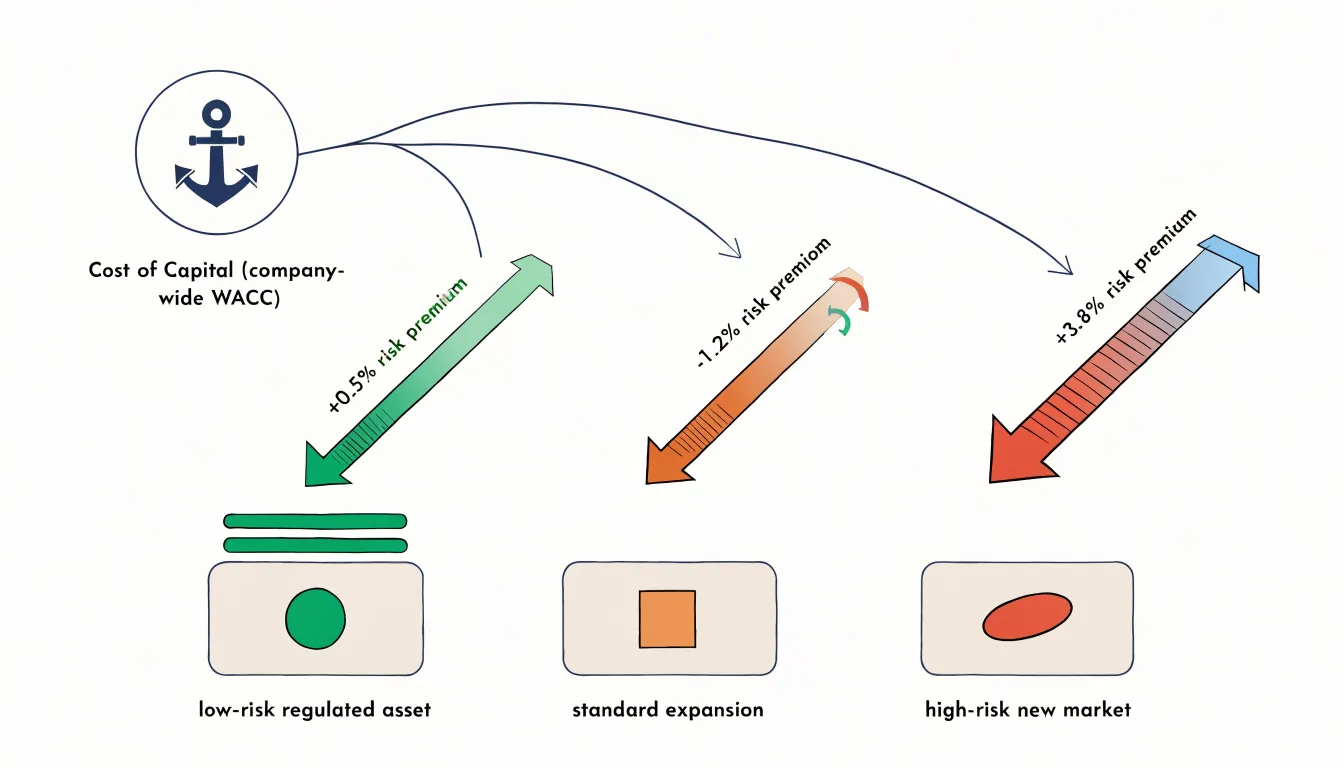
A single company-wide hurdle rate, however, can mislead when projects differ in risk. A venture into an unfamiliar market or an unproven technology carries more uncertainty than an expansion of existing operations, and applying the same discount rate to both overstates the value of the riskier venture. Analysts therefore adjust for project-specific risk, either by adding a risk premium to the hurdle rate for higher-risk proposals or by using a beta and capital structure that reflect the project’s own industry rather than the parent company’s. Scenario and sensitivity analysis can further test how robust the decision is to changes in key assumptions.
The discipline of routing every significant proposal through this framework keeps capital allocation grounded in evidence rather than enthusiasm, and it gives leadership a common language for ranking competing uses of scarce funds.
What is the difference between cost of capital and discount rate?
The cost of capital and the discount rate are closely related concepts that serve different purposes in financial analysis, and keeping the distinction clear helps avoid confusion when evaluating investments. The cost of capital is a company-level benchmark. It represents the minimum return a firm must earn on its investments to satisfy the expectations of its capital providers—both lenders and shareholders. This figure is derived from the firm’s overall capital structure, blending the after-tax cost of debt with the cost of equity in proportion to their weights. In this sense, the cost of capital describes a hurdle that applies to the business as a whole, reflecting the average risk of the company’s existing assets and operations. It is a single reference rate that management can use to gauge whether the firm is creating or destroying value across its activities.
The discount rate, by contrast, is a project-specific rate applied when converting future cash flows into a present value. Every present value calculation requires a rate that reflects the risk and timing of the particular cash flows being evaluated. For a project with risk comparable to the firm’s existing business, the company’s cost of capital often serves as the natural starting point for the discount rate. For projects that carry different risk—a venture into a new market, a stable regulated asset, or a highly speculative initiative—the discount rate should be adjusted upward or downward to match that project’s risk profile.
The relationship between the two is therefore one of foundation and application. The cost of capital provides the anchor, the baseline rate that reflects how the market prices the firm’s overall risk. The discount rate takes that anchor and tailors it to the specific circumstances of an investment. Analysts commonly begin with the weighted average cost of capital and then modify it—adding a premium for higher-risk projects or subtracting for lower-risk ones—to arrive at an appropriate discount rate.
Keeping these concepts distinct has practical value. The cost of capital answers a strategic question about whether the company as a whole is earning enough relative to its funding costs. The discount rate answers a valuation question about what a specific stream of future cash flows is worth today. Using a single figure indiscriminately for both purposes can lead to misallocation of capital, either by rejecting worthwhile lower-risk projects or by accepting value-destroying higher-risk ones.
Simple ways small business owners can reduce their overall capital costs
For a small business owner, the cost of capital is rarely an abstract figure. It shows up as the interest rate on a line of credit, the terms a lender demands before approving a loan, or the return an investor expects in exchange for funding. Because these costs compound over the life of a business, even modest improvements can free up meaningful cash that can be reinvested into operations or growth. The good news is that several of the levers available to owners are practical and can be pulled without a finance degree.
Improving creditworthiness is often the first place to start. Lenders price risk, and a stronger credit profile signals that a business is a safer bet. That means paying bills on time, keeping credit utilization low, correcting errors on business and personal credit reports, and separating personal and business finances so that both profiles look clean. For many owners, these steps take a few months of discipline but can lower the rates offered on future financing.
Refinancing high-interest debt is another direct route to savings. Credit card balances, merchant cash advances, and short-term loans often carry annual rates in the double digits. Replacing that debt with a lower-rate term loan or an SBA-backed product can cut interest expenses substantially, provided the business can qualify and the fees make sense.
The mix of debt and equity in the capital structure matters as well. Debt is often cheaper than equity because interest is tax-deductible, though too much borrowing raises risk. Equity avoids repayment obligations but dilutes ownership. Owners can work toward a blend that keeps financing costs reasonable while leaving room to absorb a downturn.
Finally, reducing perceived risk through stable cash flow and transparency pays off at the negotiating table. Lenders and investors charge less when they trust what they see. Consistent bookkeeping, clear financial statements, documented revenue trends, and open communication about challenges all signal reliability. A business that can demonstrate predictable cash flow and present its numbers honestly often earns better terms.
Frequently Asked Questions
What does cost of capital mean for a business?
Cost of capital is the minimum return a company must earn on its investments to satisfy its lenders and shareholders, and it acts as a hurdle rate for decision-making. If a project’s projected return falls below the cost of capital, it destroys value.
What is the difference between debt and equity financing?
Debt is borrowing money with a contractual promise to repay principal and interest on a set schedule; interest payments are typically tax-deductible, but missed payments can trigger default. Equity means selling a stake in the business, with discretionary dividends rather than repayment obligations, but existing owners face dilution and equity investors typically expect a higher return.
How do you calculate the after-tax cost of debt?
The after-tax cost of debt is calculated as the pre-tax interest rate × (1 − corporate tax rate). For example, a 6% borrowing rate with a 25% tax rate gives an after-tax cost of 6% × (1 − 0.25) = 4.5%.
How is the cost of equity estimated?
The article describes two common methods: the Capital Asset Pricing Model and the dividend growth model. CAPM uses the risk-free rate plus beta multiplied by the market risk premium, while the dividend growth model uses expected dividend yield plus growth.
How do you calculate WACC?
WACC is calculated by weighting the after-tax cost of debt and the cost of equity by their proportions of total capital using WACC = (E/V) × Re + (D/V) × Rd × (1 − Tc). In the article’s worked example, that produces a WACC of approximately 8.0%.
How can small business owners reduce their overall cost of capital?
The article suggests improving creditworthiness, refinancing high-interest debt into lower-rate options, and working toward a reasonable debt-and-equity mix. Small business owners can also reduce perceived risk through stable cash flow, consistent bookkeeping, clear financial statements, and transparent communication.