
Current Ratio
The current ratio is a liquidity measure calculated by dividing total current assets by total current liabilities. It shows how many dollars of near-term resources—cash, receivables, and inventory convertible to cash within one year—back each dollar of obligations due within the same period. A ratio above 1.0 indicates short-term obligations can be covered; 1.5 to 2.0 is generally considered healthy.
Table of Contents
- Understanding Current Ratio and Why Short Term Liquidity Matters
- How to Calculate Current Ratio Using Current Assets and Liabilities
- What Counts as a Current Asset on a Balance Sheet
- What Qualifies as a Current Liability
- What Is Considered a Good Current Ratio for Most Businesses
- Why a High Current Ratio Is Not Always Ideal
- Low Current Ratio Dangers
- How Healthy Ratios Vary Across Different Industries
- Current Ratio versus Quick Ratio
- Practical Ways to Improve Your Companies Short Term Ratio
Understanding Current Ratio and Why Short Term Liquidity Matters
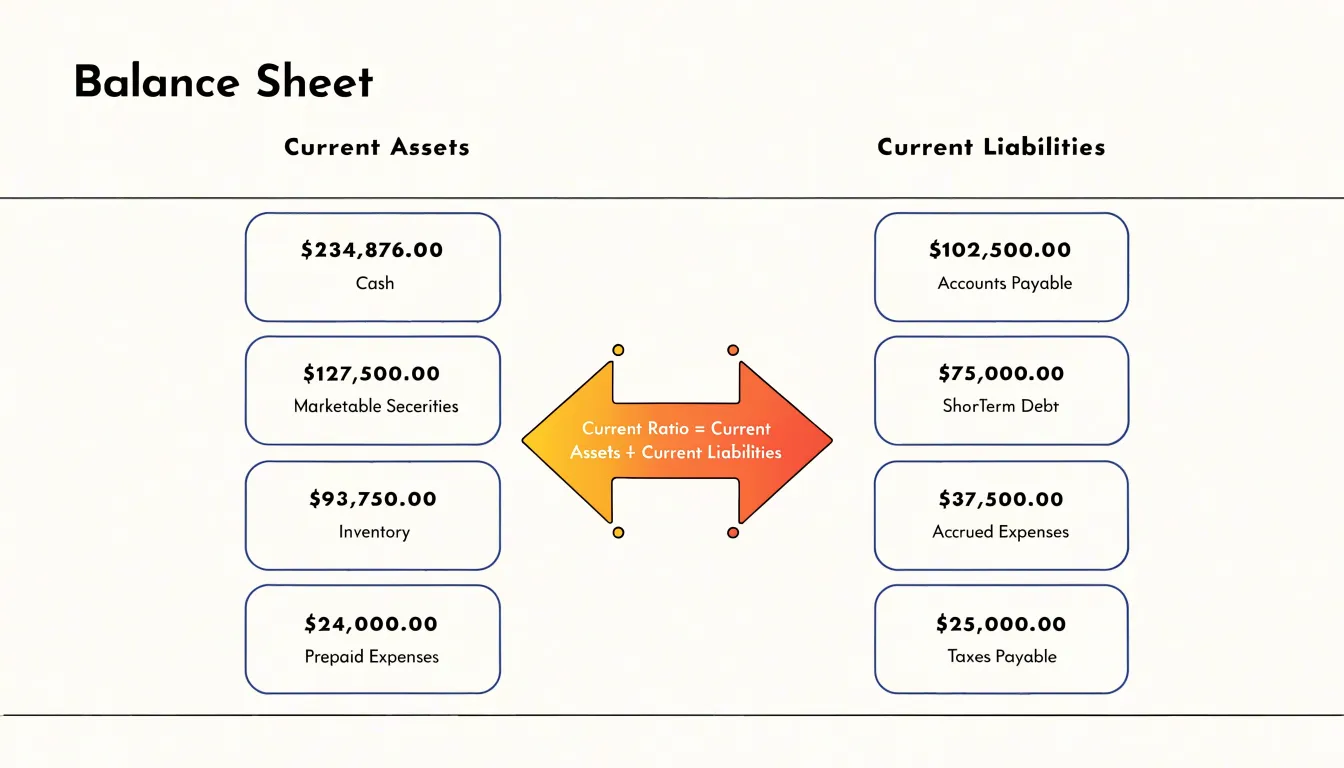
The current ratio is a liquidity measure that compares a company’s current assets to its current liabilities. Current assets include cash, marketable securities, accounts receivable, inventory, and other items expected to be converted into cash within one year. Current liabilities include accounts payable, short-term debt, accrued expenses, and other obligations due within the same twelve-month window. Dividing total current assets by total current liabilities produces a single number that expresses how many dollars of near-term resources stand behind each dollar of near-term obligations.
Short-term liquidity matters because business obligations arrive on a schedule that rarely bends to a company’s convenience. Payroll, supplier invoices, rent, loan installments, and taxes all come due at fixed intervals, and a business must have cash available when those dates arrive. A company can be profitable on paper and still fail if its cash is tied up in inventory that will not sell or in receivables that customers pay slowly. The current ratio captures this timing dimension directly by pitting resources that should convert to cash within a year against claims that fall due within that same period. A ratio above 1.0 suggests the company can cover its near-term obligations from near-term resources, while a ratio below 1.0 signals that current liabilities exceed current assets and that the company may depend on refinancing, asset sales, or new capital to meet its commitments.
Lenders and analysts track the current ratio closely because it offers a quick read on a borrower’s ability to service short-term debts and remain solvent through ordinary operating swings. Trade creditors use it when setting payment terms, and banks often write covenants around minimum liquidity thresholds. Analysts compare the ratio across periods and against industry peers to spot deteriorating working capital, buildup of slow-moving inventory, or reliance on short-term borrowing to fund long-term needs. The ratio also serves as an early warning indicator, since liquidity stress typically appears before profitability collapses. Context matters when interpreting the figure, as inventory-heavy or subscription-based businesses often operate comfortably at ratios that would alarm companies in other sectors.
How to Calculate Current Ratio Using Current Assets and Liabilities
Calculating the current ratio begins with the balance sheet, since that statement is where a company reports both its current assets and its current liabilities at a single point in time. Current assets are the resources the company expects to convert into cash, sell, or consume within one year, such as cash, marketable securities, accounts receivable, inventory, and prepaid expenses. Current liabilities are the obligations due within the same window, including accounts payable, short-term debt, accrued expenses, and the current portion of long-term debt. Locate these two subtotals on the balance sheet before doing any arithmetic.
The formula is straightforward: divide total current assets by total current liabilities. Current Ratio = Current Assets / Current Liabilities. Work through the balance sheet line by line, adding the individual current asset accounts to confirm the reported subtotal, and do the same for current liabilities. Using the verified subtotals keeps the calculation consistent with the financial statements.
Consider a worked example. A company reports current assets of $500,000, made up of $120,000 cash, $80,000 marketable securities, $150,000 accounts receivable, $130,000 inventory, and $20,000 prepaid expenses. Its current liabilities total $250,000, consisting of $100,000 accounts payable, $90,000 short-term notes payable, $40,000 accrued wages, and $20,000 in taxes payable. Dividing $500,000 by $250,000 gives a current ratio of 2.0.
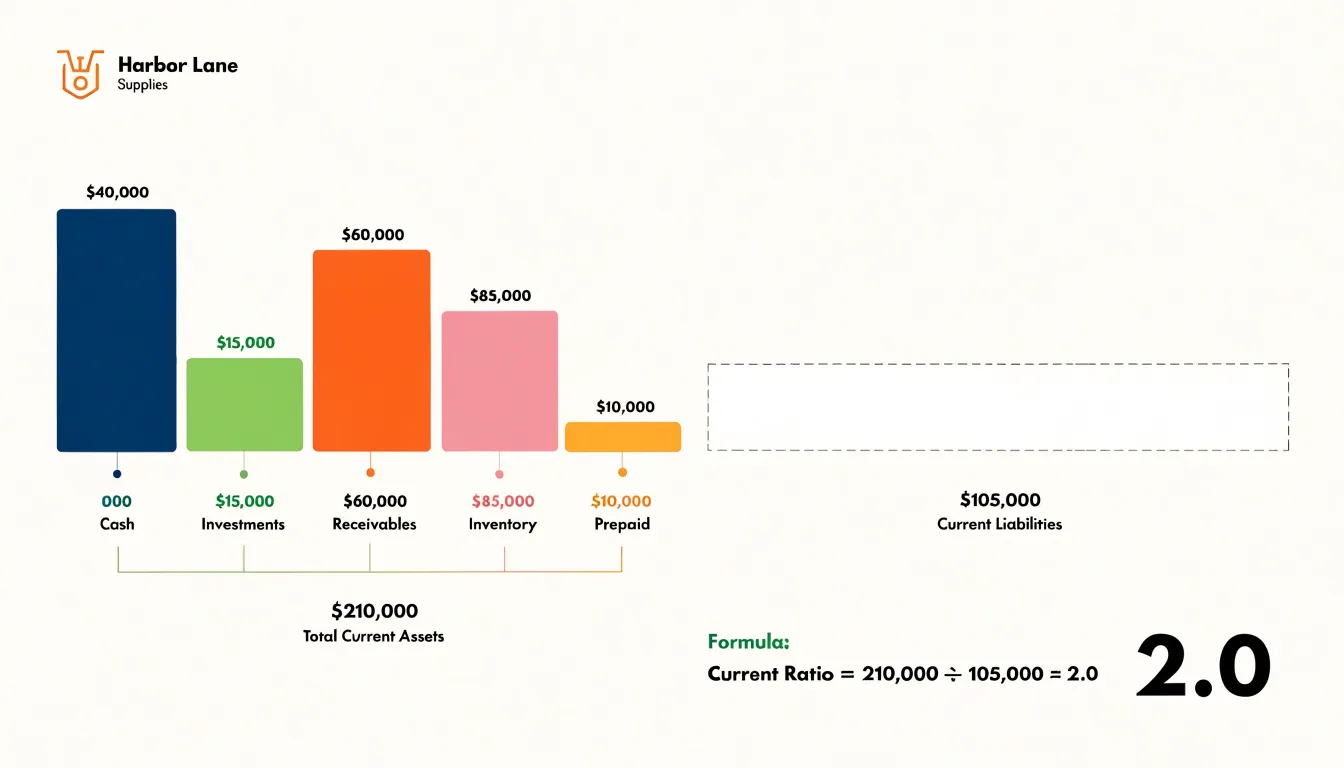
Interpretation follows directly from that figure. A ratio of 2.0 means the company holds two dollars of current assets for every dollar of current liabilities. On its face, this signals ample short-term liquidity: the company could cover its near-term obligations twice over if all current assets were liquidated at their book values. Analysts often treat a ratio around 2.0 as comfortable, though the appropriate level varies by industry. A ratio below 1.0 would indicate current liabilities exceed current assets, pointing to potential liquidity strain. A very high ratio may reflect idle cash or slow-moving inventory rather than strength, so the number is best read alongside the composition of assets and the company’s operating cycle.
What Counts as a Current Asset on a Balance Sheet
On a balance sheet, the current assets section groups together the resources a company expects to convert into cash, sell, or consume within its normal operating cycle, typically one year. The defining test is liquidity timing: an item qualifies only if it will realistically be realized in cash or used up within twelve months of the balance sheet date. Each line item below is included because it meets that test.
Cash and cash equivalents sit at the top of the section and include currency on hand, demand deposits, and short-term, highly liquid investments such as treasury bills or money market funds with original maturities of ninety days or less. Marketable securities follow; these are investments in stocks, bonds, or commercial paper that the company intends to sell within the year and that have an active market, allowing quick conversion to cash.
Accounts receivable represent amounts owed by customers for goods or services already delivered. They pass the one-year test because standard credit terms call for payment within weeks or months, and the balance is reported net of an allowance for doubtful accounts. Inventory covers raw materials, work in progress, and finished goods awaiting sale; it qualifies because the company expects to sell it and collect the proceeds within the operating cycle. Prepaid expenses, such as insurance premiums, rent, or license fees paid in advance, are included because they represent costs already paid that will be consumed within the coming year, sparing the company an equivalent cash outflow.
The one-year conversion test serves as the organizing principle for the entire section. An asset that cannot reasonably be turned into cash, sold, or used within that window is classified as non-current, even if it is otherwise liquid. This is why long-term investments, property and equipment, and most intangible assets are excluded. Applying the test consistently gives readers a clear picture of the resources available to meet short-term obligations, and it underpins ratios such as the current ratio, which compares these liquid resources against current liabilities falling due in the same period.
What Qualifies as a Current Liability
Current liabilities are the obligations a company expects to settle within one operating cycle, typically twelve months. The classification matters because it feeds directly into the current ratio, and small errors here can shift that ratio meaningfully. Four categories account for most current liabilities. Accounts payable captures amounts owed to suppliers for goods and services already received, such as inventory purchased on credit or unpaid invoices for routine services. Short-term debt includes borrowings due within a year, commercial paper, lines of credit drawn upon, and similar financing arrangements. Accrued expenses represent costs incurred but not yet paid, covering wages earned by employees, interest accumulating on debt, taxes owed, and utilities consumed during the period. The current portion of long-term debt reflects the principal that must be repaid within the next twelve months on an otherwise long-term obligation, such as the annual installments on a multi-year loan or the maturing slice of a bond issue. Unearned revenue, deposits from customers, and dividends declared but unpaid also belong in this section.
Misclassifications are common and usually stem from timing or intent. A long-term loan whose final payment falls due in eleven months belongs in current liabilities for the portion due, even though the agreement was signed years ago. Conversely, a short-term facility the company has the unconditional right to roll over, or intends to refinance on a long-term basis before the reporting date, may qualify for long-term treatment under the relevant accounting standards. Deferred tax liabilities, pension obligations, and most lease liabilities beyond the coming year stay out of current liabilities. Accruals are sometimes missed entirely when invoices have not yet arrived, understating obligations and flattering the current ratio. The current portion of long-term debt is frequently overlooked when analysts pull only the accounts payable and short-term borrowings lines. Getting these classifications right gives a realistic picture of near-term obligations and keeps the ratio comparable across periods and peers.
What Is Considered a Good Current Ratio for Most Businesses
A current ratio between roughly 1.5 and 2.0 is the range most analysts and lenders cite as healthy. At this level, a business holds enough short-term assets—cash, receivables, inventory, and other items convertible to cash within a year—to cover its near-term obligations with a modest cushion to spare. The cushion matters because balance sheet figures are estimates. Receivables may collect slower than expected, inventory may sell below its book value, and unexpected expenses can surface at any time. A ratio comfortably above 1.0 gives a company room to absorb those surprises without missing payments on wages, supplier invoices, or loan installments.
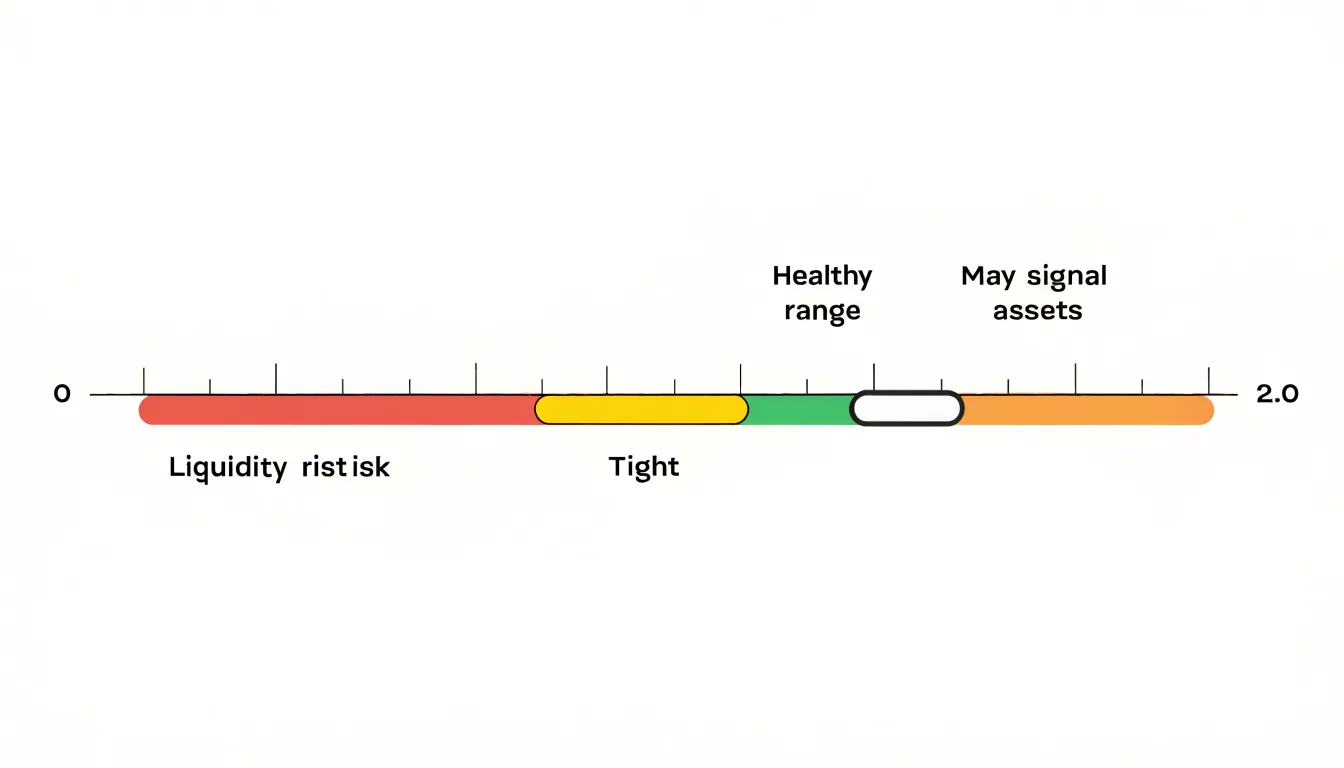
A ratio of exactly 1.0 means current assets equal current liabilities, a break-even position on short-term obligations. On paper the company can pay what it owes within the year, but only if everything converts to cash on schedule and at the values shown. In practice that leaves little margin for error. A single large customer paying late or a batch of unsold stock can tip the company into a shortfall, which is why lenders and credit analysts generally treat 1.0 as a floor rather than a comfortable position.
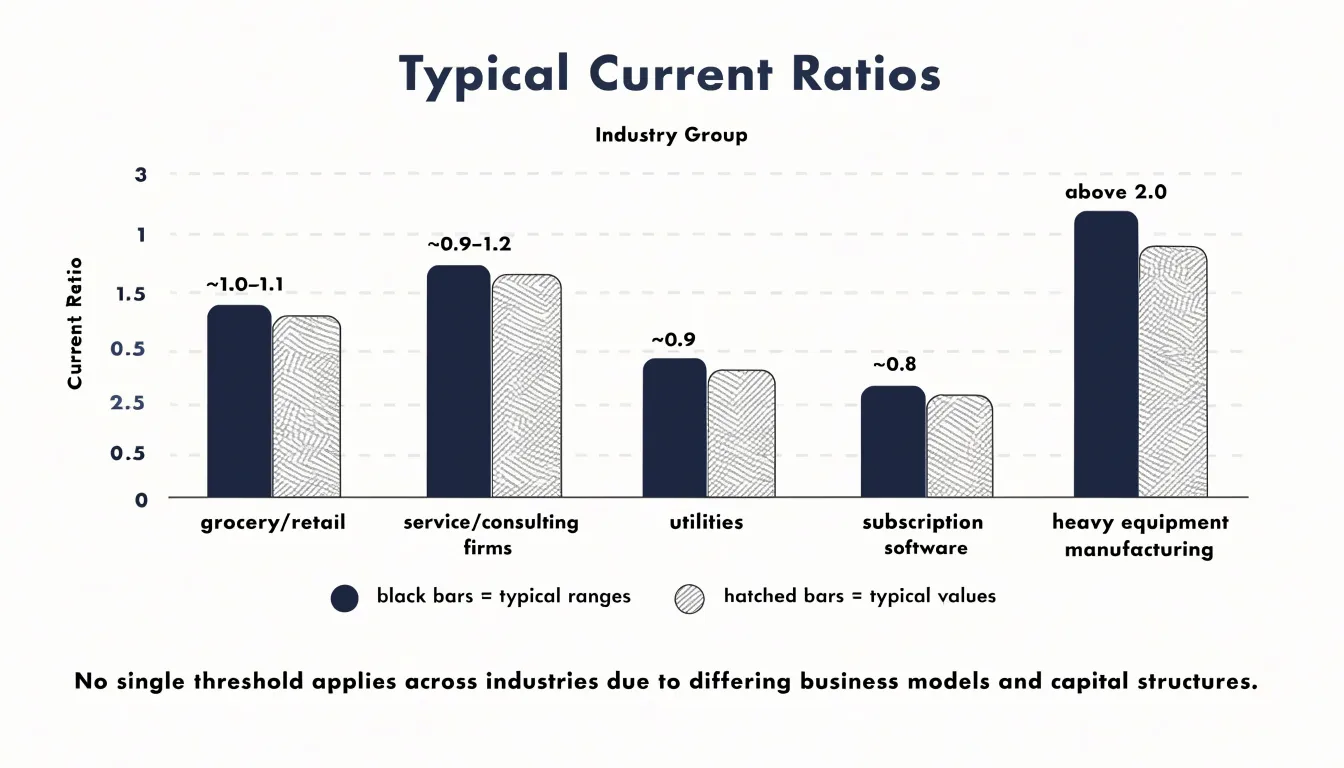
The idea of a single correct number gives way once you look at how businesses actually operate. A supermarket chain may run a current ratio below 1.0 and remain financially sound, because customers pay in cash at the register while suppliers are paid on 30- or 60-day terms. Inventory turns over quickly and cash arrives before bills come due. A manufacturer of heavy equipment, by contrast, may need a ratio well above 2.0, since inventory sits in warehouses for months and customers pay slowly on long contracts. Service firms with few physical assets often sit between the two extremes. The right number reflects the speed at which assets convert to cash relative to the timing of liabilities, so a figure that signals strength in one industry can signal weakness in another.
Why a High Current Ratio Is Not Always Ideal
A high current ratio is often treated as a sign of financial strength, and in many cases it is. A company with substantially more current assets than current liabilities has a comfortable buffer against short-term obligations, which suggests resilience to unexpected shocks and flexibility in how it manages its finances. However, an unusually high ratio deserves closer scrutiny, because the composition of those current assets matters as much as their total. When the ratio climbs well above peers or above the company’s own historical norms, it can reflect inefficiencies in how working capital is deployed rather than genuine financial prudence.
One common cause is idle cash. A firm may accumulate large cash balances without a clear plan for deploying them, whether through reinvestment, debt reduction, dividends, or strategic acquisitions. Cash sitting dormant earns little or nothing, and in an inflationary environment it loses purchasing power over time. A very high ratio driven by excess cash can therefore indicate that management is failing to put capital to productive use.
Another driver is bloated inventory. If a company holds far more stock than it can sell in a reasonable period, current assets swell while the underlying business may be struggling with weak demand, obsolescence risk, or costly storage. Inventory that sits too long can require markdowns or write-offs, and it ties up cash that could otherwise fund operations or growth. A high ratio in this scenario masks a slowdown in turnover rather than signaling health.
Slow collections offer a third explanation. When accounts receivable grow because customers are paying more slowly, the current ratio rises even as the quality of those assets deteriorates. Extended collection periods strain liquidity in practice, since the company may need to borrow or draw down reserves to meet its own obligations while waiting on customers. The ratio looks strong on paper, yet the cash conversion cycle is lengthening.
Each of these patterns points to inefficient use of working capital. The ratio itself is a snapshot, and a high reading can hide weak asset quality, poor turnover, or a lack of strategic direction. Analysts and managers should examine the individual components of current assets, compare turnover metrics over time, and consider whether the excess could be redeployed more effectively before treating a high current ratio as an unqualified positive.
Low Current Ratio Dangers
A current ratio below 1 signals that a company’s current liabilities exceed its current assets, meaning short-term obligations outstrip the resources on hand to settle them. This condition deserves close attention because it can cascade into operational and financial difficulties that compound over time. The most immediate danger is the inability to cover short-term debts as they come due. When bills, loan payments, and accrued expenses arrive before incoming cash, the company may be forced to delay payments, borrow at unfavorable terms, or liquidate assets at a discount to stay afloat. Each of these responses erodes financial stability and can trigger a downward spiral if the underlying imbalance persists.
Strained supplier relationships often follow. A firm struggling to meet its payables may begin stretching payment terms, paying late, or requesting extended credit from vendors. Suppliers notice these patterns and may respond by tightening terms, demanding cash on delivery, reducing order priority, or restricting access to essential materials. Over time, damaged vendor trust raises the cost of goods and disrupts the supply chain, which further squeezes margins and cash flow. In severe cases, key suppliers may cut off service entirely, leaving the company unable to fulfill its own customer commitments.
Several warning signs help spot working capital red flags before the situation becomes critical. Rising receivables days indicate that customers are taking longer to pay, tying up cash that the business needs for operations. A shrinking cash balance, even while revenue appears steady, suggests that collections or spending patterns are deteriorating. Together, these indicators reveal a liquidity squeeze building beneath the surface. Analysts and managers should treat a current ratio below 1 as a prompt to examine the composition of current assets and liabilities in detail, checking whether inventory is slow-moving, receivables are aging, or payables are being stretched unsustainably. Early recognition of these signals gives a company room to renegotiate terms, accelerate collections, reduce discretionary spending, or secure additional financing before a temporary shortfall becomes a full-blown solvency crisis.
How Healthy Ratios Vary Across Different Industries
A current ratio that signals robust financial health in one industry may look precarious in another, and this variation stems from the fundamental economics of each sector. Inventory-heavy businesses such as retailers and wholesalers typically carry substantial stock on their balance sheets, alongside the receivables and payables that accompany high-volume purchasing. A grocery chain, for instance, may hold large inventories of perishable goods and maintain significant current liabilities in the form of trade payables to suppliers. These businesses often post current ratios close to or slightly above 1, because their inventory turns over quickly and converts into cash within weeks, even though the nominal ratio appears modest. A ratio of 1.1 in a supermarket chain can reflect comfortable liquidity given the speed of its operating cycle.
Service firms sit at the opposite end of the spectrum. A consulting practice or advertising agency carries little to no inventory, with its current assets dominated by accounts receivable and cash. Because these firms convert receivables into cash relatively quickly and carry lower levels of short-term obligations tied to physical goods, they can operate safely at lower current ratios, sometimes even below 1, while remaining financially sound. Their working capital cycle is short, and their need for buffer assets is correspondingly smaller.
Utilities and capital-intensive industries present yet another profile. These companies often hold stable, predictable cash flows and maintain access to committed credit facilities, which reduces their reliance on large current asset balances. Their current ratios can dip below 1 without indicating distress, because their revenue streams are regulated or contracted and their financing arrangements are structured for long-term stability. A utility reporting a current ratio of 0.9 may be entirely healthy, whereas the same figure in a small manufacturer would raise immediate concerns.
These sector differences mean that cross-industry comparisons of current ratios produce misleading conclusions. A ratio of 2 that looks conservative in retail could represent idle, inefficiently deployed assets in a fast-moving consumer goods business, while a ratio of 0.8 that appears alarming in a generic context may be perfectly normal for a subscription-based software company with predictable recurring revenue. Analysts therefore anchor their assessments in industry norms, comparing a company’s current ratio against the median and range of its peer group. Trade associations, industry databases, and financial data providers publish these benchmarks, and they offer a far more meaningful reference point than any universal threshold. Judging liquidity within the correct industry context transforms the current ratio from a blunt instrument into a genuinely informative diagnostic tool.
Current Ratio versus Quick Ratio
The current ratio and the quick ratio both measure a company’s ability to cover short-term obligations, yet they answer subtly different questions. The current ratio divides total current assets by total current liabilities, capturing everything the balance sheet classifies as convertible to cash within a year. The quick ratio narrows that numerator, removing inventory and prepaid expenses so that only cash, marketable securities, and receivables remain. This adjustment matters because inventory must first be sold and collected before it becomes cash, and prepaids represent costs already paid rather than resources available to settle debts. By stripping these items out, the quick ratio offers a more conservative view of near-term solvency.
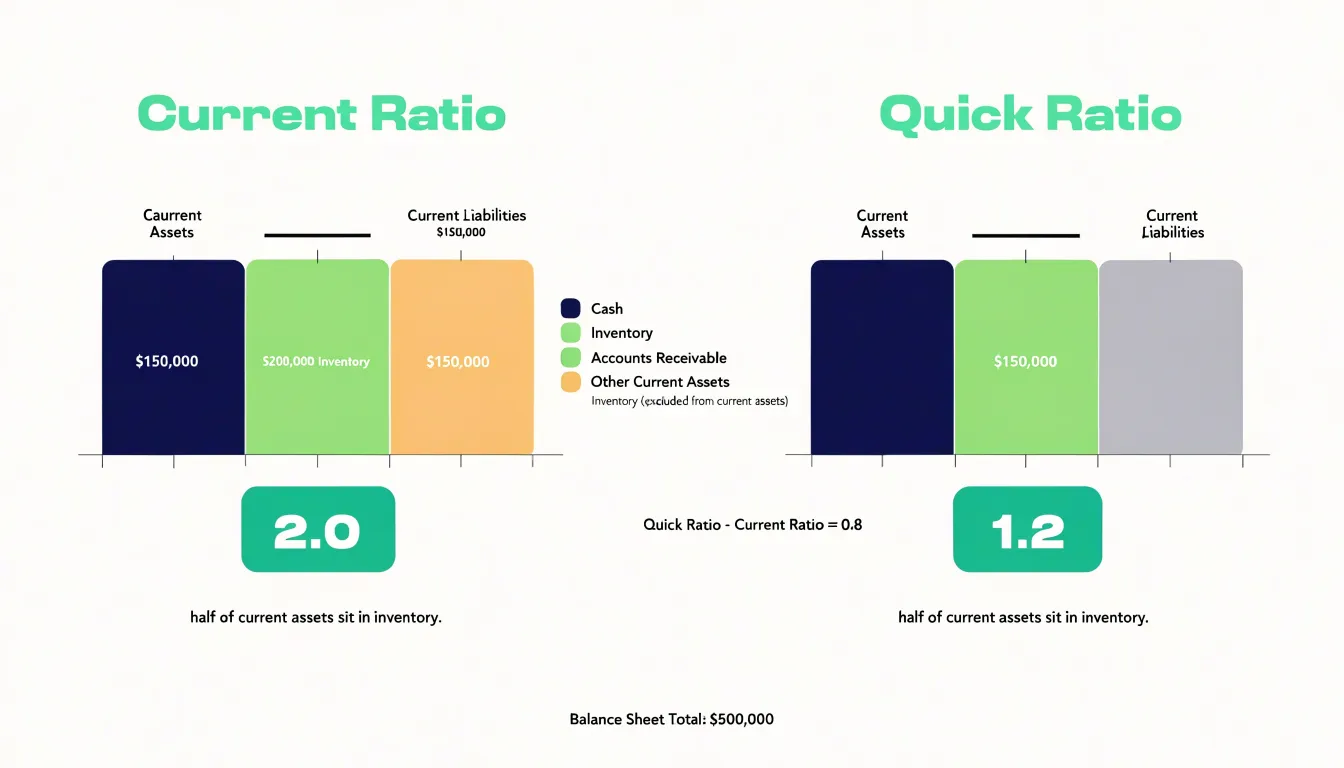
Choosing between the two metrics depends on the nature of the business. For a retailer or manufacturer holding substantial inventory that turns over reliably, the current ratio provides a fair picture, since stock genuinely converts to cash in the ordinary course of operations. For companies with slow-moving inventory, work-in-progress, or seasonal stockpiles, the quick ratio is more instructive because it excludes assets whose cash conversion is uncertain or distant. Service businesses with little inventory will often show similar values for both ratios, making the distinction less consequential. Analysts also favor the quick ratio when evaluating firms in volatile industries where inventory values can deteriorate quickly.
The gap between the two ratios reveals something about liquidity quality. A wide spread signals that a large share of current assets sits in inventory and prepaids, meaning reported liquidity depends heavily on the speed and profitability of sales. A narrow gap indicates that liquid assets dominate the current asset base, suggesting stronger and more dependable coverage of obligations. Tracking how this gap changes over time can flag deteriorating inventory turnover, buildup of unsalable stock, or growing reliance on prepayments. Reading the two ratios together, alongside turnover metrics and industry context, gives a fuller assessment than either measure alone.
Practical Ways to Improve Your Companies Short Term Ratio
Improving a company’s short-term ratio begins with the cash conversion cycle. Accelerating receivables is one of the fastest ways to strengthen liquidity. A business can tighten invoice delivery so customers receive bills immediately after goods or services are delivered. Offering early-payment discounts, such as a small percentage off for payment within ten days, encourages customers to settle sooner. Automated reminders and consistent follow-up on overdue accounts keep collections moving. Where appropriate, companies can also use invoice factoring or receivable-backed financing to convert outstanding balances into cash without waiting for the full collection period.
Renegotiating payment terms with suppliers is another practical lever. Asking vendors to extend payment windows from thirty to forty-five or sixty days frees up cash that would otherwise leave the business quickly. Consolidating purchases with fewer suppliers can create bargaining power to negotiate more favorable terms, and early-payment discounts should be weighed carefully against the value of holding cash longer. A company can also make partial payments or arrange staged payment schedules with key vendors during tight periods.
Refinancing short-term debt into long-term obligations directly improves the current ratio by moving liabilities out of the current category. A business might replace a revolving credit line or a maturing short-term loan with a term loan amortized over several years. This reduces the amount of debt due within twelve months and gives the company more runway to generate cash from operations. Institutions often look favorably on refinancing when the borrower presents a clear repayment plan and a credible operating forecast.
Right-sizing inventory addresses the other side of working capital. Excess or slow-moving inventory ties up cash and may require markdowns that erode margins. Companies can adopt just-in-time ordering for predictable items, liquidate obsolete stock at a discount, and use demand forecasting to align purchase quantities with actual sales patterns. Reducing inventory levels converts stored value into available cash and lowers holding costs, insurance, and storage expenses.
Together, these tactics support a healthier liquidity position and give management flexibility to meet obligations as they come due.
Frequently Asked Questions
What does the current ratio tell you about a company?
The current ratio compares a company’s current assets with its current liabilities and shows how many dollars of near-term resources stand behind each dollar of near-term obligations. A ratio above 1.0 suggests the company can cover its near-term obligations from near-term resources, while a ratio below 1.0 signals that current liabilities exceed current assets.
How do you calculate the current ratio?
Divide total current assets by total current liabilities using the subtotals reported on the balance sheet. For example, $500,000 in current assets divided by $250,000 in current liabilities equals a current ratio of 2.0.
What is a good current ratio for a business?
A current ratio between roughly 1.5 and 2.0 is the range most analysts and lenders cite as healthy. The appropriate level varies by industry, so a figure that signals strength in one industry can signal weakness in another.
Is a high current ratio always a good sign?
No; an unusually high current ratio can reflect idle cash, bloated inventory, or slow collections rather than genuine financial strength. Analysts should examine the composition of current assets before treating a high current ratio as an unqualified positive.
What happens if a company’s current ratio is below 1?
A current ratio below 1 means current liabilities exceed current assets, so short-term obligations outstrip the resources on hand to settle them. This can lead to delayed payments, borrowing on unfavorable terms, asset liquidation at a discount, and strained supplier relationships.
What is the difference between the current ratio and the quick ratio?
The current ratio divides total current assets by total current liabilities, while the quick ratio removes inventory and prepaid expenses from the numerator and leaves only cash, marketable securities, and receivables. By stripping out inventory and prepaids, the quick ratio offers a more conservative view of near-term solvency.