
Debt-to-Equity Ratio
The debt-to-equity ratio compares a company’s total liabilities to its shareholders’ equity, showing how much of its financing comes from debt versus owners. Calculated by dividing total liabilities by total equity, it measures financial leverage: a ratio of 1.5 means $1.50 of debt per $1.00 of equity. Higher ratios signal greater risk; below 1.0 is generally conservative.
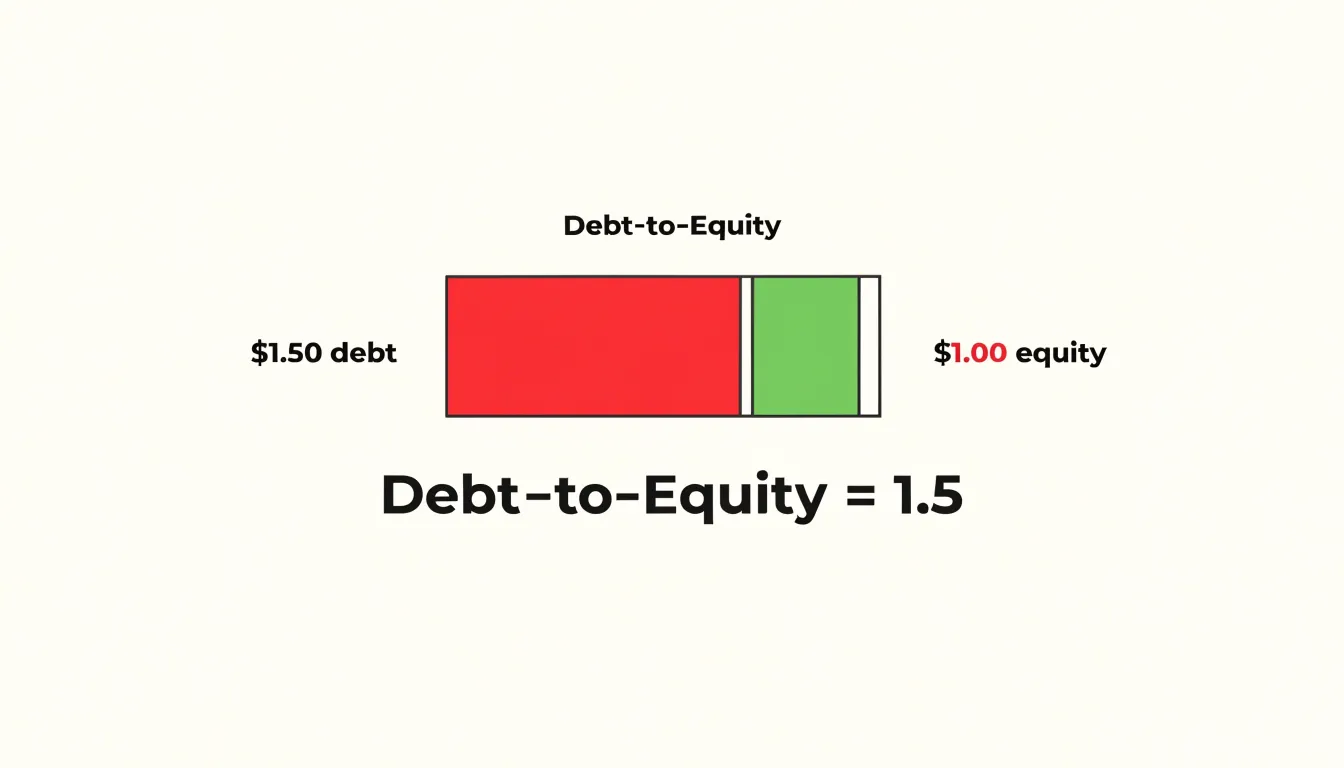
Table of Contents
- What the debt to equity ratio reveals about financial leverage
- Understanding the components of total liabilities and equity
- Calculation breakdown
- Safe zones
- Why ideal leverage targets shift across different industries
- How lenders evaluate your score during credit decisions
- Clear steps to reduce your debt to equity ratio effectively
What the debt to equity ratio reveals about financial leverage
The debt-to-equity ratio offers a window into how a company finances its operations, comparing the total liabilities on its balance sheet against shareholder equity. When the ratio is high, a larger share of the company’s asset base has been funded by creditors rather than owners, which means the business carries a greater dependence on borrowed money to keep running. Each dollar of equity is effectively stretched to support several dollars of debt, and the interest and principal obligations attached to that debt must be met regardless of how the business performs in any given quarter. This is the essence of financial leverage: using other people’s money to amplify the scale of the enterprise beyond what owners could fund alone.
Leverage carries a genuine risk-return tradeoff, and the ratio is the clearest single gauge of where a company sits along that spectrum. Borrowed capital can be a powerful tool for growth, allowing a firm to invest in new facilities, acquire competitors, or expand into new markets without diluting existing shareholders. When the returns earned on those investments exceed the cost of the debt, the surplus flows to equity holders and magnifies their gains. The same mechanism works in reverse when returns fall short, and fixed interest obligations can consume earnings that might otherwise cushion a downturn. A company with modest leverage can weather a slow period with relative calm, while a heavily leveraged peer may find its cash flow squeezed and its access to further credit restricted.
A high debt-to-equity ratio therefore sends a mixed message that requires context to interpret. It can signal an aggressive management team confident in its growth prospects and willing to use debt as an efficient funding source, particularly in capital-intensive industries where borrowing is standard practice. Compare a utility or a manufacturer with substantial fixed assets against a software firm with little need for physical capital, and the same ratio means very different things. In a company generating steady and predictable cash flows, a higher ratio may simply reflect a sensible financing choice. In a cyclical business with volatile revenues, that same figure can be an early warning of fragility. Analysts look at the ratio alongside interest coverage, industry norms, and the maturity schedule of the debt to distinguish prudent borrowing from dangerous overextension, because the ratio itself is a starting point rather than a verdict.
Understanding the components of total liabilities and equity
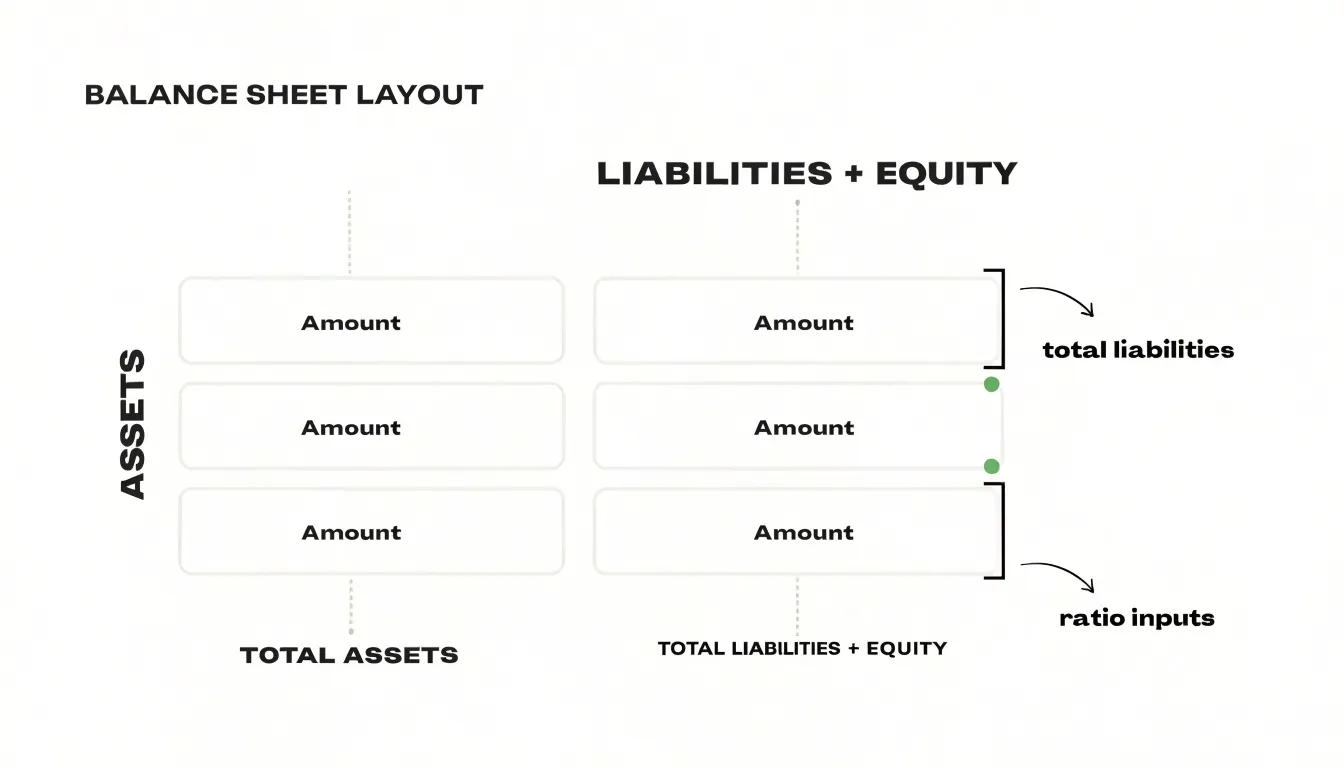
Total liabilities and shareholders’ equity form the right side of the balance sheet, representing the claims on a company’s assets. To interpret the debt-to-equity ratio effectively, you need a clear picture of what each component includes. Total liabilities encompass all obligations a company owes to outside parties. Short-term liabilities, due within one year, include accounts payable (money owed to suppliers for goods or services purchased on credit), short-term notes payable (such as a line of credit used for working capital), accrued expenses (wages, taxes, and interest that have been incurred but not yet paid), and the current portion of long-term debt (the slice of a long-term loan due in the next twelve months). Long-term liabilities, due beyond one year, include bonds payable, long-term bank loans, lease obligations, and deferred tax liabilities. For example, a retailer might have $50,000 in accounts payable, $20,000 in accrued wages, and a $100,000 mortgage due in five years; all of these are liabilities. Shareholders’ equity represents the owners’ residual claim on the business after liabilities are subtracted from assets. It typically consists of common stock (the capital contributed by equity investors in exchange for shares), additional paid-in capital (the amount paid above par value), retained earnings (cumulative profits kept in the business rather than distributed as dividends), and accumulated other comprehensive income (certain unrealized gains and losses). For instance, a company might have $1 million in common stock, $2 million in additional paid-in capital, and $3 million in retained earnings. Each element of liabilities and equity carries different implications for risk and financial flexibility. By breaking down these components, you can see that a high debt-to-equity ratio might stem from heavy reliance on short-term payables, long-term bonds, or both. Understanding the mix helps you assess whether the ratio reflects operational financing needs or aggressive leverage.
Calculation breakdown
To make the debt-to-equity ratio concrete, walk through a sample company’s balance sheet step by step. Imagine a mid-sized manufacturer, call it Harborline Industries, whose most recent balance sheet lists total liabilities of $4.2 million and total shareholders’ equity of $2.8 million. The first step is to locate these two figures on the balance sheet itself. Total liabilities appear in the liabilities section and include both current obligations, such as accounts payable and short-term borrowings, and long-term obligations, such as bonds and mortgages. Total shareholders’ equity appears at the bottom of the balance sheet and captures the residual interest of owners after liabilities are subtracted from assets.
The second step is to confirm that the figures are measured at the same point in time. Ratios become misleading when one input comes from a year-end snapshot and the other from a quarterly filing, so both numbers should be drawn from the same statement date. The third step is the division itself: $4,200,000 divided by $2,800,000 equals 1.5. Expressed as a ratio with equity set at 1, this reads as 1.5 to 1, meaning Harborline carries $1.50 of debt for every $1.00 of equity. Some analysts prefer to present the same relationship the other way around, as equity to debt, which in this case comes to roughly 0.67 to 1.
Interpreting the result requires context. A ratio of 1.5 tells us that creditors have supplied somewhat more capital than shareholders, a moderately leveraged position that is common among established manufacturers with steady cash flows. If the industry average sits near 1.2, Harborline is carrying more debt than its peers and may face higher interest costs or tighter covenants. If the average is closer to 1.8, Harborline looks conservative by comparison. It also helps to trace the ratio over several periods; a climb from 1.1 to 1.5 over three years suggests the company has been funding growth with borrowing rather than retained earnings.
Finally, consider what the ratio leaves out. It says nothing about the interest rates on the debt, the maturity schedule, or the quality of the assets backing the equity. A fuller picture emerges when the debt-to-equity ratio is read alongside interest coverage and liquidity measures, which together show whether the leverage is manageable or a source of strain.
Safe zones
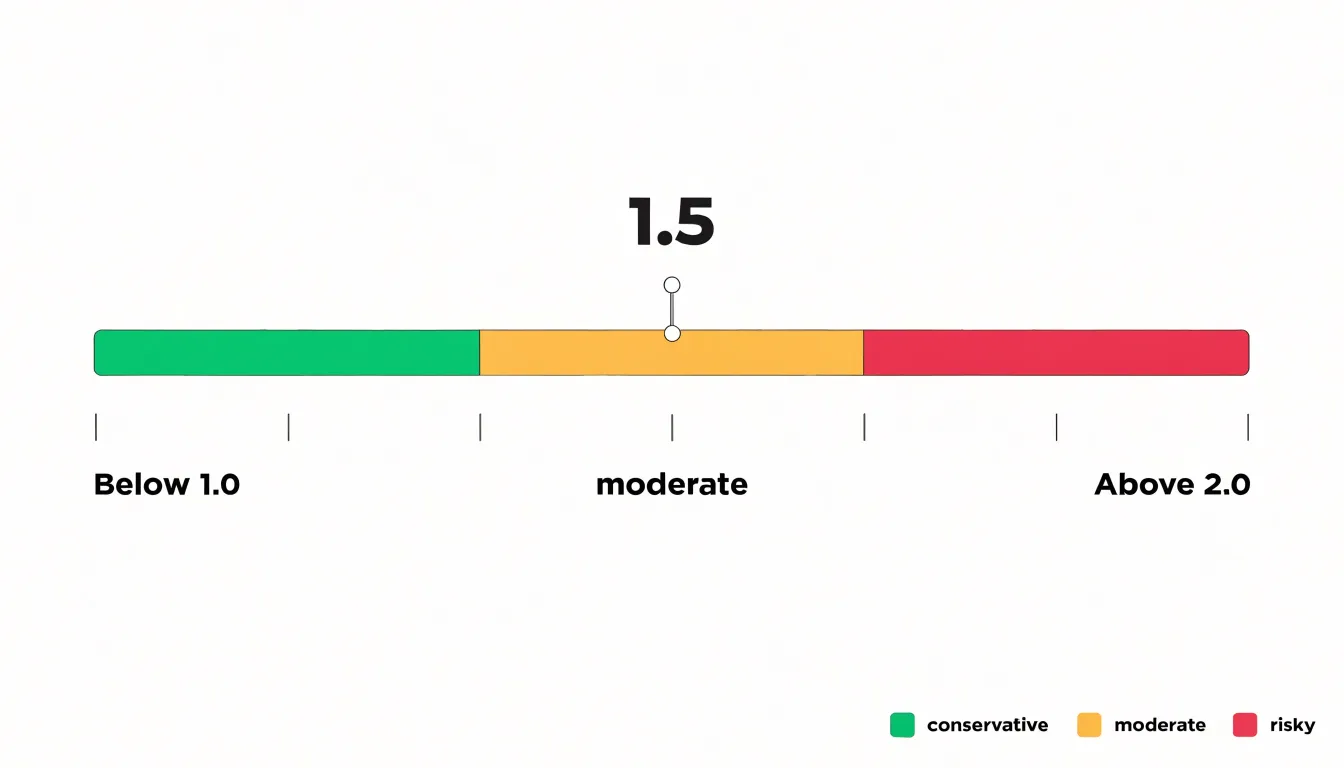
When evaluating the debt-to-equity ratio, borrowers often want a simple reference point for what counts as a healthy figure. Broad benchmarks can provide useful orientation. A ratio below 1.0 is generally considered conservative, meaning a company or individual carries less debt than equity on the balance sheet. This zone appeals to lenders and investors seeking stability, since obligations remain modest relative to owned resources and the buffer against financial shocks is wide. A ratio between 1.0 and 2.0 is commonly described as moderate: debt and equity are more balanced, and while the borrower carries meaningful leverage, it can still be manageable assuming steady cash flow. A ratio above 2.0 is typically viewed as risky, since liabilities substantially outweigh equity. At this level, lenders may demand higher interest rates, impose stricter covenants, or decline financing altogether, and a downturn in revenue can quickly strain the ability to service obligations.
These thresholds function as general guideposts rather than fixed rules. The meaning of any ratio depends heavily on context. Capital-intensive industries such as utilities or manufacturing often operate with higher debt levels as a normal part of their business model, while technology or service firms tend to run leaner. A company’s stage of growth also matters: an expanding business may deliberately take on debt to fund investment, and a temporarily elevated ratio could reflect a strategic choice rather than distress. The nature of the debt itself is another consideration, since low-interest, long-maturity obligations weigh less heavily than short-term, high-cost borrowing. Cash flow stability, asset quality, and the broader economic environment all influence how a given ratio should be interpreted. For these reasons, borrowers should treat the benchmarks as a starting point for analysis, comparing their ratio against industry peers and their own historical trends before drawing conclusions about financial health.
Why ideal leverage targets shift across different industries
Ideal leverage targets vary meaningfully across industries, and this variation reflects differences in business models, asset structures, and cash flow patterns rather than arbitrary preferences. Capital-intensive industries such as utilities, telecommunications, and heavy manufacturing typically operate with higher debt-to-equity ratios because their operations depend on large, long-lived physical assets like power plants, transmission networks, factories, and machinery. These assets are expensive to build but tend to generate steady, predictable revenue streams over many years. That predictability gives lenders confidence and allows firms to service larger debt loads. Regulated utilities, in particular, often carry debt ratios that would appear alarming in other sectors, yet their stable rate structures and essential-service demand make such leverage manageable and even efficient, since debt financing can lower the overall cost of capital when compared with issuing additional equity.
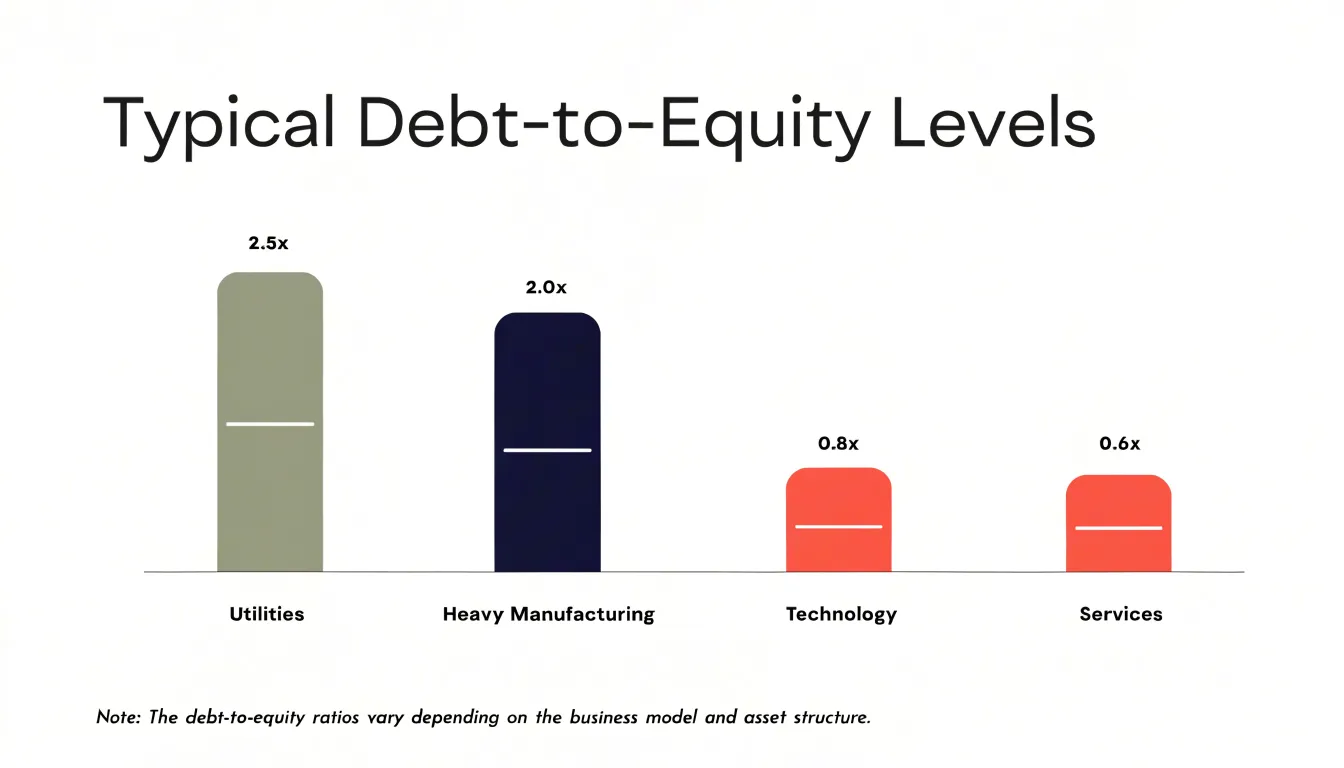
Technology and services firms present a different profile. Their core assets are often intangible, such as software, intellectual property, brand value, and human talent, which are harder to pledge as collateral and can lose value quickly if market conditions shift. Revenue can be more volatile, particularly for early-stage or fast-growing companies whose cash flows are reinvested into expansion. As a result, these firms typically favor lower debt levels and rely more heavily on equity financing. A debt ratio that signals prudent management in a manufacturing company might indicate excessive risk in a software startup, and vice versa.
Because of these structural differences, comparing a company’s debt-to-equity ratio against a broad market average or against firms in unrelated sectors can produce misleading conclusions. A utility judged by technology-sector standards might appear dangerously overleveraged, while a tech firm measured against utility norms might seem unnecessarily conservative. Meaningful analysis requires benchmarking within the same industry, where companies face similar capital requirements, asset bases, competitive dynamics, and regulatory environments. Industry-specific norms provide a realistic frame of reference for assessing whether a given company’s leverage is aggressive, moderate, or conservative relative to its peers. Analysts who account for these sector distinctions can better interpret what a leverage ratio actually says about financial health and strategic positioning.
How lenders evaluate your score during credit decisions
When a lender reviews a credit application, the debt-to-equity ratio serves as a key input in the underwriting process. Most credit scoring models incorporate this ratio to gauge a borrower’s leverage and repayment capacity. The ratio compares total liabilities to shareholders’ equity, offering a snapshot of how much of the business is financed by debt versus owner funds. Lenders use this metric to assess risk: a higher ratio suggests greater reliance on borrowed money, which can signal potential difficulty in meeting obligations during economic downturns.
Each lender sets its own thresholds for the debt-to-equity ratio, often varying by industry and loan type. For instance, banks might require a ratio below 2.0 for commercial loans, while venture debt lenders may accept higher ratios for high-growth startups. These thresholds are not arbitrary; they reflect the lender’s risk appetite, regulatory requirements, and historical loss data. Lenders also consider the trend of the ratio over time—a declining ratio may be viewed favorably, indicating improving financial health.
The debt-to-equity ratio is rarely evaluated in isolation. Lenders examine a range of other factors alongside it. Cash flow stability is paramount; consistent operating cash flow demonstrates the ability to service debt. Profit margins and revenue growth provide context for the ratio, showing whether the business can generate sufficient earnings to reduce leverage. Collateral quality and coverage also matter, as secured loans may allow for higher ratios. Additionally, lenders review management experience, industry conditions, and the borrower’s credit history. For startups, they might look at investor support and burn rate. The interplay of these factors means that a slightly elevated debt-to-equity ratio might be offset by strong cash flow or substantial collateral.
Ultimately, the debt-to-equity ratio is one piece of a broader credit assessment. Lenders use it to frame their analysis, but they combine it with qualitative and quantitative factors to make a holistic decision. Understanding how lenders interpret this ratio and the thresholds they apply can help borrowers better prepare their financial statements and negotiate favorable terms.
Clear steps to reduce your debt to equity ratio effectively
A clear, step-by-step approach makes it easier to bring your debt-to-equity ratio down without disrupting day-to-day operations. Begin by measuring the ratio accurately, then assemble a complete list of liabilities and equity components so you know exactly which numbers you are working with. From there, build a reduction plan that combines several levers at once, since relying on a single tactic usually takes far longer to show results.
The most direct lever is paying down debt. Prioritize obligations with the highest interest rates first, as this reduces both the balance and the ongoing interest burden that eats into cash flow. Where possible, use surplus cash or asset sales to retire balances early, and check whether any loans carry prepayment penalties before committing. Setting a fixed monthly amount dedicated to debt reduction turns this from an occasional effort into a predictable routine that steadily shrinks the numerator of the ratio.
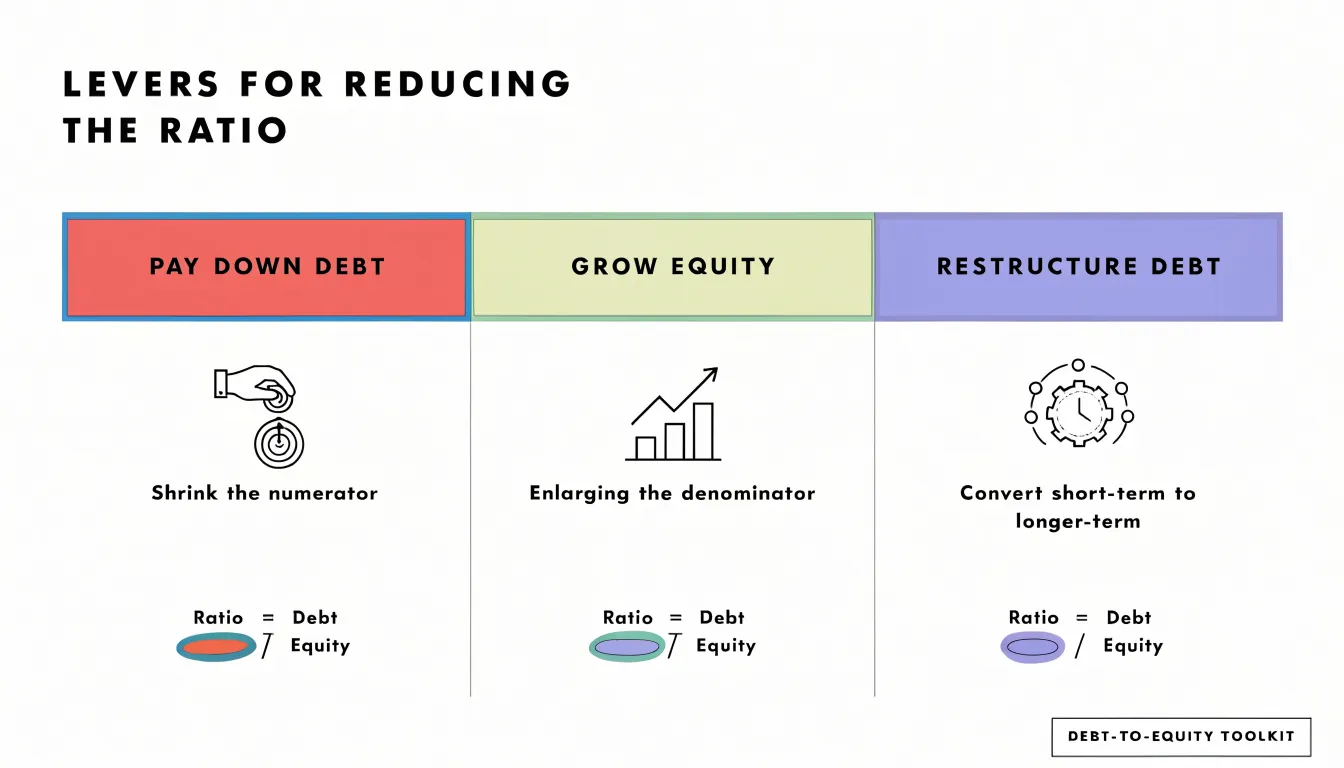
The second lever is growing equity. Retaining more profit instead of distributing it adds directly to the equity base, and shareholders are often receptive when the goal is a healthier balance sheet. Bringing in new capital works as well, whether through issuing shares, attracting a strategic investor, or securing an equity injection from current owners. Each of these steps raises the denominator, which improves the ratio even when debt levels stay constant.
The third lever is restructuring what you already owe. Converting short-term debt into longer-term facilities reduces refinancing pressure and can lower required repayments. Negotiating lower interest rates or extended terms frees up cash that can be redirected toward repayment. In some cases, debt-for-equity swaps allow creditors to convert obligations into ownership stakes, cutting liabilities and boosting equity in a single transaction.
Finally, review progress quarterly against a written target, and adjust the mix of tactics as cash flow and market conditions change. Documenting each step keeps lenders and investors informed and demonstrates disciplined financial management.
Frequently Asked Questions
What does a high debt-to-equity ratio say about a company?
It means a larger share of the company’s asset base has been funded by creditors rather than owners, so the business depends more on borrowed money. The article notes that a high ratio is a mixed message and needs context, such as industry norms and cash flow stability, to interpret.
How is the debt-to-equity ratio calculated?
Divide total liabilities by total shareholders’ equity. In the article’s example, $4.2 million in liabilities divided by $2.8 million in equity equals 1.5, or 1.5 to 1.
What is considered a healthy debt-to-equity ratio?
The article describes below 1.0 as generally conservative, 1.0 to 2.0 as moderate, and above 2.0 as typically risky. It says these are general guideposts, not fixed rules, and should be interpreted against industry peers and historical trends.
Why do utilities and manufacturers often have higher debt-to-equity ratios?
They are capital-intensive and depend on large, long-lived physical assets that tend to generate steady, predictable revenue, which gives lenders confidence. Technology and services firms often favor lower debt because their assets are more intangible and revenue can be more volatile.
How do lenders use the debt-to-equity ratio when reviewing a credit application?
Lenders use it as a key input in underwriting to gauge leverage and repayment capacity, and thresholds vary by industry and loan type. They rarely evaluate it alone and also consider factors such as cash flow stability, profit margins, collateral, management experience, and credit history.
How can a company lower its debt-to-equity ratio?
The article recommends combining levers: paying down debt, especially highest-interest obligations first; growing equity by retaining profit or bringing in new capital; and restructuring debt into longer-term or lower-cost facilities. It also suggests reviewing progress quarterly against a written target and adjusting tactics as conditions change.