
EBITDA
EBITDA is a financial metric that measures a company’s core operating profitability by adding interest, taxes, depreciation, and amortization back to net income. It strips out financing, accounting, and tax effects to allow comparison across companies, but it ignores capital expenditures and real cash costs, so it should be read alongside cash flow metrics.
Table of Contents
- What earnings before interest taxes depreciation and amortization actually measures
- How to calculate EBITDA using the standard formula from your income statement
- Why fast growing companies prefer showing EBITDA instead of net income
- Operating cash flow versus EBITDA
- How ignoring capital expenditures creates a false sense of profitability
- Adjusted EBITDA
- What Warren Buffett and top financial critics say about the metric
- Famous corporate collapses where inflated metrics masked underlying debt
- Smart ways to evaluate business health without relying solely on EBITDA
What earnings before interest taxes depreciation and amortization actually measures
Earnings before interest, taxes, depreciation, and amortization, commonly known as EBITDA, is a widely used financial metric that aims to capture a company’s core operating performance by stripping away the effects of financing, accounting, and tax decisions. Each component of the acronym represents a distinct layer of costs that are excluded to isolate the earnings generated from day-to-day operations.
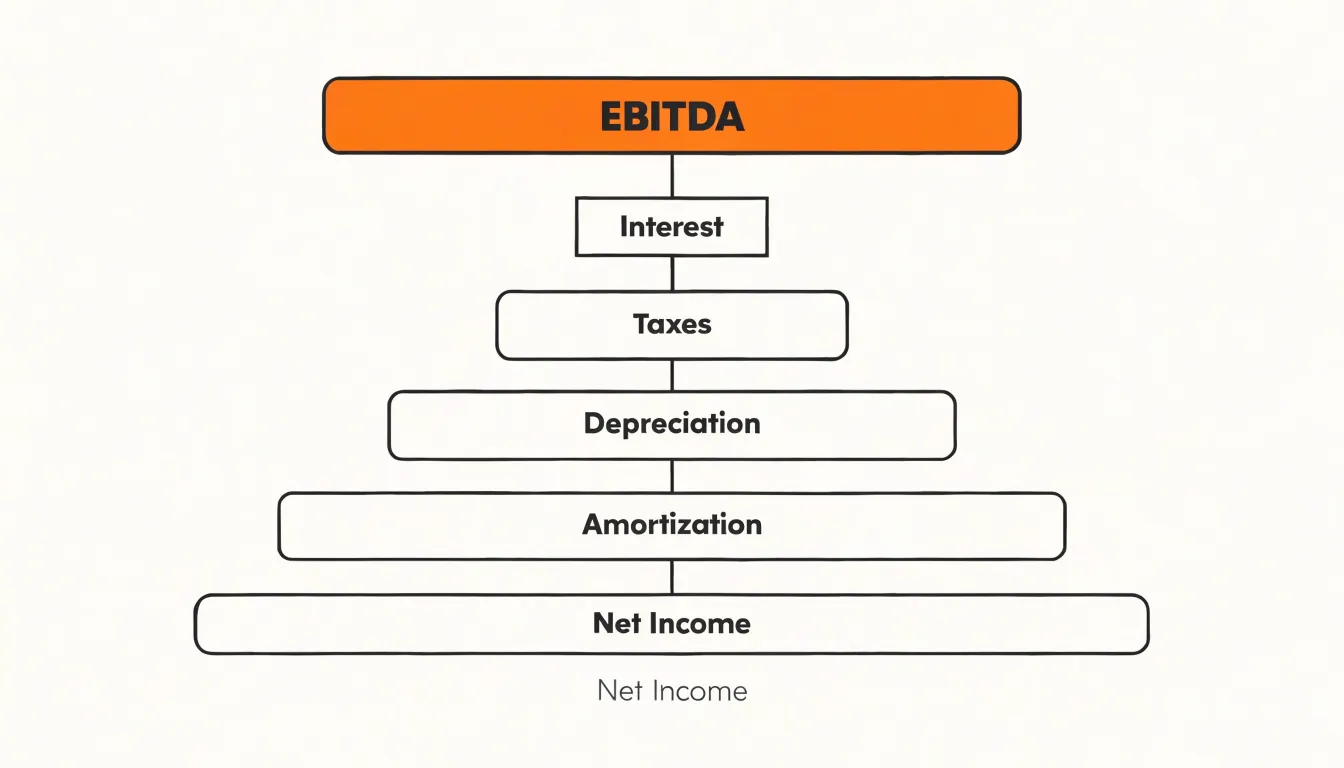
Interest is excluded because it reflects the cost of financing the business—how the company has chosen to raise capital through debt. By removing interest, EBITDA allows for a comparison of companies with different capital structures, focusing solely on operational profitability. Taxes are also excluded since they vary by jurisdiction and are influenced by tax planning strategies, which are not directly related to operating efficiency. Depreciation and amortization are non-cash expenses that allocate the cost of long-term assets over their useful lives. Depreciation applies to tangible assets like machinery and buildings, while amortization applies to intangible assets such as patents and goodwill. These charges can differ significantly based on accounting policies and asset acquisition history, obscuring the underlying cash generation from operations.
The resulting figure—EBITDA—therefore represents the earnings a company generates from its core business activities before the impact of financing decisions, tax environments, and non-cash accounting charges. It is often used as a proxy for operating cash flow, though it does not account for changes in working capital or capital expenditures. Investors and analysts value EBITDA because it provides a clearer view of operational performance across companies and industries, especially those with heavy capital investments. It helps in assessing profitability trends, comparing operational efficiency, and valuing businesses on a consistent basis. However, EBITDA has limitations: it can exaggerate financial health by ignoring real costs like interest and taxes, and it may not reflect the cash needed to maintain asset bases. Despite these caveats, EBITDA remains a key tool for understanding how well a company’s core operations are performing, independent of external factors and accounting choices.
How to calculate EBITDA using the standard formula from your income statement
To calculate EBITDA from an income statement, start with the figure that appears on the last line of the statement: net income. Net income already reflects every expense the company recorded during the period, including interest, taxes, depreciation, and amortization, so the calculation works by adding those four items back to reach a cleaner measure of operating profitability. Locate net income first, then find the interest expense line, which is typically reported below operating income and labeled as interest expense or finance costs. Add that figure back. Next, add back income tax expense, which appears near the bottom of the statement after pre-tax income. Then locate depreciation and amortization, which may be disclosed as separate lines, combined into a single line, or buried within cost of goods sold and operating expenses; in that case, check the cash flow statement, where depreciation and amortization are always broken out as non-cash adjustments. Adding all four items to net income produces EBITDA.
A simple example illustrates the mechanics. Suppose a company reports net income of $500,000. Its income statement shows interest expense of $100,000, income tax expense of $150,000, and depreciation and amortization of $250,000. Adding these back gives $500,000 + $100,000 + $150,000 + $250,000, for EBITDA of $1,000,000.
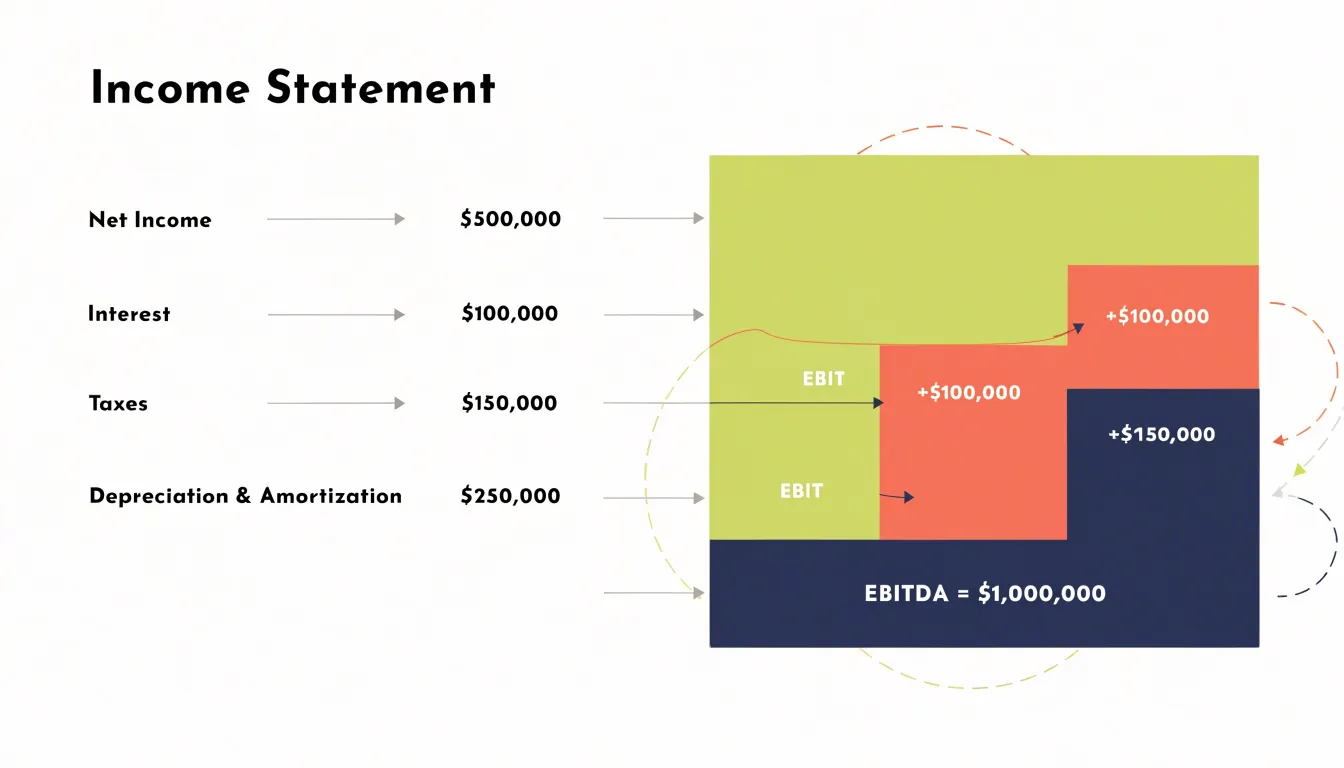
The same result can be reached from the top of the operating section. Start with operating income, also called EBIT, which appears after operating expenses but before interest and taxes. Because operating income already excludes interest and taxes, only depreciation and amortization need to be added back. In the example above, operating income would be $750,000, and adding the $250,000 of depreciation and amortization yields the same $1,000,000 EBITDA. Both routes converge on the same number, and choosing between them usually depends on which line items are most clearly disclosed in a given set of financials. Working from operating income tends to be quicker when depreciation and amortization are reported separately, while working from net income is useful when the statement presents a single, clearly itemized bridge from the bottom line. Whichever path you take, document each add-back so the calculation can be traced and audited.
Why fast growing companies prefer showing EBITDA instead of net income
Fast growing companies often prefer to present EBITDA rather than net income because the metric aligns with the story they want investors to see: a business whose core operations are scaling successfully even as the accounting consequences of that scale-up weigh on the bottom line. When a company is expanding rapidly, it typically invests heavily in new facilities, equipment, technology platforms, and infrastructure before those assets begin generating returns. Depreciation and amortization capture the cost of those investments on a scheduled basis, and in a high-growth phase the resulting charges can be substantial. By adding them back, EBITDA lets management direct attention to the operating profit generated by day-to-day activities, separating the economics of the business from the bookkeeping effects of how it financed its expansion.
This matters because rapid growth often comes with front-loaded expenses that are timing-related rather than signs of operational weakness. A firm that opens dozens of locations or builds out a large fleet will record depreciation on those assets immediately, even though the revenue they produce arrives later. EBITDA highlights the progress being made at the operating level, showing whether the underlying business is generating margin as it grows. For investors evaluating a company in the middle of a heavy investment cycle, that can be a more informative signal of momentum than net income, which may look depressed or even negative precisely because the company is investing for the future.
The presentation also shapes how investors perceive the company’s trajectory. EBITDA is widely used in valuation multiples and lending covenants, so a strong EBITDA figure supports a more favorable narrative about profitability, scalability, and cash-generating potential. Management teams can point to improving EBITDA margins as evidence that unit economics are working and that growth is translating into operating leverage. This helps the company attract capital, negotiate financing, and build confidence among shareholders who are focused on the long-term payoff of current spending. The metric effectively reframes near-term accounting costs as a temporary feature of an ambitious growth strategy, presenting a picture of operational health that supports the company’s expansion story.
Operating cash flow versus EBITDA
Operating cash flow and EBITDA both aim to capture the core earning power of a business, yet they travel through very different accounting terrain and therefore tell investors different stories. EBITDA starts with net income and adds back interest, taxes, depreciation, and amortization. It is an accrual figure: revenue is recognized when earned and expenses when incurred, regardless of when cash actually changes hands. Operating cash flow, by contrast, begins with net income but then adjusts for non-cash items and, crucially, for movements in working capital such as receivables, inventory, and payables. The result is a figure that reflects the actual dollars flowing into and out of the business from its operations during the period.
The working capital adjustment is where the two metrics diverge most sharply. A company can report healthy EBITDA while tying up enormous sums in unpaid customer invoices or swelling inventory, leaving operating cash flow far behind. Investors who track only EBITDA may miss the warning signs of a business that books profits but struggles to collect them. Because operating cash flow is anchored to bank-account reality, it is considerably harder to manipulate. Management has discretion over depreciation schedules and add-back assumptions, which can flatter EBITDA, but cash receipts and payments leave a factual trail that is difficult to dress up.
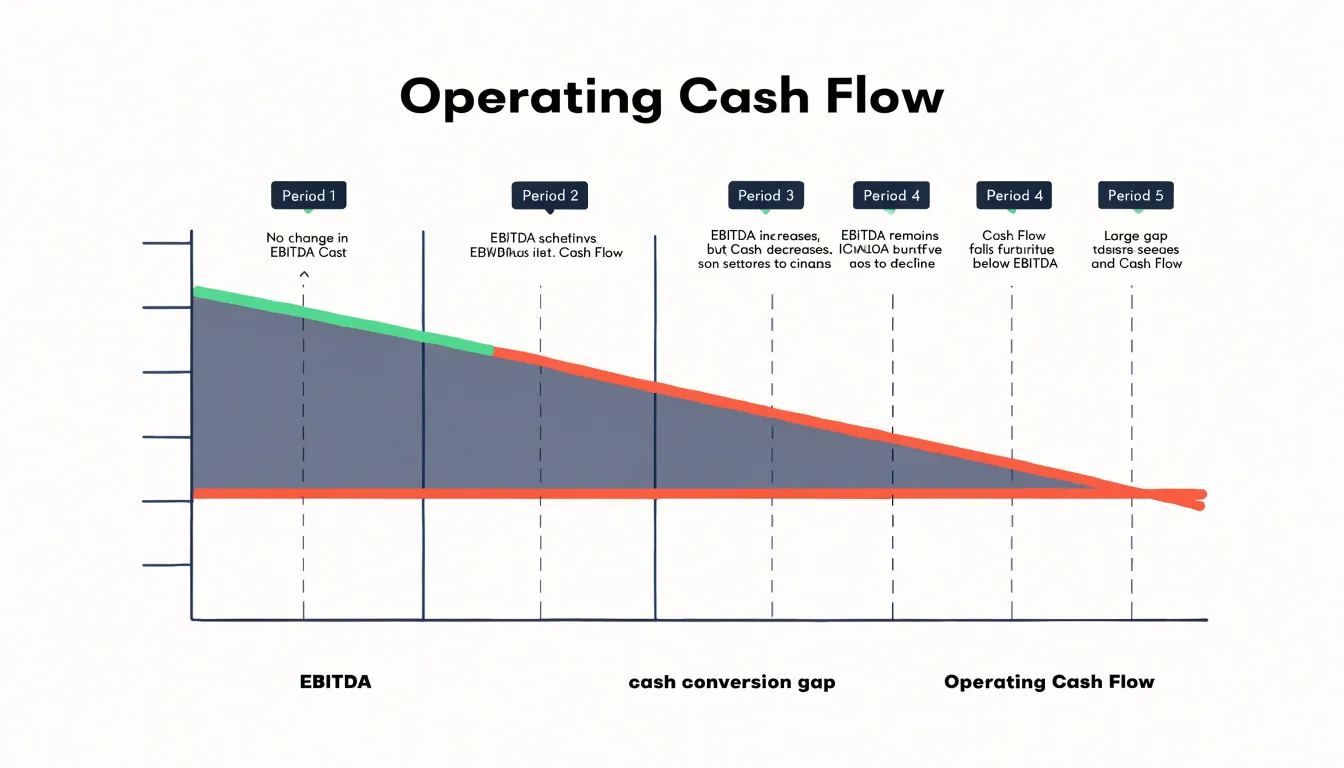
Each metric also signals different things. EBITDA is useful for comparing the operating profitability of companies with different capital structures, tax positions, and asset bases, and it remains a common yardstick in valuation and debt covenant analysis. It gives a clean view of how much a business generates before financing and accounting decisions. Operating cash flow, meanwhile, signals whether those earnings are being converted into real liquidity that can fund debt service, capital expenditure, dividends, and reinvestment. A persistent gap between strong EBITDA and weak operating cash flow often points to deteriorating collection practices, inventory build-ups, or aggressive revenue recognition.
For a well-rounded view, investors should track both metrics side by side over several periods, watching the trend in the ratio between them. Cash conversion consistently below EBITDA over time deserves scrutiny, while operating cash flow that keeps pace or exceeds EBITDA suggests genuine earnings quality. Reading the two together gives a fuller picture of profitability and the cash reality behind it.
How ignoring capital expenditures creates a false sense of profitability
EBITDA—earnings before interest, taxes, depreciation, and amortization—is often used as a proxy for cash flow, but its exclusion of capital expenditures (capex) can create a misleading picture of a company’s profitability. Capex represents the funds a company uses to acquire, upgrade, and maintain physical assets such as property, plants, and equipment. By ignoring these outlays, EBITDA can overstate a company’s true cash-generating ability, particularly for capital-intensive businesses like manufacturing, telecommunications, and utilities, where ongoing investment in assets is essential to sustain operations.
For these companies, capex is not a discretionary expense; it is a recurring necessity. Machinery wears out, technology becomes obsolete, and facilities require upgrades. Depreciation and amortization are accounting allocations that spread the cost of these assets over their useful lives, but they do not capture the actual cash spent. EBITDA adds back depreciation and amortization, effectively treating capex as if it were free. In reality, a company must continually reinvest in its asset base to maintain production capacity and competitiveness. When capex is substantial, EBITDA can significantly exceed the cash flow available to investors.
The consequence is a false sense of profitability. A company might report strong EBITDA growth while its free cash flow—the cash left after capex—remains weak or even negative. Investors who focus solely on EBITDA may overlook the need for continuous capital investment and overestimate the company’s ability to generate cash for dividends, debt repayment, or growth initiatives. This can lead to mispricing of the company’s shares and poor investment decisions.
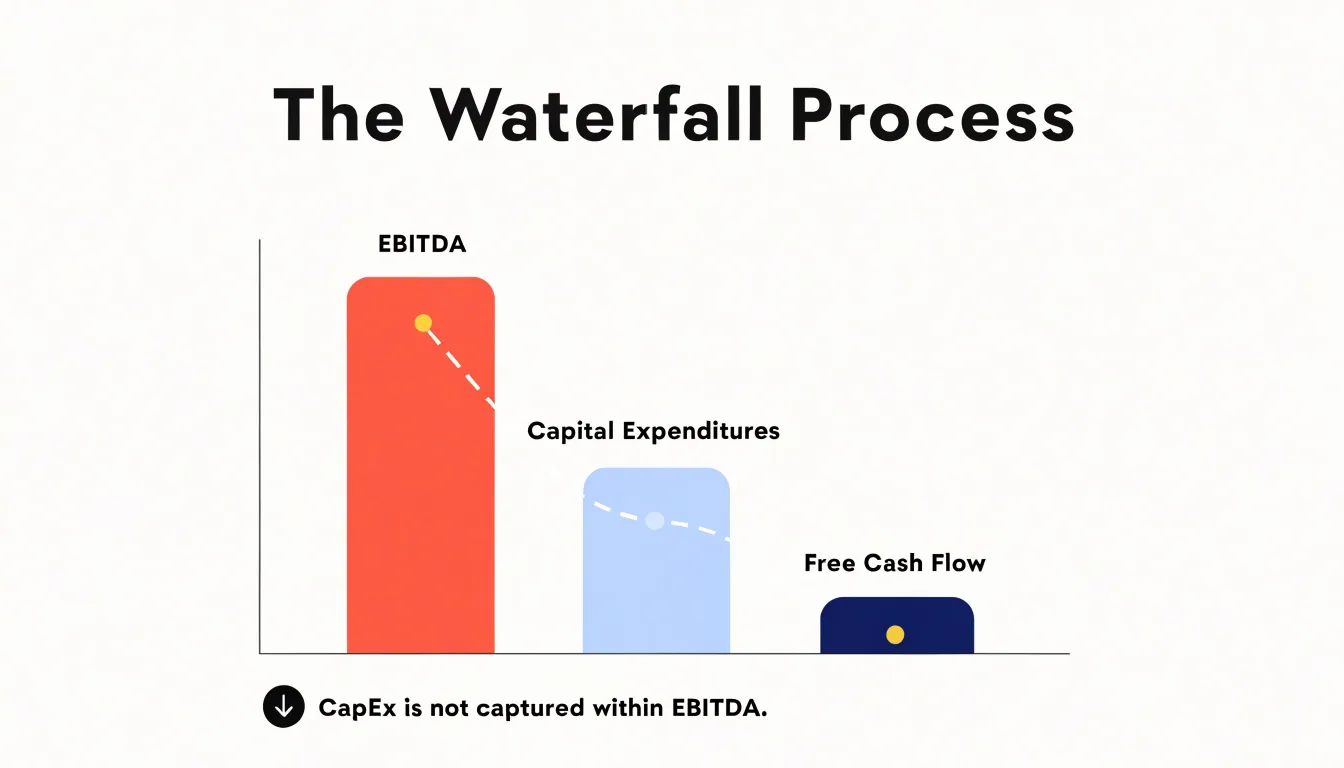
Moreover, capital-intensive businesses often have high fixed costs and long asset lives, making capex lumpy and unpredictable. EBITDA smooths over these fluctuations by excluding capex entirely, presenting a stable earnings figure that may not reflect the cash realities. In periods of heavy investment, EBITDA can paint a rosy picture while cash flow suffers. Conversely, in periods of underinvestment, EBITDA may look healthy even as the asset base deteriorates, jeopardizing future earnings.
For investors, the key is to recognize that EBITDA is a starting point, not an end. It should be used alongside cash flow metrics that account for capex, such as free cash flow, to gain a realistic understanding of a company’s financial health. Ignoring capex can lead to an inflated view of profitability and a misallocation of capital.
Adjusted EBITDA
Adjusted EBITDA represents a company’s reported EBITDA after management applies its own custom modifications, and the practice has become widespread enough that investors now scrutinize these adjustments closely. The core concern is straightforward: when a company adds back an expense it labels non-recurring, it removes that cost from the profitability picture it presents to the market. The trouble arises when the same supposedly one-time add-backs appear quarter after quarter, year after year, which suggests the expense is embedded in how the business actually operates rather than an anomaly worth excluding.
Stock-based compensation is among the most common and most debated examples. Companies frequently add it back on the argument that it is a non-cash charge, yet compensation paid in shares remains a genuine economic cost that dilutes existing shareholders. When a company issues equity to employees every year without fail, treating that expense as a one-time item stretches the definition of one-time. Restructuring charges tell a similar story. A business that reorganizes, closes facilities, or eliminates positions in nearly every reporting period has effectively made restructuring a recurring line item, even if each individual program carries a distinct label.
Other recurring add-backs follow the same pattern: acquisition-related costs for serial acquirers, litigation expenses for companies facing regular legal disputes, and various impairment charges that surface with predictable frequency. Each adjustment may be defensible in isolation, and management typically provides detailed reconciliations with explanations for every line. The cumulative effect, however, can be material, sometimes transforming a modest adjusted profit into a reported figure that flatters the underlying economics.
For analysts and investors, the practical discipline is to track add-backs across multiple periods and ask whether an item labeled exceptional has in fact appeared consistently. Comparing adjusted EBITDA against unadjusted EBITDA and against cash flow from operations helps reveal whether the adjustments reflect genuine one-time events or a persistent gap between the story management tells and the expenses the business truly incurs. Adjusted EBITDA can be informative when used honestly, but its flexibility makes it a favored tool for smoothing over costs that recur.
What Warren Buffett and top financial critics say about the metric
Warren Buffett has been among the most vocal skeptics of EBITDA, and his remarks have shaped the broader critique of the metric. In Berkshire Hathaway’s 2000 shareholder letter, Buffett wrote that references to EBITDA make him shudder, arguing that depreciation is a real expense and that it is “clearly a cost” regardless of how analysts choose to present it. He has returned to this theme repeatedly, warning that managers who lean on EBITDA are often trying to distract investors from genuine costs, particularly capital expenditures required to keep a business running. Buffett’s broader point is that depreciation represents the wear and tear on equipment and facilities that must eventually be replaced with cash, so excluding it from a profit measure misrepresents the economics of a capital-intensive business.
Charlie Munger shared this skepticism and was characteristically blunt about it. He considered EBITDA a misleading abstraction that flatters companies with heavy capital needs, and he often grouped it with other adjusted earnings measures he regarded as wishful thinking. Munger’s view reflected a lifelong insistence that owners should focus on true cash generation after accounting for the reinvestment a business requires.
Other financial experts have echoed these concerns. Accounting scholars and investment analysts note that EBITDA ignores depreciation, interest, taxes, and sometimes other genuine expenses, which can make a struggling company with aging equipment appear healthier than it is. Critics warn the metric is especially dangerous in capital-intensive industries such as telecommunications, airlines, manufacturing, and utilities, where depreciation reflects substantial real spending. Because EBITDA is not a standardized measure under generally accepted accounting principles, companies enjoy wide latitude in constructing their own versions, a flexibility that invites manipulation. Adding back stock-based compensation, restructuring charges, and other recurring items has led some commentators to nickname the result “EBITDA-ish” earnings, implying the figure barely resembles genuine profitability. The common thread in these critiques is that EBITDA can obscure the cash a business must spend simply to keep operating, and investors who rely on it without scrutiny may overpay for companies whose reported strength does not survive contact with their capital expenditure requirements.
Famous corporate collapses where inflated metrics masked underlying debt
Several high-profile corporate collapses illustrate how inflated metrics can obscure unsustainable debt and lead to sudden failure. Enron, once a darling of the energy sector, used complex financial structures and aggressive accounting to keep billions of dollars of debt off its balance sheet. Through special purpose entities, the company hid liabilities while reporting robust EBITDA-like figures that portrayed a picture of financial health. When the truth emerged, the company’s stock plummeted, and it filed for bankruptcy in 2001, wiping out shareholder value and underscoring the dangers of relying on metrics that ignore off-balance-sheet obligations.
WorldCom, the telecommunications giant, engaged in massive accounting fraud by capitalizing expenses that should have been recorded as operating costs. This manipulation inflated EBITDA and created the illusion of profitability and growth. In reality, the company was burdened with enormous debt from acquisitions and declining revenues. The fraud masked the true financial distress, and when the bubble burst, WorldCom filed for the largest bankruptcy in U.S. history at the time, in 2002. The case highlights how inflating EBITDA by reclassifying expenses can hide a company’s inability to service its debt.
Lehman Brothers, the investment bank whose failure triggered the 2008 financial crisis, used accounting tricks such as Repo 105 transactions to temporarily remove assets and liabilities from its balance sheet at quarter-end. These moves improved leverage ratios and presented a stronger financial position than actually existed. While EBITDA is less central for banks, the broader principle applies: by obscuring the true extent of leverage, Lehman masked its vulnerability to a downturn in the housing market. When the market lost confidence, the firm collapsed under the weight of its debts.
These case studies share a common thread: metrics that were manipulated or selectively presented to hide debt and create an overly optimistic picture. In each case, the inflated figures delayed reckoning but ultimately led to catastrophic failure, harming employees, investors, and the broader economy. They serve as stark reminders that EBITDA and similar measures can be dangerous when used to obscure rather than illuminate a company’s financial obligations.
Smart ways to evaluate business health without relying solely on EBITDA
Evaluating business health calls for a portfolio of measures, each illuminating a different facet of performance that a single earnings figure can obscure. Free cash flow offers a grounded starting point. It captures the cash a company generates after accounting for capital expenditures, showing whether operations actually fund reinvestment, debt service, and distributions. A business can report healthy EBITDA while consuming cash through heavy capital spending or working capital swings, and free cash flow surfaces that reality. Tracking it across several periods reveals whether cash generation is stable, improving, or deteriorating, and comparing it with reported earnings highlights gaps worth investigating.
Net income provides the bottom-line result after interest, taxes, depreciation, and amortization, reflecting the costs that EBITDA deliberately sets aside. Persistent differences between EBITDA and net income often trace to heavy debt loads or aggressive depreciation, both of which carry real economic weight. Examining net income alongside revenue growth and margin trends gives a clearer sense of whether profitability is genuine and durable.
Debt ratios add the dimension of financial resilience. Measures such as net debt to EBITDA, interest coverage, and the current ratio show how comfortably a company can meet obligations and absorb shocks. A firm with modest EBITDA but low debt and strong liquidity may be far safer than one with impressive EBITDA stretched across a leveraged balance sheet. Reviewing maturity schedules and covenant terms adds context about refinancing risk.
Qualitative analysis rounds out the picture. Management quality, competitive position, customer concentration, industry dynamics, and the reliability of accounting policies all shape the durability of financial results. Reading the notes to the financial statements, watching for changes in revenue recognition or capitalization practices, and understanding the business model help an analyst judge whether reported numbers reflect underlying reality.
Combining these approaches creates a layered view: cash flow confirms earnings quality, debt ratios test resilience, and qualitative review supplies context. Together they support more reliable conclusions about a company’s financial health than any single metric can provide on its own.
Frequently Asked Questions
What does EBITDA measure?
EBITDA measures earnings before interest, taxes, depreciation, and amortization, aiming to capture a company’s core operating performance by stripping away financing, accounting, and tax decisions. It is often used as a proxy for operating cash flow, though it does not account for changes in working capital or capital expenditures.
How do you calculate EBITDA from an income statement?
Start with net income and add back interest expense, income tax expense, and depreciation and amortization. Alternatively, start with operating income (EBIT) and add back depreciation and amortization.
Why do fast-growing companies prefer showing EBITDA instead of net income?
Fast-growing companies often prefer EBITDA because it highlights core operating progress while adding back substantial depreciation and amortization from heavy investment in assets. It is also widely used in valuation multiples and lending covenants, supporting a favorable narrative about profitability and scalability.
What is the difference between EBITDA and operating cash flow?
EBITDA is an accrual figure that adds back interest, taxes, depreciation, and amortization, while operating cash flow adjusts net income for non-cash items and movements in working capital. Operating cash flow reflects actual dollars flowing into and out of the business from operations.
Why can EBITDA be misleading for capital-intensive businesses?
EBITDA ignores capital expenditures, which can overstate a capital-intensive company’s true cash-generating ability because capex is a recurring necessity for maintaining and upgrading assets. Investors should use it alongside cash flow metrics such as free cash flow.
What is adjusted EBITDA and why is it scrutinized?
Adjusted EBITDA is reported EBITDA after management applies custom modifications, often adding back items it labels non-recurring. It is scrutinized because supposedly one-time add-backs, such as stock-based compensation or restructuring charges, can appear quarter after quarter and may reflect costs embedded in the business.