
EBITDA vs Net Income
EBITDA measures operating profit before interest, taxes, depreciation, and amortization, while net income is the bottom-line profit remaining after all expenses, interest, and taxes are deducted. EBITDA compares core operating performance across companies with different capital structures; net income shows what actually reaches shareholders. Used together, they give a fuller view of profitability.
Table of Contents
- Understanding the Core Difference Between Operational Earnings and Bottom Line Profit
- What Is EBITDA and Why Do Investors Rely on It
- Net Income Basics
- Where EBITDA Falls Short
- When Net Income Gives a Distorted Picture of Company Health
- Comparing EBITDA vs Net Income in Valuation and Debt Analysis
- How Different Industries Favor One Metric Over the Other
- Red Flags
- Which Metric Gives You the True Story of Business Profitability
Understanding the Core Difference Between Operational Earnings and Bottom Line Profit
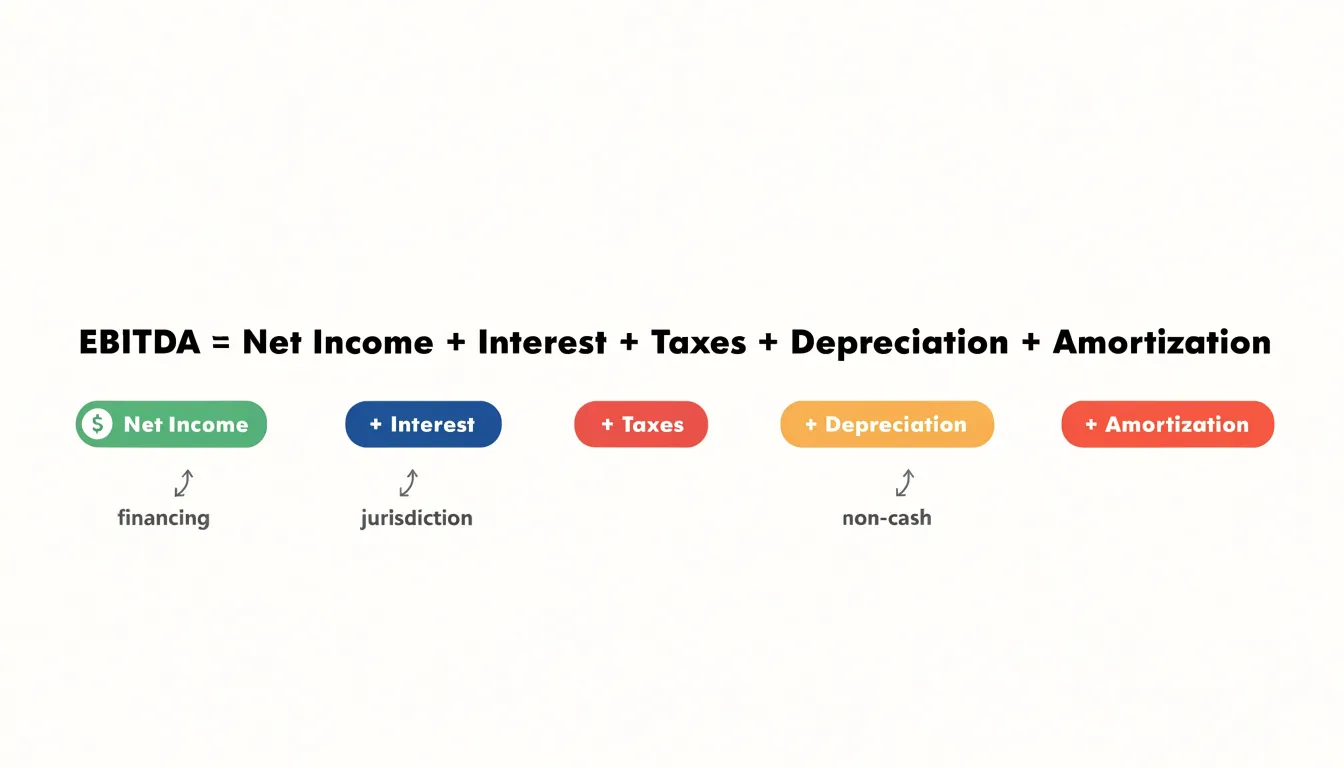
EBITDA and net income sit at different points on the income statement, and the distance between them reflects a series of deliberate accounting choices. EBITDA begins with operating profit and adds back four categories of expense: interest, taxes, depreciation, and amortization. Each add-back serves a specific purpose. Interest expense is excluded because it reflects how a company is financed rather than how it operates, meaning two businesses with identical operations but different debt loads will show different net income figures. Taxes are excluded because they vary by jurisdiction, tax planning, and prior losses carried forward, so they say little about operating efficiency. Depreciation and amortization are excluded because they are non-cash charges tied to past capital spending decisions, spreading the cost of equipment or acquired intangibles across many years. The result is a cleaner view of the cash generated by core operations before the costs of capital structure and accounting allocations enter the picture.
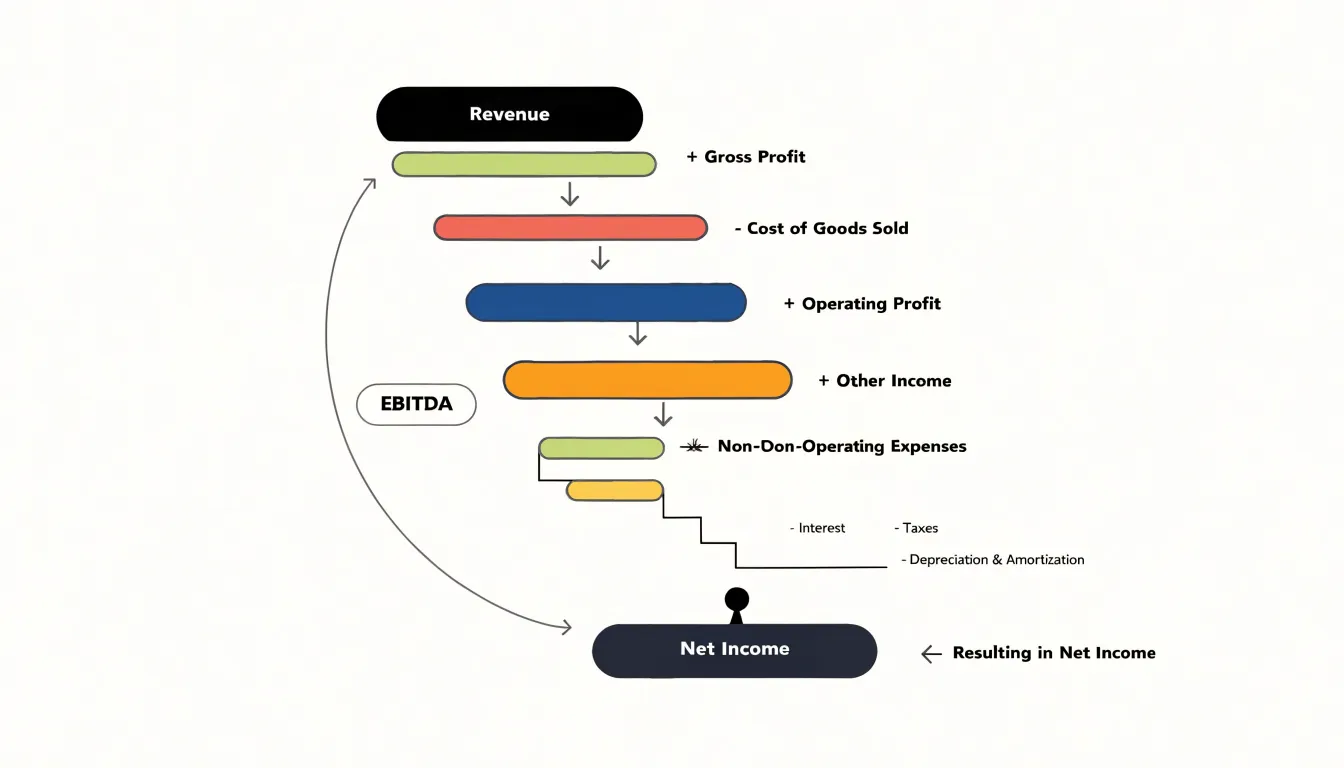
Net income, by contrast, is the bottom line after every expense has been recorded. It reflects interest paid to lenders, tax obligations to governments, and the gradual write-down of long-lived assets and acquired intangibles. It also captures items EBITDA never touches, such as gains or losses on asset sales, restructuring charges, and other one-time events. Net income is governed by generally accepted accounting principles and represents what remains for shareholders after all claims have been settled.
The practical gap between the two metrics can be substantial, particularly for capital-intensive businesses carrying heavy debt. A manufacturer with large factories will record significant depreciation, while a leveraged company will carry meaningful interest expense; together these can pull net income far below EBITDA. Analysts use EBITDA to compare operating performance across companies with different capital structures and tax situations. Lenders and investors often look to net income, and to free cash flow, when assessing actual profitability and the capacity to repay obligations or fund dividends. Reading both figures together gives a fuller picture: EBITDA isolates the engine of the business, and net income shows what ultimately reaches the bottom line after every cost is counted.
What Is EBITDA and Why Do Investors Rely on It
EBITDA stands for Earnings Before Interest, Taxes, Depreciation, and Amortization. It is calculated by starting with net income and adding back interest expense, income tax expense, depreciation, and amortization. Alternatively, it can be derived from operating income by adding back depreciation and amortization. This formula strips out expenses related to financing decisions (interest), government obligations (taxes), and non-cash accounting charges (depreciation and amortization), leaving a figure that represents a company’s operating profitability before the impact of non-operating factors.
Investors and analysts frequently use EBITDA as a proxy for cash operating profit. By excluding depreciation and amortization, which are non-cash charges, EBITDA approximates the cash generated from core operations. This makes it a useful tool for assessing a company’s ability to service debt, fund capital expenditures, and generate returns for shareholders. It also provides a cleaner view of operational performance by removing the effects of accounting policies and asset age, which can vary significantly across companies.
One of the primary reasons analysts favor EBITDA is that it facilitates comparisons across companies with different capital structures. Interest expense varies widely depending on how much debt a company carries, and tax rates differ by jurisdiction and tax planning strategies. By ignoring these factors, EBITDA allows investors to compare the operating performance of companies regardless of how they are financed or where they operate. Similarly, depreciation and amortization can differ based on acquisition history, asset useful lives, and accounting methods. Excluding these non-cash items helps isolate the profitability of business operations, making it easier to evaluate management’s operational efficiency and compare companies within the same industry.
EBITDA is also commonly used in valuation multiples, such as EV/EBITDA, and in debt covenants, where it serves as a measure of cash flow available to meet financial obligations. Its popularity stems from its simplicity and its focus on operating results, which many investors find more relevant than net income when analyzing companies with heavy capital expenditures or significant debt loads. However, it is important to note that EBITDA is not a substitute for cash flow measures, as it ignores working capital changes and capital expenditures, which are real cash outflows. Nevertheless, as a starting point for analysis and comparison, EBITDA remains a widely relied-upon metric in the investment community.
Net Income Basics
Net income sits at the bottom of the income statement, and its position reflects its role: it is the residual figure left after every other claim on revenue has been settled. The calculation begins with total revenue and subtracts operating expenses, then moves through several distinct stages. Interest on debt is deducted next, capturing the cost of borrowed capital. Taxes follow, reflecting the obligation owed to taxing authorities based on taxable profit. Depreciation and amortization are then accounted for through the operating expense section, spreading the cost of long-lived assets and intangible assets across their useful lives. The result is the profit attributable to the company’s owners after all operating costs, financing costs, tax obligations, and non-cash asset consumption have been recognized.
What net income tells you is how much of the period’s activity ultimately belongs to shareholders. It is the figure from which dividends are paid and to which retained earnings are added, so it directly feeds the equity section of the balance sheet. When analysts calculate earnings per share, they divide net income by shares outstanding, making it the primary input for the most widely quoted profitability metric in public markets. A rising net income over time signals that the business is converting revenue into owner earnings at an improving rate, while a declining figure can point to margin pressure, heavier debt service, or a rising tax burden.
The composition of net income matters as much as its size. A company can post healthy operating profit and still report weak net income if interest expense is heavy, which tells you something about its capital structure. Tax items can distort comparisons across years or jurisdictions. Depreciation and amortization reduce reported net income without consuming cash in the current period, which is why net income and cash flow frequently diverge. Understanding these components helps readers judge whether the bottom-line figure reflects sustainable earning power or one-off items such as asset sales, write-downs, or litigation settlements. In short, net income answers the question of what remains for shareholders after every cost and obligation has been counted, and it anchors valuation, dividend policy, and performance assessment across the financial statements.
Where EBITDA Falls Short
EBITDA adds back depreciation and amortization to operating profit, which means it strips out the accounting charge for long-lived assets without accounting for the cash a company actually spends to maintain and replace those assets. That distinction matters enormously in capital-intensive industries. A manufacturer running expensive production lines, a telecommunications firm maintaining a fiber network, or a railroad replacing track and locomotives must continually reinvest in physical assets simply to keep operating at the same level. These maintenance capital expenditures appear nowhere in the EBITDA figure. When capex consistently runs close to or above reported EBITDA, the company may be generating little or no free cash flow despite an impressive headline number.
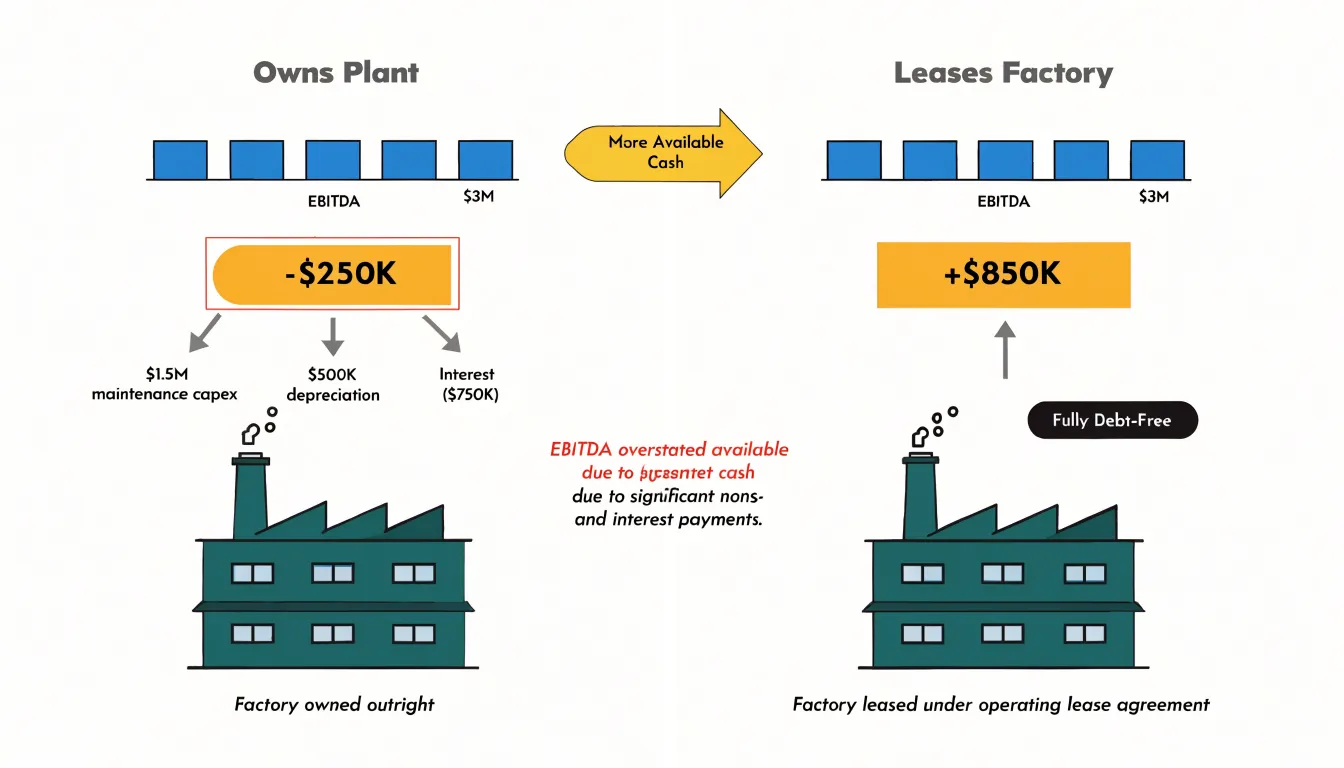
The exclusion of interest costs creates a parallel problem. EBITDA treats a company as if it carried no debt, measuring performance before financing costs are subtracted. For a highly leveraged business, interest payments can consume a substantial share of operating cash flow each year. A company reporting strong EBITDA may simultaneously be paying out a large portion of that sum to lenders, leaving thin cushions for reinvestment, dividends, or debt reduction. Lenders and credit analysts therefore rarely rely on EBITDA alone; they compare it against interest obligations through coverage ratios and against total debt through leverage multiples, precisely because the metric by itself ignores the burden of servicing borrowings.
Both exclusions share a common consequence: EBITDA can present a flattering picture of a company’s cash-generating ability that diverges sharply from the cash actually available. Two firms with identical EBITDA may face very different realities if one owns its factories and carries heavy debt while the other leases its assets and operates debt-free. The first must fund maintenance capex and interest from its operating profits; the second faces neither drain in the same form. Investors who anchor valuations on EBITDA multiples without adjusting for these obligations risk overpaying for businesses whose true cash needs are far greater than the metric suggests. EBITDA remains a useful measure of operating performance, yet it functions best as a starting point, paired with capital expenditure figures, interest expense, and free cash flow, rather than as a standalone proxy for the money a company actually keeps.
When Net Income Gives a Distorted Picture of Company Health
Net income is often treated as the bottom-line measure of a company’s profitability, yet it can present a distorted picture of ongoing operational health. One major source of distortion is one-time charges. Events such as restructuring costs, impairment write-downs, or legal settlements are recorded as expenses in the period they occur, even though they are unlikely to recur. A large charge can depress net income in one year, making a company appear less profitable than its core operations suggest. Conversely, a year without such charges can inflate net income, creating an artificially rosy view. These swings make it difficult to compare performance across periods or against peers, as the timing and magnitude of one-time items vary widely.
Tax effects further complicate the picture. Net income is reported after taxes, so changes in the effective tax rate—due to shifts in jurisdiction, credits, or deferred tax adjustments—can cause significant volatility unrelated to operational performance. For example, a company might benefit from a one-time tax credit that boosts net income, or suffer from a tax settlement that reduces it, without any change in its underlying business. Comparing net income across companies with different tax situations or across years with varying tax rates can therefore mislead analysts about relative operational efficiency.
Non-cash items also play a role. Depreciation, amortization, and stock-based compensation are expenses that reduce net income without consuming cash in the current period. While these items reflect real economic costs over time, they can obscure a company’s cash-generating ability, especially for asset-heavy businesses or those that compensate employees heavily with equity. A company with large non-cash expenses may report low net income yet generate strong cash flow, while another with minimal non-cash charges may report higher net income but weaker cash flow. This disconnect can make net income a poor proxy for operational health and liquidity.
Collectively, these factors can render net income volatile and misleading for operational comparisons. Analysts and investors seeking to understand a company’s core performance often turn to adjusted metrics that strip out these distortions, but even those adjustments require judgment. Recognizing the limitations of net income is essential for accurately assessing a company’s financial health and making informed decisions.
Comparing EBITDA vs Net Income in Valuation and Debt Analysis
EBITDA and net income each serve distinct roles in valuation and debt analysis, and understanding where each metric fits helps analysts interpret financial results more accurately. In valuation work, EBITDA multiples are among the most widely used tools for comparing companies, particularly in capital-intensive industries or during mergers and acquisitions. A firm’s enterprise value is often divided by its EBITDA to produce a multiple that can be benchmarked against peers or used to estimate the value of an acquisition target. The appeal lies in EBITDA’s position above interest, taxes, depreciation, and amortization, which allows analysts to compare operating performance across companies with different capital structures, tax situations, and accounting policies for fixed assets. Leverage ratios built on EBITDA, such as debt-to-EBITDA or net debt-to-EBITDA, are standard measures used by lenders and credit analysts to gauge how many years of operating earnings it would take to repay outstanding debt. These ratios appear frequently in loan covenants, credit agreements, and rating agency reports.
Net income plays a different but equally important part. Because it sits at the bottom of the income statement after all expenses, interest, and taxes have been deducted, net income reflects what is actually available to shareholders. Earnings-based metrics such as earnings per share and the price-to-earnings ratio depend directly on net income. EPS divides net income, adjusted for preferred dividends, by the weighted average number of shares outstanding, and it serves as a core input for investors evaluating profitability on a per-share basis. The P/E ratio takes the share price and divides it by EPS, giving a market-based view of how much investors are willing to pay for each dollar of reported earnings. These metrics carry significant weight in equity research, investor communications, and share price analysis.
In practice, the two metrics complement each other. EBITDA multiples and leverage ratios offer a view of operating performance and debt capacity that is largely independent of financing and accounting choices, while net income and its derived metrics connect directly to shareholder returns and market pricing. Analysts often examine both when building valuation models or assessing creditworthiness, using EBITDA for comparisons across companies and net income for gauging what ultimately flows to equity holders.
How Different Industries Favor One Metric Over the Other
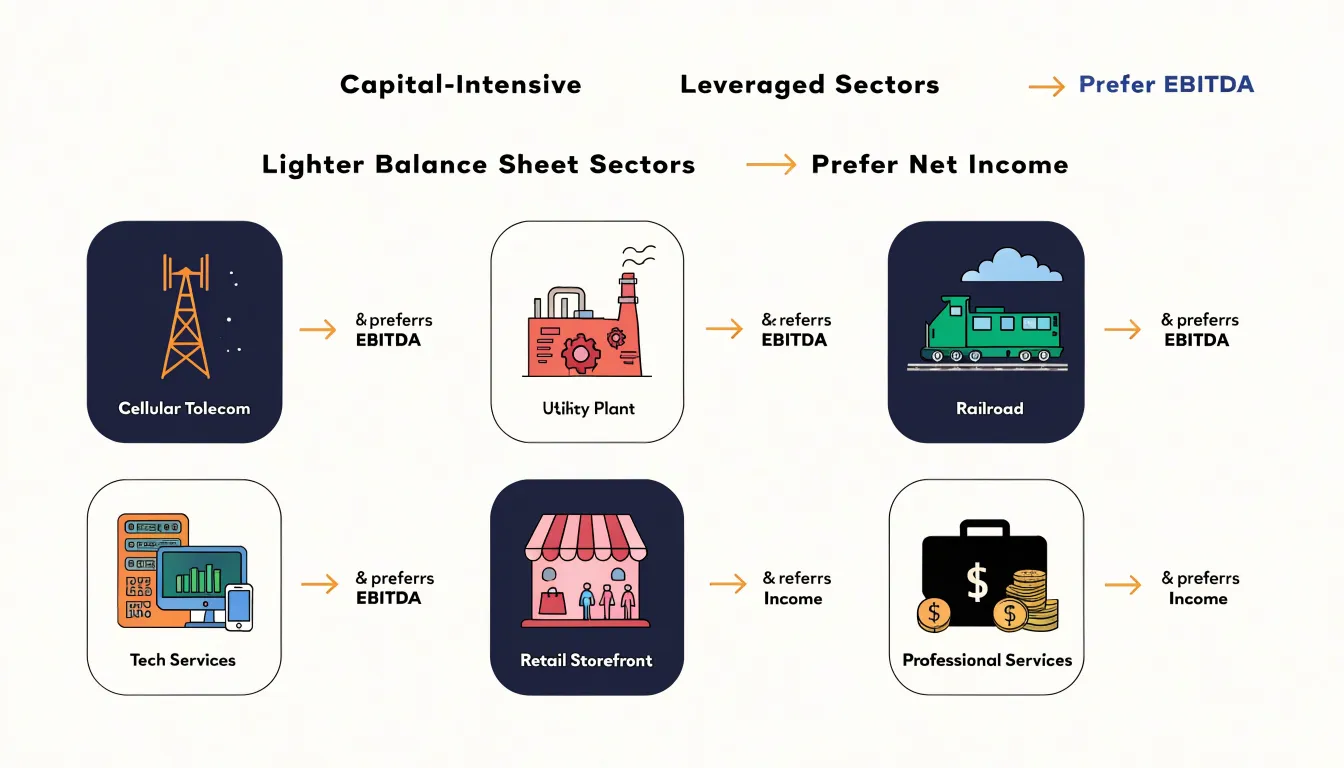
Industry context shapes which metric analysts, lenders, and managers treat as the primary lens on performance. In capital-intensive sectors such as telecommunications, utilities, transportation, and heavy manufacturing, companies carry large fixed asset bases that generate substantial depreciation charges each year. These charges reflect past investment decisions rather than current operating performance, so EBITDA becomes a practical way to compare how efficiently a telecom operator or utility is running its network or plants against peers with different vintages of equipment. When a sector is also highly leveraged, interest expense can swing widely with debt structures and refinancing terms, further obscuring underlying operational trends in net income. Lenders in these industries frequently write covenants tied to EBITDA because it approximates the cash available to service debt before financing and tax effects. Management teams use it to evaluate acquisitions and capital projects, since it isolates the earnings contribution of an asset before accounting allocations. Sectors with lighter balance sheets, by contrast, often find net income more informative. Technology services, professional firms, consumer brands, and retail businesses typically carry modest depreciation and manageable debt levels, so the gap between EBITDA and net income stays small. In these settings net income captures the full picture, including the cost of stock-based compensation, restructuring charges, and other items that EBITDA adds back. Regulated industries add another layer: utilities report both metrics because rate-setting processes often reference EBITDA-style measures while investors focus on net income and dividends. Real estate and asset-heavy partnerships frequently use EBITDA alongside funds from operations. The pattern is not rigid, and individual companies within any sector may emphasize one metric over the other depending on their capital structure and accounting profile. The practical takeaway is that the choice of metric tends to follow the economics of the industry, with EBITDA serving as a common language where depreciation and leverage are large and recurring, and net income serving that role where they are small or less relevant to the operating story.
Red Flags
EBITDA adjustments deserve close scrutiny because each add-back represents a choice management makes about what counts as a “real” expense. Run-of-the-mill adjustments for depreciation, interest, and taxes are standard. Red flags appear when the adjustment list keeps growing: recurring “one-time” restructuring charges, stock-based compensation treated as non-cash and therefore irrelevant, litigation settlements that somehow recur every year, or capitalized costs that would otherwise hit the income statement. When the same “exceptional” items appear quarter after quarter, they are operating expenses in disguise, and EBITDA is being flattered accordingly.
Rising debt alongside glowing EBITDA is a second warning sign. EBITDA excludes interest, so a company can look healthy on an EBITDA basis while its interest burden consumes an ever-larger share of operating cash flow. Watch the leverage ratio, typically net debt divided by EBITDA. When that multiple climbs even as EBITDA grows, the company may be borrowing to sustain the very earnings it reports, and the cushion between operating profit and debt service is thinning. A rising debt load combined with shrinking interest coverage tells a story that the EBITDA headline obscures.
Third, track the gap between EBITDA and net income over time. A stable, modest gap is normal. A widening gap means depreciation, interest, taxes, or unusual charges are growing faster than operating profit. Perhaps the company is capital-intensive and underinvesting in asset replacement, flattering current EBITDA at the cost of future capacity. Perhaps interest expense is ballooning. Perhaps non-recurring charges are piling up. In any case, the cash that actually reaches shareholders is shrinking relative to the operating metric management promotes.
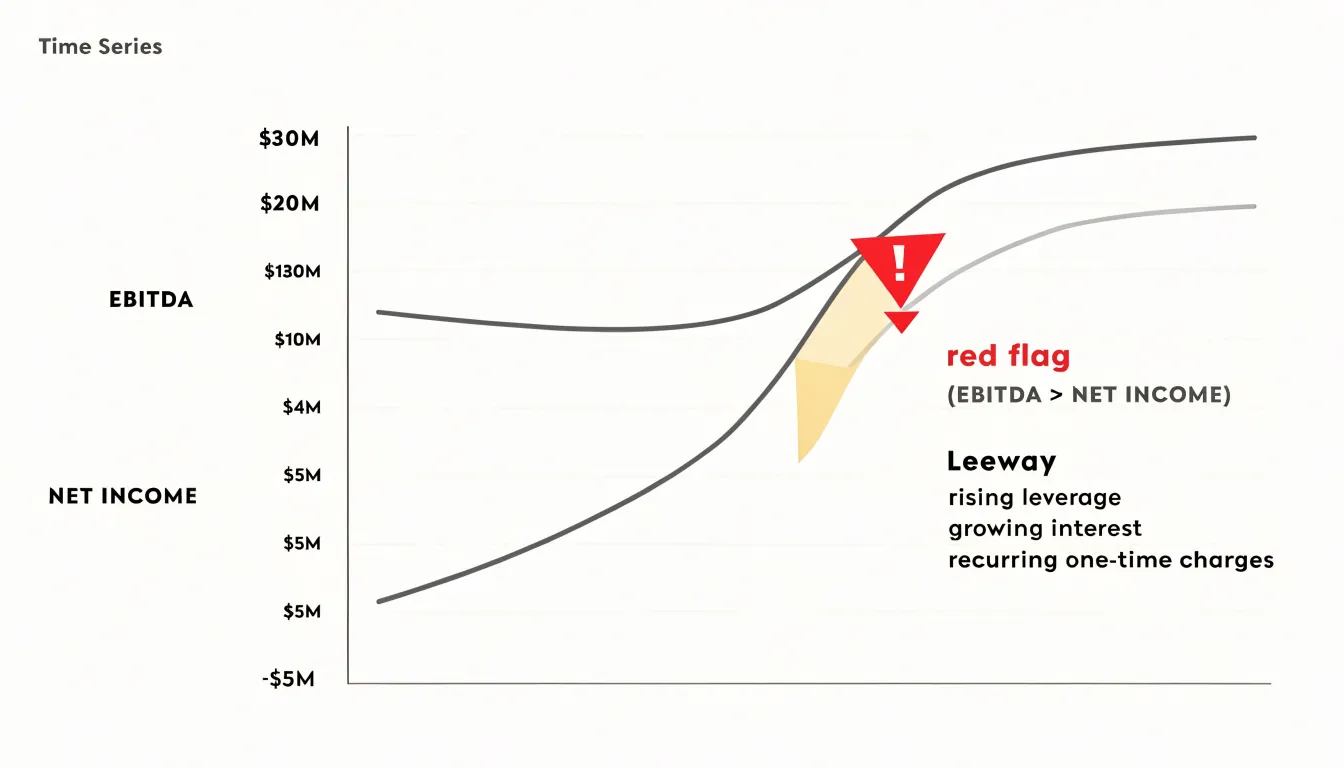
A further check involves comparing EBITDA to operating cash flow. EBITDA should roughly track cash generation once working capital and interest are accounted for. Persistent divergence, where EBITDA rises while operating cash flow stagnates or falls, suggests earnings quality problems such as aggressive revenue recognition or growing receivables. Management compensation tied to EBITDA targets adds incentive to exploit these levers. Investors who read the reconciliation schedule line by line, track leverage trends, and compare EBITDA against cash flow and net income will spot the pattern before it becomes a crisis.
Which Metric Gives You the True Story of Business Profitability
Neither EBITDA nor net income delivers the whole truth on its own, and the most reliable reading of a company’s profitability comes from holding both in view at once. Each metric answers a different question, and the questions complement one another. EBITDA answers how much cash-like operating profit the core business generates before the effects of financing structure, tax jurisdictions, and accounting choices around long-lived assets. Net income answers what actually remains for shareholders after every real cost has been recognized. Used together, they create a fuller picture than either can produce alone.
There are clear situations where EBITDA is the more informative metric. When comparing companies with different capital structures, tax positions, or depreciation policies, EBITDA strips out those differences and lets an analyst compare operating performance across peers. It is also useful in leveraged settings, where interest expense dominates the income statement and obscures how the underlying business is performing. For assessing a company’s capacity to service debt or fund capital expenditures, EBITDA provides a starting point that reflects operating strength rather than financing decisions. In capital-intensive industries, depreciation can be substantial well before assets require replacement, and EBITDA helps isolate the cash-generating core.
Net income becomes the more informative metric in other contexts. When evaluating what a business actually earns for its owners, net income is the figure that flows to retained earnings and supports dividends. It captures the cost of debt, the tax burden, and the gradual consumption of assets, all of which are real economic events. For mature companies with stable capital structures, net income tracks shareholder value creation more closely. It is also the metric tied to reporting standards, earnings per share, and most valuation multiples based on equity.
A practical approach is to use EBITDA as a lens on operating performance and net income as a lens on bottom-line outcomes, then reconcile the two. A widening gap between them often signals something worth investigating, such as rising leverage, aggressive capitalization, or heavy asset consumption. Reading the two metrics side by side gives analysts and managers a balanced view that reflects both the engine of the business and the final result it delivers.
Frequently Asked Questions
What is the difference between EBITDA and net income?
EBITDA starts with operating profit and adds back interest, taxes, depreciation, and amortization, while net income is the bottom line after every expense has been recorded. Net income reflects interest paid, taxes, depreciation and amortization, and items EBITDA never touches, such as gains or losses on asset sales, restructuring charges, and other one-time events.
How is EBITDA calculated?
EBITDA can be calculated by starting with net income and adding back interest expense, income tax expense, depreciation, and amortization. It can also be derived from operating income by adding back depreciation and amortization.
Why do investors and analysts use EBITDA?
Investors and analysts use EBITDA as a proxy for cash operating profit and to compare operating performance across companies with different capital structures, tax situations, and accounting policies. It is also used in valuation multiples such as EV/EBITDA and in debt covenants.
What are the main limitations of EBITDA?
EBITDA excludes maintenance capital expenditures needed to maintain and replace assets and excludes interest costs, so it can present a flattering picture of cash-generating ability. It is not a substitute for cash flow measures because it ignores working capital changes and capital expenditures.
How can net income give a distorted picture of a company’s health?
Net income can be distorted by one-time charges such as restructuring costs, impairment write-downs, or legal settlements, and by tax effects such as credits or deferred tax adjustments. Non-cash items like depreciation, amortization, and stock-based compensation can also make net income a poor proxy for operational health and liquidity.
Which metric gives the true story of business profitability?
Neither EBITDA nor net income delivers the whole truth on its own; the most reliable reading comes from holding both in view at once. EBITDA is useful as a lens on operating performance, while net income is a lens on bottom-line outcomes, and reconciling the two can reveal issues such as a widening gap.