
Financial Forecasting
A financial forecast projects income and expenses across multiple months or years to show how cash flow will likely evolve, while a monthly budget sets and tracks current spending limits. Both are needed: the budget supplies the actual data that makes forecasts realistic, and the forecast provides the longer view that makes budgets purposeful.
Table of Contents
- Core Differences Between a Monthly Budget and a Financial Forecast
- Gathering Your Historical Income and Expense Baseline
- Setting Realistic Assumptions for Seasonal Costs and Unplanned Expenses
- Building Your Model
- Projecting Future Cash Flow to Identify Potential Money Shortfalls
- How Often Should You Update Your Financial Projections
- Stress Testing
- Establishing a Ten-Minute Monthly Routine to Keep Projections Accurate
Core Differences Between a Monthly Budget and a Financial Forecast
A monthly budget and a financial forecast serve distinct purposes within a household or business financial system, and understanding where one ends and the other begins helps clarify why each deserves attention. A budget is a present-tense tool. It establishes spending limits for categories such as housing, groceries, transportation, and discretionary purchases, then tracks actual spending against those limits as the month unfolds. The budget answers a narrow, immediate question: are current outflows staying within the boundaries set at the start of the period? When spending in a category approaches its cap, the budget signals that a decision is needed now, whether that means trimming elsewhere, delaying a purchase, or adjusting the limit. Its value lies in discipline and visibility over the short term, giving a person or organization a reliable picture of where money is going during the current cycle.
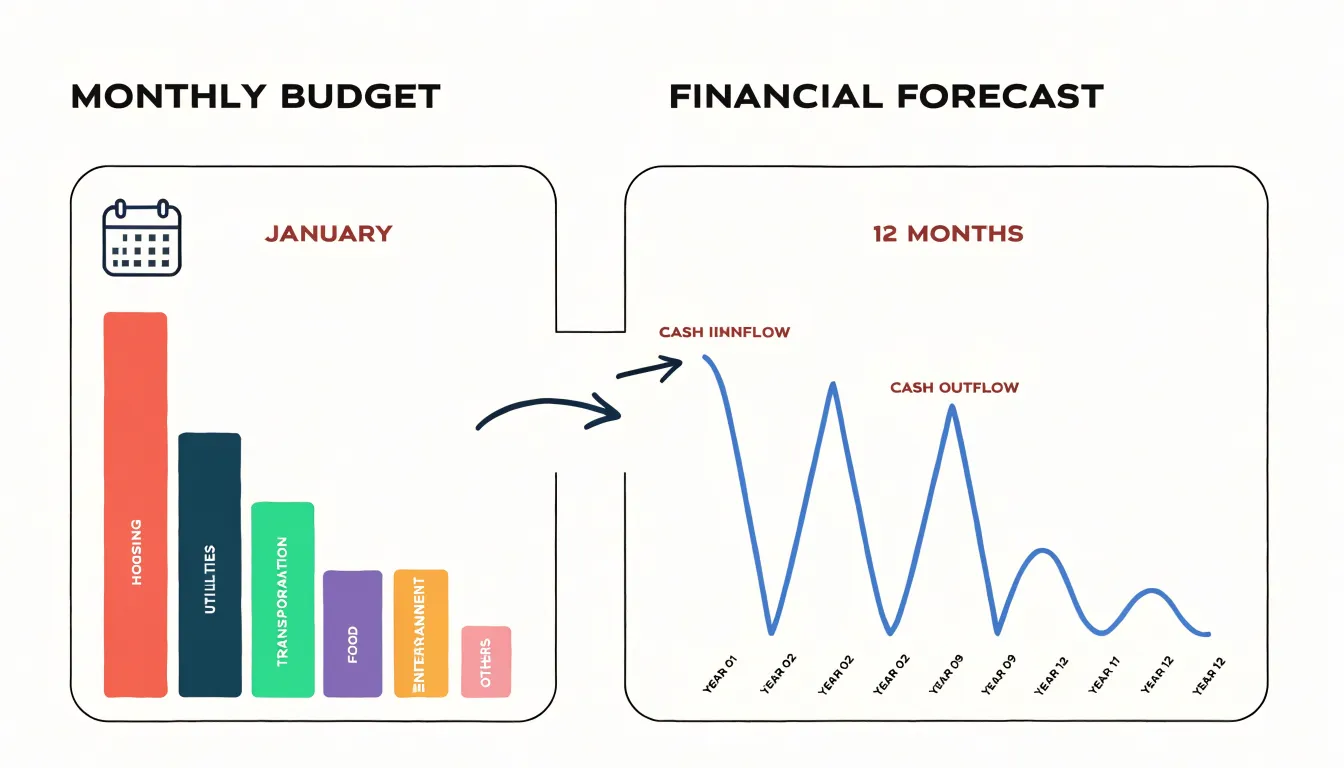
A financial forecast operates on a different time horizon. Rather than policing this month’s spending, it projects income and expenses across multiple months or years, mapping out how cash flow is likely to evolve. A forecast might anticipate a seasonal dip in revenue, a planned large purchase such as a vehicle or equipment, an upcoming tuition payment, or the cumulative effect of gradual cost increases. It accounts for irregular income, one-time expenses, and long-range obligations that a single month’s budget cannot capture. The forecast answers forward-looking questions: will there be enough cash on hand in six months to cover a major expense, and how will savings accumulate over the next year given current trends?
The reason both tools are needed comes down to the different risks each one manages. A budget without a forecast can produce month-to-month compliance while missing a looming shortfall several months out, leaving no time to prepare. A forecast without a budget can project a healthy year overall while overlooking overspending happening in the present that erodes the very resources the forecast depends on. Used together, the budget keeps daily decisions grounded in current limits, and the forecast provides the longer view that informs those limits in the first place, such as adjusting monthly savings targets to meet a future goal. The two reinforce each other, with the budget supplying the data that makes forecasts realistic and the forecast supplying the context that makes budgets purposeful.
Gathering Your Historical Income and Expense Baseline
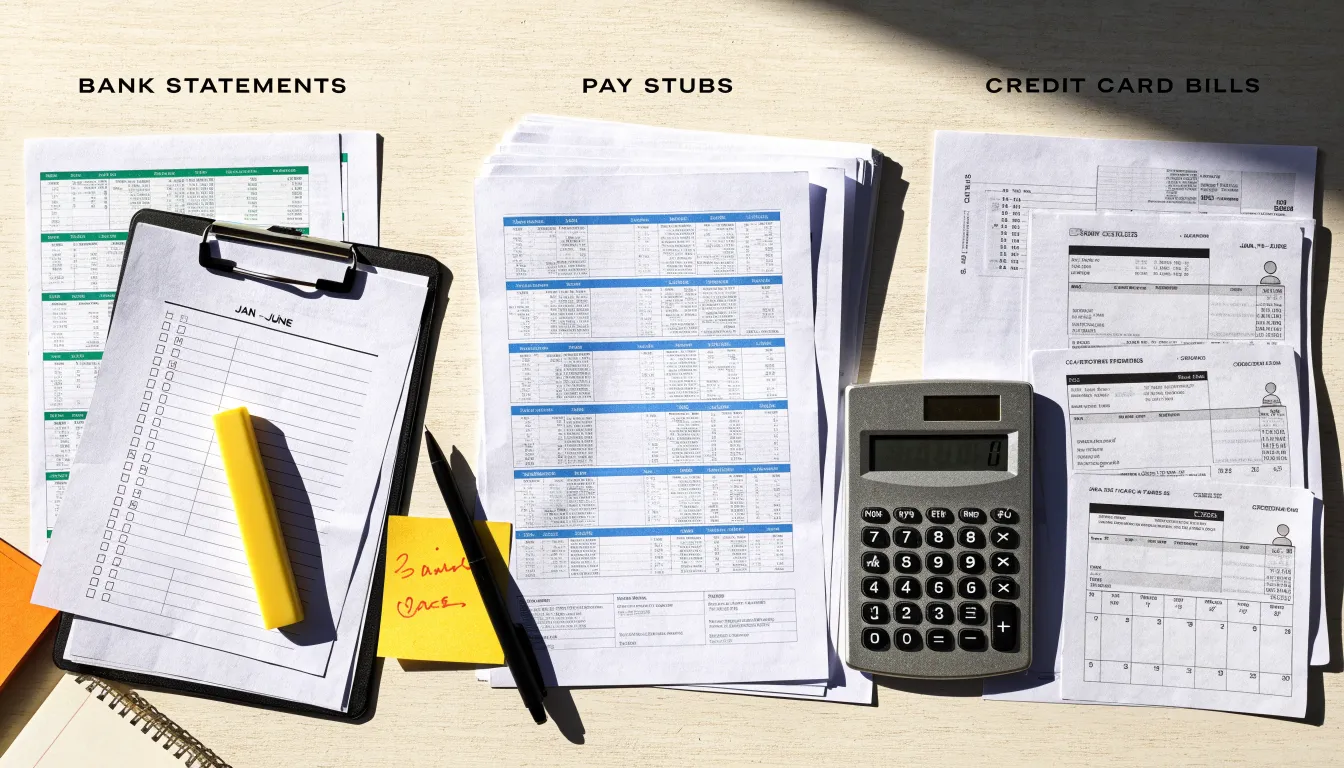
The foundation of any financial forecast is a clear picture of your current financial reality, which begins with gathering your historical income and expense baseline. This process involves collecting past records that document your cash inflows and outflows over a meaningful period. Start by pulling together at least three to six months of bank statements, pay stubs, and credit card bills. Bank statements provide a comprehensive view of all transactions, including deposits, withdrawals, and transfers. Pay stubs offer detailed information about your income, including gross wages, taxes withheld, and deductions for benefits or retirement contributions. Credit card bills capture spending that may not appear on bank statements, such as online purchases or recurring subscriptions. Together, these documents create a complete record of your financial activity.
Once you have these records, the next step is to categorize your transactions. Create broad categories for both income and expenses to make analysis manageable. Common income categories include salary, freelance earnings, investment dividends, and other sources. Expense categories might include housing (rent or mortgage, utilities), transportation (car payments, fuel, public transit), food (groceries, dining out), insurance, healthcare, entertainment, and debt payments. As you categorize, be consistent and thorough; this categorization will later help you identify patterns and areas where you can adjust spending.
After categorizing, calculate your average monthly income and spending. For income, sum all income sources for each month and then average across the months you’ve gathered. This gives you a reliable figure that smooths out irregularities like bonuses or one-time payments. For expenses, total your spending in each category per month and then calculate the average monthly amount for each category and overall. This average provides a realistic baseline for your forecast, reflecting your typical financial behavior rather than outliers. With this baseline in hand, you can move forward to build a forecast that is grounded in actual data, making your projections more accurate and actionable.
Setting Realistic Assumptions for Seasonal Costs and Unplanned Expenses
Setting realistic assumptions for seasonal costs begins with identifying recurring patterns in your spending. Many expenses follow a predictable calendar: insurance premiums that come due annually or semi-annually, holiday gifts and celebrations, back-to-school purchases, property taxes, and seasonal maintenance like gutter cleaning or HVAC servicing. Review your bank and credit card statements from the past two to three years to spot these rhythms. Note the month each expense typically occurs and its approximate amount. Once identified, divide the annual total by twelve and set aside that amount monthly in a dedicated savings category. This approach, often called sinking funds, prevents seasonal costs from disrupting your monthly cash flow and turns a large, lump-sum bill into a manageable, predictable line item.
Irregular expenses, such as car repairs, home maintenance, or medical copays, are less predictable in timing but no less real. Estimate them by looking at historical averages: how much did you spend on car repairs over the last three years? Divide that total by 36 to get a monthly baseline. For expenses with no history, such as a first-time vehicle owner, research typical costs for your make and model or consult industry averages. Build these estimates into your budget as a fixed monthly allocation, even if the actual expense occurs sporadically. The goal is to smooth out the financial impact so that when the repair bill arrives, the money is already available.
Finally, build in a buffer for truly unplanned costs. No forecast can anticipate every expense, so include a contingency line in your budget, typically 5 to 10 percent of total monthly expenses, or a fixed amount like $100 to $200. This buffer absorbs small surprises without derailing your plan. For larger unexpected events, maintain a separate emergency fund with three to six months of essential expenses. Treat the buffer as a regular budget category, not an afterthought. By combining identified seasonal costs, estimated irregular expenses, and a deliberate buffer, your financial forecast becomes more resilient and realistic, reducing the likelihood of having to rely on credit or dip into savings when the unexpected occurs.
Building Your Model
A well-organized spreadsheet layout is the foundation of any reliable financial forecast. Begin by opening a new workbook and dedicating a single sheet to the forecast itself, reserving other tabs for assumptions, source data, and notes. The main forecast sheet should follow a grid structure: categories run down the rows, while time periods run across the columns. Place a header row at the top listing each month of the forecast horizon, for example January through December, with the month labels entered as text. In the first column, below the header, list your income categories first, such as salary, freelance work, investment income, and other receipts, followed by a subtotal row labeled Total Income. Beneath that, list expense categories grouped logically, for instance housing, utilities, groceries, transportation, insurance, debt payments, and discretionary spending, closing with a Total Expenses row. Adding a blank spacer row between income and expense blocks keeps the structure visually clear.
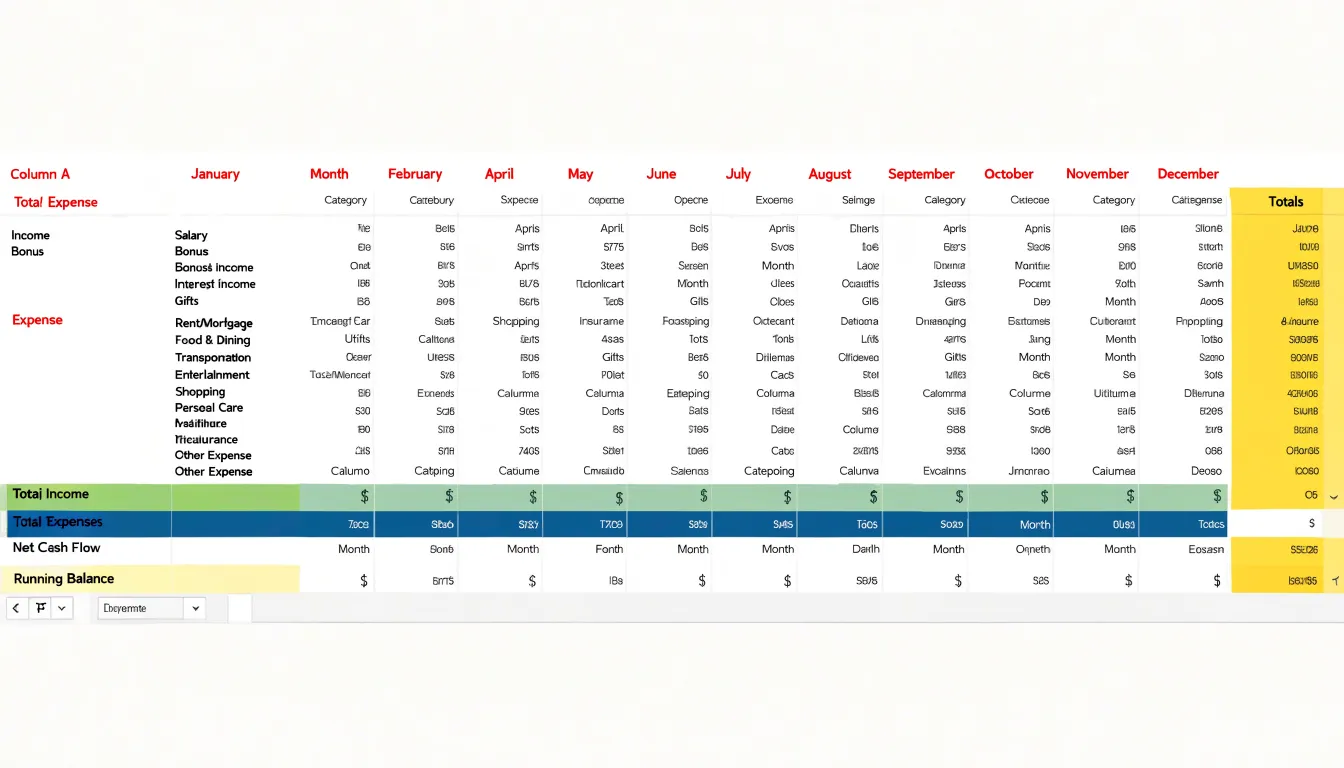
Once the skeleton is in place, enter the formulas that make the model dynamic. In the Total Income row, use a SUM formula spanning the income category rows for each month column, for example =SUM(B5:B9) in the January column, then copy that formula across all twelve months. Do the same for Total Expenses, summing the expense rows per column. Create a Net Cash Flow row that subtracts Total Expenses from Total Income for each month, using a formula such as =B10-B20. Below that, build a Running Balance row: the first month references an opening balance cell entered above the grid, while each subsequent month adds the prior month’s running balance to the current month’s net cash flow, for example =B22+B23 copied across. Absolute references should be used for the opening balance so it stays fixed if formulas are copied. Finally, add a totals column at the far right that sums each row across all months, giving annual figures for every category. Lock formula cells and apply consistent number formatting, such as currency with two decimals for values and percentages for any rate rows, so the finished layout reads cleanly and updates automatically whenever an input changes.
Projecting Future Cash Flow to Identify Potential Money Shortfalls
Projecting future cash flow begins with building a clear month-by-month picture of money coming in and money going out. Start by listing all expected inflows for each month, including salary or business revenue, recurring payments such as rent from tenants, and any anticipated one-off receipts. Then list expected outflows: fixed costs like rent or loan payments, variable costs like utilities and groceries, and scheduled irregular expenses such as insurance premiums, tax payments, or annual subscriptions. Subtracting total outflows from total inflows for each month gives the net cash flow, a single figure that shows whether that month is expected to add to or draw down your reserves.
Once net cash flow is calculated for every month in the forecast horizon, usually six to twelve months ahead, review the results for months where the figure turns negative, meaning expenses are projected to exceed income. These shortfall months deserve close attention because they represent points where cash reserves will be depleted or borrowing may become necessary. It helps to rank shortfalls by size and timing so the most pressing gaps are addressed first, and to note whether a shortfall is a one-off event, such as a large tax bill, or part of a recurring seasonal pattern, such as slower sales during certain quarters.
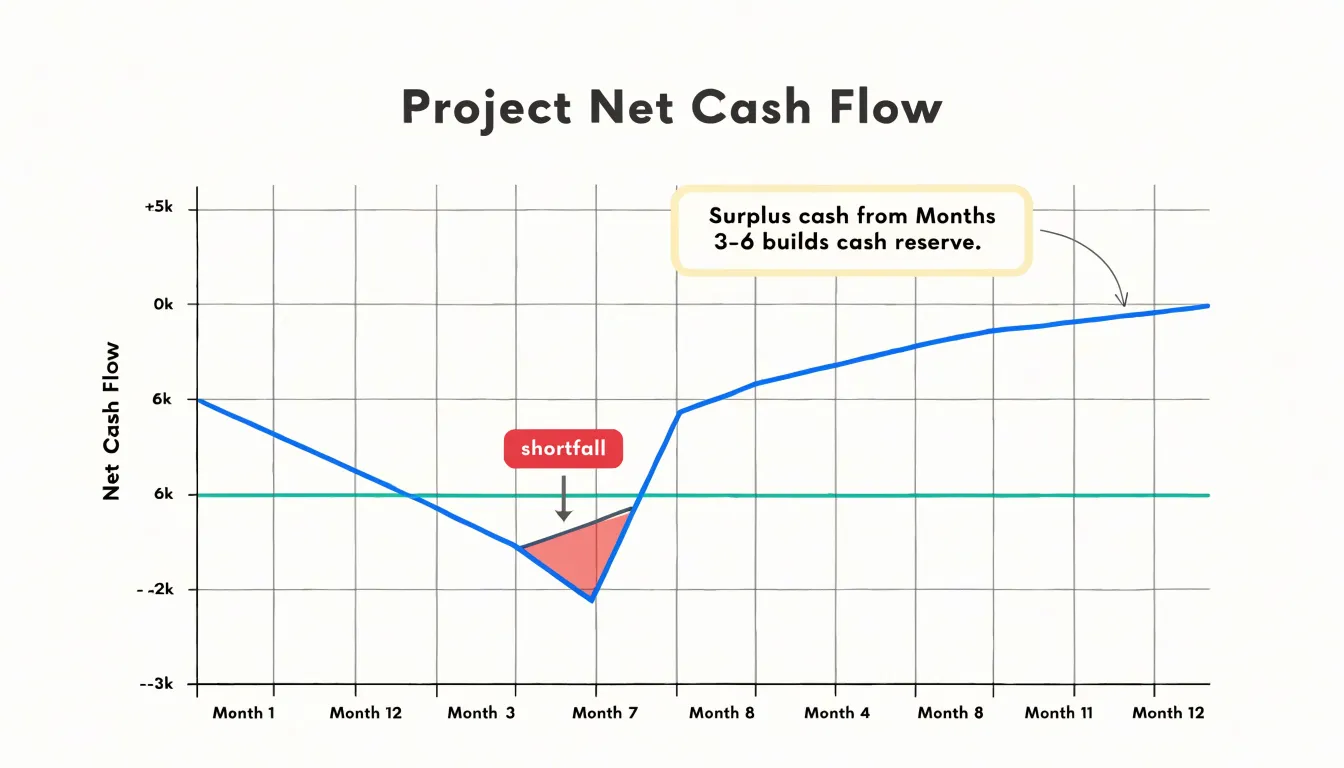
Planning ahead for identified shortfalls gives you time to respond deliberately rather than react under pressure. One approach is to adjust spending in the months leading up to a shortfall, deferring discretionary purchases, renegotiating payment schedules, or shifting large expenses to months with stronger cash flow. Another approach is to build or reinforce a cash reserve during surplus months so that funds are available when the shortfall arrives. Setting aside a portion of each positive month’s net cash flow creates a buffer that smooths out the peaks and troughs of the cash cycle. Reviewing the forecast regularly and updating it as actual figures come in keeps the projection accurate and ensures shortfalls are spotted early enough for adjustments to take effect.
How Often Should You Update Your Financial Projections
Financial projections are only useful when they reflect the reality of your current situation, which is why the question of how often to update them matters as much as the projections themselves. For most individuals and small businesses, a monthly or quarterly review cycle provides a dependable rhythm. A monthly update suits anyone whose income or expenses shift regularly, such as freelancers, commission-based earners, or businesses with fluctuating cash flow. It keeps the forecast close to actual results and catches drift before small variances compound into large gaps. A quarterly update works well for those with stable salaries, fixed-rate obligations, and predictable spending patterns, since less frequent changes mean less administrative effort while still keeping the forecast aligned with the year’s trajectory.
The review cadence should be treated as a baseline rather than a rigid rule. Any significant change in income or major expenses is a clear signal to revisit the projections immediately rather than waiting for the next scheduled review. A raise, a job change, a new client, or the loss of a contract all alter the assumptions underpinning the forecast. On the expense side, a new mortgage, a rent increase, a large medical bill, a vehicle purchase, or a significant rise in recurring costs each deserve a fresh look at the numbers. Updating promptly in these moments keeps the forecast accurate and preserves its value as a planning tool.
It also helps to separate routine updates from structural revisions. A routine update refreshes the actual figures for the period and adjusts the near-term outlook, while a structural revision reworks the underlying assumptions. Seasonal patterns, annual renewals, and tax obligations can be built into the review calendar so they never arrive as surprises. Documenting changes as they happen, along with the reasoning behind each adjustment, builds a record that makes future forecasts faster and more reliable.
Consistency is the foundation of an accurate forecast. A regular monthly or quarterly review, combined with prompt updates whenever income or major expenses change, keeps the projections grounded in current circumstances and ensures the forecast continues to guide sound financial decisions.
Stress Testing
Stress testing begins with a simple but uncomfortable question: what would actually happen to your finances if your income dropped tomorrow? To answer it, start by modeling the scenario in concrete terms. Pick a specific event, such as a job loss or a reduction from full-time to part-time hours, and write down the new monthly income it would produce. For a job loss, that figure may be zero plus any severance or unemployment benefits you would qualify for. For reduced hours, calculate the exact take-home pay at the new schedule. Build these scenarios side by side in a spreadsheet or on paper so you can see how each one changes your monthly cash position.
Next, calculate your runway: how many months your savings would cover expenses under each scenario. Take your accessible savings, excluding retirement accounts you cannot easily tap, and divide it by your monthly essential expenses rather than your total spending. Essential expenses include housing, utilities, groceries, insurance, transportation, and minimum debt payments. If your savings total $12,000 and essentials run $3,000 a month, you have four months of runway. Run the same calculation under the reduced-income scenario, where your savings only need to cover the gap between reduced income and expenses, and you will likely find a much longer runway.
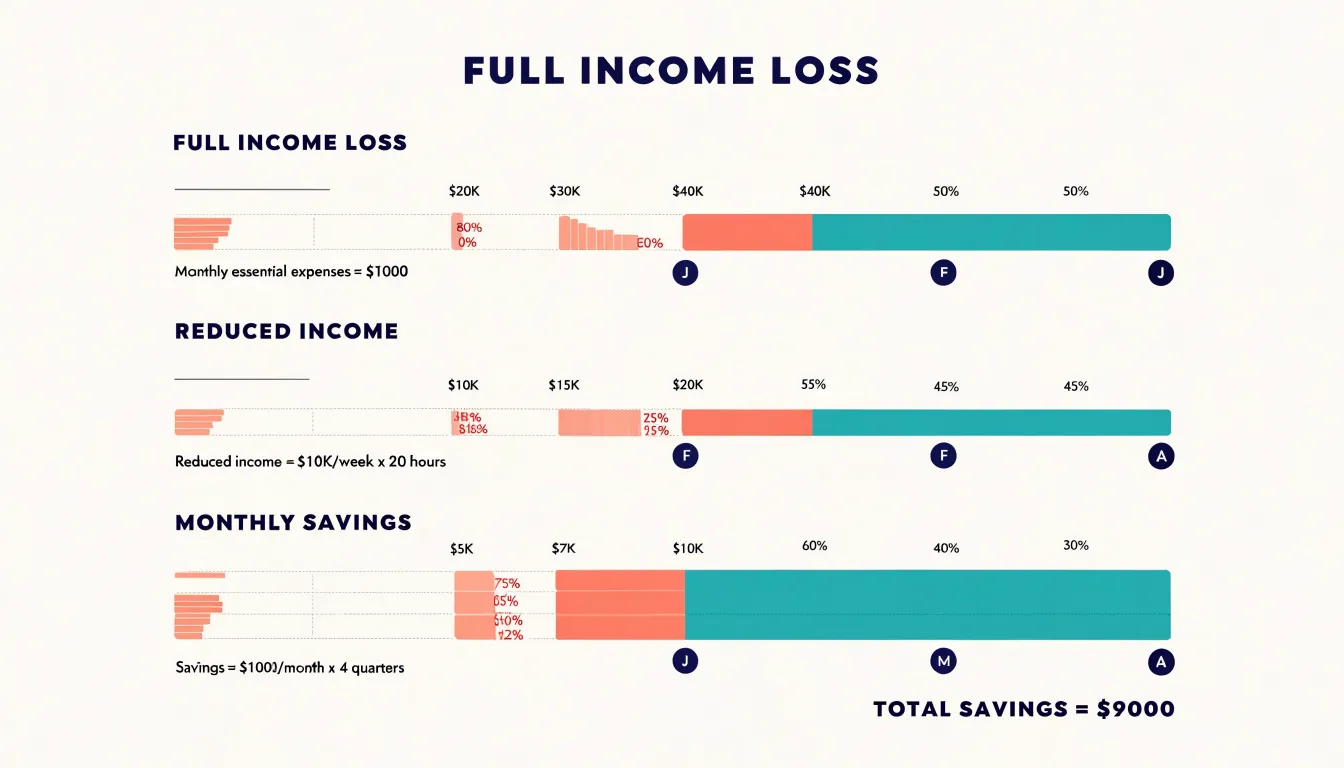
Once you know your runway, identify the cuts you would make to extend it. List discretionary expenses in order of how quickly they can be eliminated: subscriptions, dining out, entertainment, travel, and non-essential shopping first, followed by harder choices like pausing retirement contributions or refinancing debt. Attach a dollar figure and a timeline to each cut so the plan is actionable rather than aspirational. Recalculate your runway after the cuts to see the improvement, and set a target minimum runway, often three to six months, that you want your savings to reach. Reviewing these scenarios periodically keeps the plan current as your income, expenses, and savings change.
Establishing a Ten-Minute Monthly Routine to Keep Projections Accurate
Establishing a Ten-Minute Monthly Routine to Keep Projections Accurate
A financial forecast only stays useful when it is visited regularly, and a short monthly routine is the easiest way to keep projections aligned with reality. The routine works best when it follows the same sequence each month, so it becomes automatic rather than something that requires fresh decisions about where to start.
The first step is updating actual income and expenses. Gather the figures for the month just ended, including every source of income and every category of spending, and enter them into the forecast. This step grounds the projection in confirmed numbers and builds a record of how money actually moved during the period.
Next, compare the actual figures against what was forecast for the same month. Look at each line item and note where the gap is largest. A short written note beside each meaningful variance explains why the number differed, whether a bill arrived higher than expected, a payment came in late, or a recurring cost quietly increased. These notes become valuable context in later months when the same patterns appear again.
The third step is adjusting future assumptions. If actual results have drifted from the forecast for several months, update the assumptions behind future figures: expected income growth, typical expense levels, seasonal swings, and any known changes such as a new contract or an expiring subscription. Assumptions that are revised monthly stay close to real conditions and prevent small errors from compounding over the year.
Finally, review cash flow for the next three months. Map out expected inflows and outflows week by week or month by month, and identify any point where the balance dips low. A three-month horizon gives enough lead time to shift payment timing, delay a discretionary purchase, or arrange additional funds before a shortfall becomes urgent.
Ten minutes spent this way each month keeps the forecast current, surfaces problems early, and turns the projection into a working tool rather than a document filed away after it is first created.
Frequently Asked Questions
What’s the difference between a monthly budget and a financial forecast?
A budget is a present-tense tool that sets spending limits and tracks actual spending for the current month, while a financial forecast projects income and expenses across multiple months or years to show how cash flow is likely to evolve. The article says both are needed because each manages different risks.
How much financial history should I gather before making a forecast?
Start by pulling together at least three to six months of bank statements, pay stubs, and credit card bills. Together, these documents create a complete record of your financial activity.
How much should I set aside for unplanned expenses in a budget?
Include a contingency line in your budget, typically 5 to 10 percent of total monthly expenses or a fixed amount like $100 to $200, to absorb small surprises. For larger unexpected events, maintain a separate emergency fund with three to six months of essential expenses.
How do I set up a spreadsheet for a financial forecast?
Use a single forecast sheet with categories listed down the rows and months across the columns, placing income categories first with a Total Income row, then expense categories with a Total Expenses row. Add formulas for Total Income, Total Expenses, Net Cash Flow, a Running Balance, and a totals column at the far right.
How often should I update my financial projections?
For most individuals and small businesses, a monthly or quarterly review cycle provides a dependable rhythm. Update immediately when income or major expenses significantly change, such as a raise, job change, new mortgage, rent increase, or large medical bill.
How do I stress test my finances if my income drops?
Model a specific income-drop scenario, such as a job loss or reduced hours, then calculate runway by dividing accessible savings—excluding retirement accounts you cannot easily tap—by monthly essential expenses. Essential expenses include housing, utilities, groceries, insurance, transportation, and minimum debt payments.