
Financial Ratios Cheat Sheet
Financial ratios are calculations that compare two or more figures from a company’s financial statements to reveal liquidity, profitability, solvency, efficiency, and valuation. They convert raw balance sheet and income statement numbers into measurable indicators—such as the current ratio, gross margin, return on equity, debt-to-equity, and price-to-earnings—allowing meaningful comparison across companies, industries, and time periods.
Table of Contents
- How Financial Ratios Reveal the Real Story Behind Business Numbers
- Liquidity Metrics and Measuring Short Term Cash Strength
- Can the Business Pay Its Immediate Bills With the Current Ratio?
- Testing Instant Cash Health Using the Quick Ratio
- Profitability Formulas
- Understanding Gross and Net Profit Margins
- How Return on Equity Shows Management Performance
- Solvency Ratios
- Debt to Equity Ratio and What It Tells Investors
- Efficiency Metrics and Tracking How Well Assets Are Managed
- How Fast Is Inventory Turning Into Revenue?
- Valuation Metrics
- Comparing Market Value Using the Price to Earnings Ratio
- Common Red Flags to Watch for When Calculating Metrics
How Financial Ratios Reveal the Real Story Behind Business Numbers
Raw financial statements contain enormous amounts of data, yet on their own they explain very little. A balance sheet listing total assets of fifty million dollars tells you nothing about whether those assets are being used productively. An income statement showing net profit of two million dollars says little about whether that profit represents an improvement or a decline, whether it is sustainable, or whether it required an unreasonable amount of debt to generate. Financial ratios give those numbers a voice.
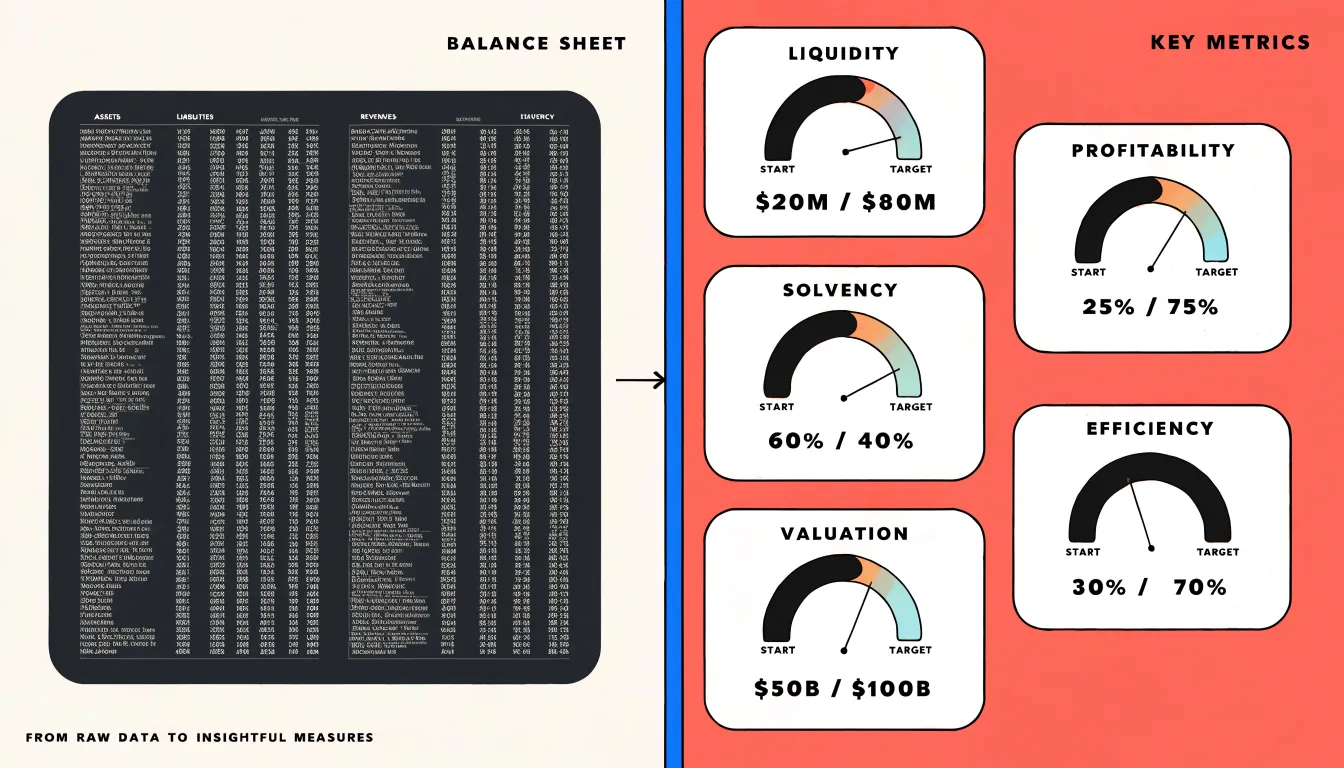
Context is the first thing ratios provide by placing a single figure in relationship to another. When inventory of five million dollars is measured against annual sales, the cost of goods sold, or the inventory levels of prior years, it communicates how quickly stock moves through the business. A company holding excessive inventory may be tying up cash that could fund growth, while a company holding too little may be leaving sales on the table. The underlying dollar figure is identical in both cases; only the ratio reveals which situation applies.
Comparability is the second contribution. A small manufacturer and a multinational conglomerate will never have comparable revenue totals, but their gross margins, return on equity, or current ratios can be placed side by side meaningfully. Ratios strip away scale and expose the underlying economics, allowing an analyst to judge a company against its competitors, its own history, and industry benchmarks. A profitability ratio of eight percent means something specific when the industry average sits at twelve percent—a comparison invisible in the income statement alone.
Ratios also expose the relationships among different parts of the business. A company can report rising profits while its debt burden grows faster, a pattern that looks healthy on the income statement but signals real risk once leverage and coverage ratios are examined. Liquidity ratios can expose a business that appears profitable yet lacks the cash to meet near-term obligations. Efficiency ratios reveal whether management is converting assets into revenue effectively. Together, they transform static numbers into a coherent picture of efficiency, risk, profitability, and solvency.
Liquidity Metrics and Measuring Short Term Cash Strength
Liquidity metrics answer a practical question: can a business pay the bills coming due in the next few weeks or months? Liquidity refers to the ability to convert assets into cash quickly enough to meet near-term obligations without disrupting normal operations. A company can be profitable on paper and still collapse if cash arrives too slowly to cover payroll, supplier invoices, loan installments, and rent. Because of this, liquidity ratios act as early warning indicators for short-term financial stress.
Beyond the current and quick ratios, the cash ratio counts only cash and near-cash equivalents against current liabilities, representing the most conservative view of immediate paying power. Working capital and the cash conversion cycle add further texture:
- Working capital: The simple difference between current assets and current liabilities, showing the absolute dollar cushion available.
- Cash conversion cycle: Tracks how many days pass between paying suppliers and collecting from customers, revealing how efficiently a business turns its operations into cash.
- Days sales outstanding and days payable outstanding: Feed into the cash conversion cycle to highlight where cash gets tied up.
Industry norms vary widely when interpreting these figures. A supermarket with fast inventory turnover can operate safely on lower liquidity ratios than a manufacturer holding slow-moving stock. Comparing a company’s ratios against its own history and its peers over several periods builds a realistic picture of whether it can weather shocks, seize opportunities, and meet its obligations on time.
Can the Business Pay Its Immediate Bills With the Current Ratio?
The current ratio gauges whether a business can meet its obligations over the next twelve months. The formula is:
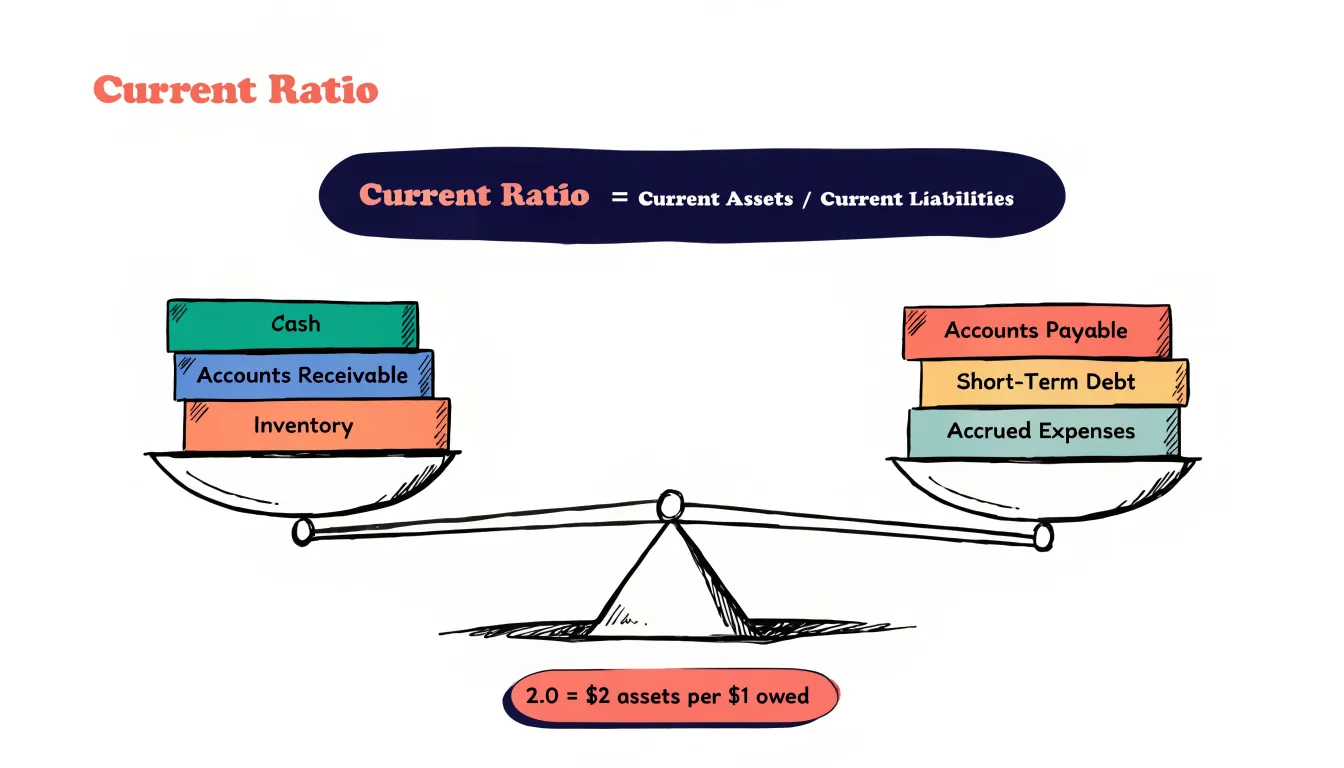
Current Ratio = Current Assets / Current Liabilities
Current assets include cash, accounts receivable, inventory, and other short-term resources expected to convert into cash within a year. Current liabilities cover accounts payable, short-term debt, accrued expenses, and other obligations due within the same window. A result of 2.0 means the company holds two dollars of liquid resources for every dollar it owes in the near term, while a result of 0.8 suggests it holds less than a dollar for each dollar coming due.
A ratio above 2.0 generally signals a comfortable liquidity cushion, though very high values can indicate idle cash or sluggish receivables rather than strength. A ratio between 1.0 and 2.0 is common across many industries and typically suggests a workable balance. A ratio below 1.0 implies short-term obligations exceed short-term resources, though some businesses operate this way deliberately by relying on steady cash inflows. Ratios near or below 1.0 warrant closer inspection of the underlying accounts rather than an automatic verdict of distress.
Several limitations temper the ratio’s usefulness:
- Illiquid components: Inventory and receivables may be slow to convert into cash, or they may be overstated. A retailer holding seasonal stock and a software firm with mostly cash and receivables can post identical ratios while facing very different liquidity realities.
- Window dressing: A company can pay down payables or sell assets just before a reporting date, temporarily lifting the ratio without any lasting improvement in financial health.
- Timing blind spots: The ratio ignores the timing of cash flows within the year, treating all current items as equally liquid.
Because of these limits, analysts often pair the current ratio with cash flow statements and the quick ratio.
Testing Instant Cash Health Using the Quick Ratio
The quick ratio, often called the acid-test ratio, measures whether a company can settle its short-term obligations using only its most liquid assets. The calculation takes the sum of cash and cash equivalents, marketable securities, and accounts receivable, then divides that total by current liabilities. Each of these quick assets can be converted into cash within a short window, typically ninety days or less. A benchmark of 1.0 indicates that liquid assets exactly cover immediate obligations.
A defining feature of the quick ratio is the exclusion of inventory. Turning inventory into cash requires a two-step process: the goods must first be sold, and then the resulting receivable must be collected. Both steps take time and carry uncertainty. Merchandise may sit on shelves longer than expected, need discounting to move, or lose value through obsolescence or damage. Stripping inventory out of the numerator focuses on assets already close to cash, ignoring current assets whose liquidity depends on future sales.
This makes the quick ratio a stricter test of short-term health. A company can post a healthy current ratio while holding most of its current assets in inventory; the quick ratio reveals whether that company could still pay its bills if sales stalled. This is especially useful for businesses with slow-moving stock, seasonal demand, or highly specialized inventory. Creditors and analysts use it to assess whether a borrower could withstand a sudden cash flow interruption. A ratio comfortably above 1.0 suggests a solid cushion, near 1.0 indicates a workable but tight position, and well below 1.0 signals reliance on selling inventory or raising new financing to meet near-term obligations.
Profitability Formulas
Profitability ratios judge how effectively a company converts its activities into earnings, showing how much of every dollar moving through the business actually remains as profit.
Gross margin, net margin, and return on equity each examine earnings efficiency from a different vantage point. Where gross margin and net margin focus on the income statement to track production and operational efficiency, return on equity connects those earnings to the balance sheet’s funding base. Together, these formulas trace profitability from the production line down to the shareholder’s stake.
Understanding Gross and Net Profit Margins
Gross profit margin captures the relationship between what a company charges for its products or services and the direct costs of delivering them, including materials, manufacturing labor, and freight. It is calculated by subtracting cost of goods sold from revenue to arrive at gross profit, then dividing gross profit by revenue and multiplying by 100 to express the result as a percentage. A consistently high gross margin suggests meaningful pricing power, a favorable cost structure, or a differentiated product. A low or eroding gross margin can signal intense competition, rising input costs, discounting pressure, or a product mix shifting toward lower-margin offerings.
Net profit margin takes the analysis down to the bottom line. It is calculated by dividing net income—after all operating expenses, interest, taxes, and other charges have been deducted—by revenue. Where gross margin isolates the core economics of the product, net margin reflects the total efficiency of the entire organization, including how well management controls sales, marketing, and administrative overhead, and how debt servicing affects the bottom line. Two companies can post identical gross margins while differing sharply in net margin if one carries heavy overhead or interest costs.
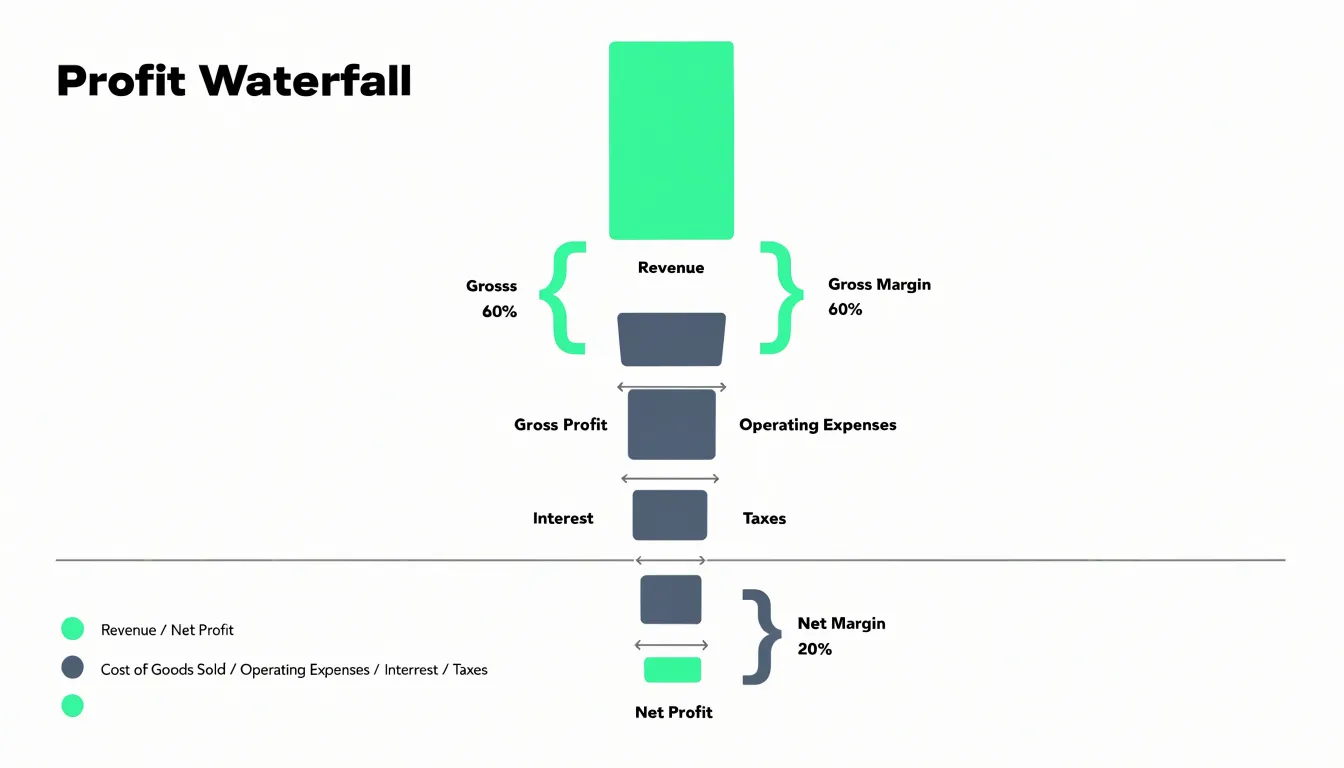
Interpreting changes over time requires looking at both ratios together:
- Falling gross margin with a stable net margin: May indicate that management is offsetting product-level pressure through disciplined overhead control.
- Stable gross margin with a declining net margin: Often points to rising operating or financing costs rather than trouble in the core offering.
Capital-intensive sectors naturally run different margin profiles than service businesses, so comparing each margin against industry peers and tracking trends across several quarters helps distinguish temporary cost spikes from structural shifts in pricing power or cost discipline.
How Return on Equity Shows Management Performance
Return on Equity (ROE) reveals how effectively a company’s management team uses shareholders’ equity to generate profits. The formula is:
ROE = Net Income / Shareholders’ Equity
Net income, found on the income statement, is the profit left after all expenses, taxes, and interest are paid. Shareholders’ equity, from the balance sheet, is the capital contributed by shareholders plus retained earnings. An ROE of 15% means the company generates $0.15 in profit for every dollar of equity invested. Persistent double-digit returns on equity often signal a durable competitive advantage.
However, ROE comes with important caveats:
- Debt distortion: A company can boost its ROE by taking on more debt. Because debt is used to finance assets instead of equity, higher borrowing increases financial leverage and reduces the equity base. This can make ROE look impressive even if underlying operations are inefficient, so ROE must be examined alongside debt levels.
- Income volatility: ROE can swing sharply for companies with inconsistent net income.
- Negative equity: The metric is not meaningful for firms with negative shareholders’ equity.
Solvency Ratios
Solvency ratios examine a company’s long-term financial health, focusing on whether the business can carry its debts over the years ahead rather than simply covering next month’s bills. A company can look comfortable in short-term liquidity measures while quietly carrying a debt load that will strain it for a decade. Solvency ratios step back to weigh the overall balance between borrowed money and the resources available to repay it.
Alongside the debt-to-equity ratio, interest coverage measures how comfortably a company’s operating earnings can service its debt payments. Dividing earnings before interest and taxes (EBIT) by interest expense produces a multiple showing how many times over the business could pay its financing costs from current operations. A thin multiple leaves little margin for a bad quarter, while a generous one indicates the company can weather weaker periods without risking default.
A firm might carry substantial debt yet cover its interest easily through strong earnings, or hold modest debt relative to equity while generating barely enough profit to meet its obligations. Tracking both ratios alongside cash flow trends and the maturity schedule of outstanding debt helps analysts judge whether a company’s long-term obligations sit comfortably within its earning power.
Debt to Equity Ratio and What It Tells Investors
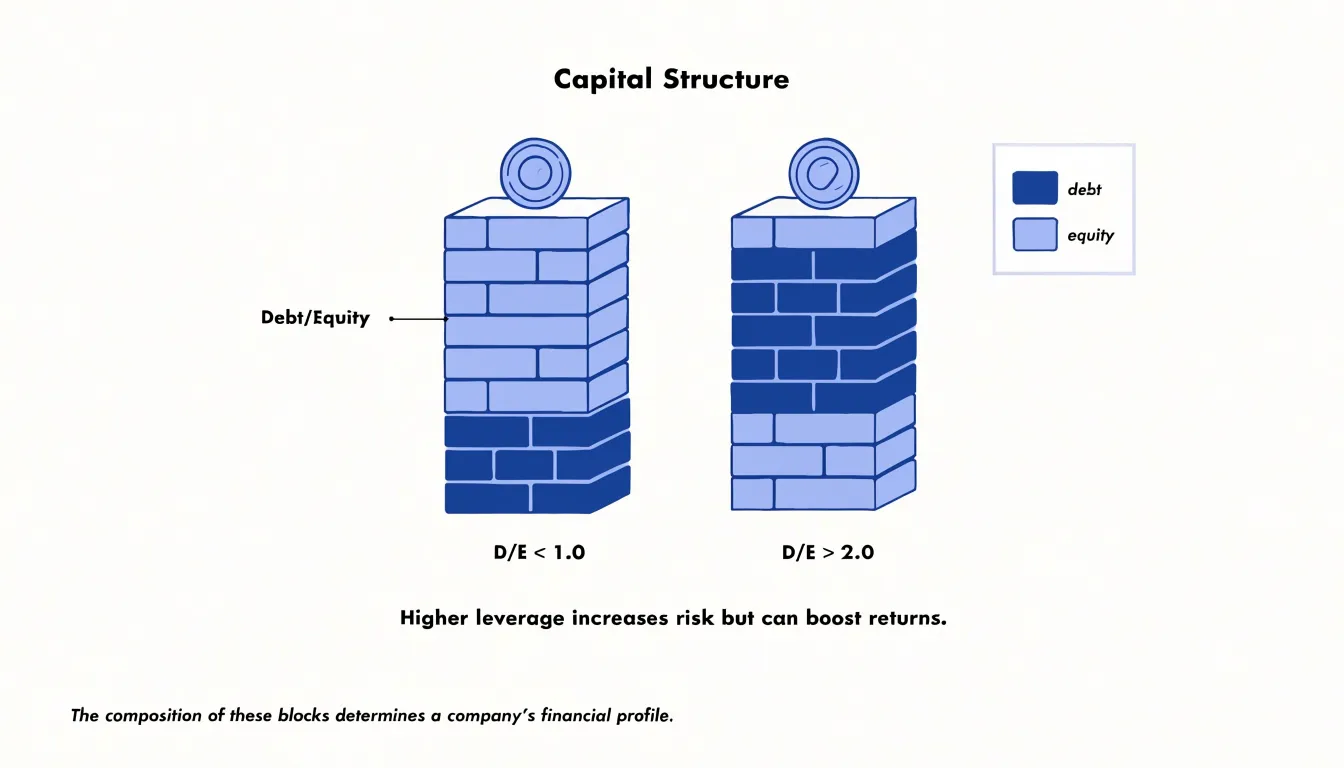
The debt-to-equity ratio compares a company’s total liabilities to its shareholders’ equity, calculated by dividing total debt by total equity. A result of 1.0 means the company carries one dollar of debt for every dollar of equity; a result of 2.0 means two dollars of debt for every dollar of equity. This shows the balance between borrowed money and owner capital used to fund operations and growth.
At its core, the ratio measures financial leverage, which magnifies both gains and losses. When a company earns more on borrowed funds than the interest it pays, shareholders benefit from higher returns. When revenue falters, fixed interest obligations remain, and equity holders absorb the shortfall first. A higher ratio signals greater reliance on creditors and a thinner cushion of owner capital to absorb losses. A lower ratio suggests a more conservative capital structure with less exposure to interest-rate shifts, covenant breaches, and refinancing pressure.
Different levels carry different implications:
- Below 1.0: Generally indicates modest leverage, though it can also suggest underused borrowing capacity.
- Between 1.0 and 2.0: Common across many established businesses.
- Persistently above 2.0 or 3.0: Can point to elevated risk, particularly in cyclical industries where earnings swing sharply.
Debt-to-equity can also be distorted by large intangible assets or by share buybacks that reduce equity. Furthermore, capital structures vary widely by sector. Utilities and telecoms carry heavy debt loads as a normal part of regulated, cash-generative operations, while technology and consumer staples firms often operate with very little debt, and banks and insurers follow entirely different leverage conventions.
Efficiency Metrics and Tracking How Well Assets Are Managed
Efficiency metrics show how diligently management converts its asset base into revenue, answering a practical question: for every dollar tied up in assets, how many dollars of sales come back? A company can hold an impressive balance sheet and still stumble if those assets sit idle, so efficiency ratios focus on utilization rather than sheer size.
Asset turnover sits at the center of this family. Calculated as net sales divided by average total assets, it expresses how many times a company turns its asset base over during a period. A retailer moving inventory quickly might post an asset turnover of two or three, while a capital-intensive manufacturer or utility often operates below one. A declining trend over time can signal slowing demand, bloated asset purchases, or aging equipment that no longer pulls its weight.
Related measures isolate specific parts of the balance sheet:
- Receivables turnover and days sales outstanding: Reveal how quickly customers pay, tying efficiency directly to cash flow.
- Fixed asset turnover: Isolates the productive use of property, plant, and equipment.
- Working capital turnover: Shows how hard day-to-day operating funds are working.
A creeping rise in collection days or a steadily falling asset turnover often precedes visible financial strain, giving managers time to adjust purchasing, pricing, or capital spending before the income statement suffers.
How Fast Is Inventory Turning Into Revenue?
Inventory turnover measures how many times a company sells and replaces its stock of goods during a given period. The formula is:
Inventory Turnover = Cost of Goods Sold / Average Inventory
Average inventory is typically calculated by adding the beginning and ending inventory balances for the period and dividing by two, which smooths out seasonal swings. Dividing 365 by the inventory turnover figure gives the days inventory outstanding—the average number of days an item sits on the shelf before it is sold.
A high turnover ratio generally signals brisk sales and lean stocking. Capital is not tied up in idle goods, storage costs stay low, and the risk of obsolescence drops—a vital advantage in fast-moving sectors like fashion or consumer electronics. However, an excessively high figure can mean inventory levels are too thin, leaving the business vulnerable to stockouts and lost sales when demand spikes.
A low ratio suggests sluggish sales, overstocking, or poor purchasing decisions that lock cash up in warehouses. Yet a low figure may also reflect a deliberate strategy, such as stocking up ahead of a busy season or holding slow-moving, high-margin specialty items. Because a grocery chain and a furniture retailer operate on entirely different rhythms, analysts compare this metric against direct industry peers and pair it with gross margin and days sales outstanding to evaluate operational health.
Valuation Metrics
Valuation metrics help investors determine whether a stock’s current market price aligns with its underlying worth. Alongside the price-to-earnings (P/E) ratio, the price-to-book (P/B) ratio relates a company’s stock price to its book value per share.
The P/B ratio is particularly useful for evaluating financial institutions and asset-heavy businesses, where book value provides a stable benchmark. A P/B below 1.0 can imply that the stock is trading for less than the accounting value of its assets, potentially indicating an undervalued opportunity or underlying operational problems.
Valuation ratios can be distorted at economic turning points for cyclical companies, and differing accounting practices can affect book values. Combining P/B and P/E with other fundamental and qualitative factors builds a more informed view of whether a stock is overvalued or undervalued.
Comparing Market Value Using the Price to Earnings Ratio
The price-to-earnings (P/E) ratio shows how much the market is willing to pay for each dollar of a company’s earnings. It is calculated by dividing the current share price by earnings per share (which is net income divided by the number of outstanding shares). A P/E of 20 means investors are paying twenty dollars for every dollar of profit the company generates.
Analysts commonly use two versions of the ratio:
- Trailing P/E: Uses reported earnings from the past twelve months. These historical figures are settled and verifiable, though they may lag behind recent changes in a business.
- Forward P/E: Uses projected earnings for the coming twelve months, typically based on analyst estimates. This incorporates expected growth and offers a view of where a company is heading, but rests on forecasts that may miss the mark.
A high P/E generally signals that investors expect strong future growth and will pay a premium for it, or that the stock is overpriced. A low P/E can indicate that a company is undervalued, that its earnings are viewed as unstable, or that the market expects limited growth ahead.
Comparing P/E works best among businesses of similar size, maturity, and sector. A fast-growing technology firm might reasonably trade at a P/E of 40 while an established utility trades at 12, reflecting their different growth prospects, margins, and risk profiles. Measuring a company’s P/E against its sector average, close competitors, and its own multi-year history reveals whether its current valuation aligns with norms or represents a meaningful shift.
Common Red Flags to Watch for When Calculating Metrics
Financial ratios are only as reliable as the numbers behind them. Analysts watch for three primary categories of warning signs when calculating metrics:
- Inconsistent ratios: Mismatches occur when figures from different statements do not reconcile—such as a current ratio implying ample liquidity while the cash flow statement shows persistent operating outflows, or healthy inventory turnover alongside climbing receivables days. These contradictions usually point to definitional errors, like mixing period-end and average balances, or to operational stress hiding beneath a flattering headline number.
- Deteriorating trends and sudden spikes: Single-period snapshots can mask slow erosion, such as a gross margin slipping a few tenths of a percentage point for three or four consecutive quarters, or a debt-to-equity ratio creeping upward as new borrowings fund working capital. Plotting metrics over at least eight quarters separates seasonal noise from structural decline. Sudden improvements warrant equal scrutiny, as one-off gains, asset sales, or estimate changes can flatter a ratio without real operational improvement.
- Accounting distortions: Revenue recognition shifts, aggressive cost capitalization, altered depreciation schedules, and reserve releases move ratios without changing economic reality. Red flags include growing gaps between reported earnings and operating cash flow, rising days sales outstanding alongside flat revenue, or capitalized expenses that inflate margins relative to peers.
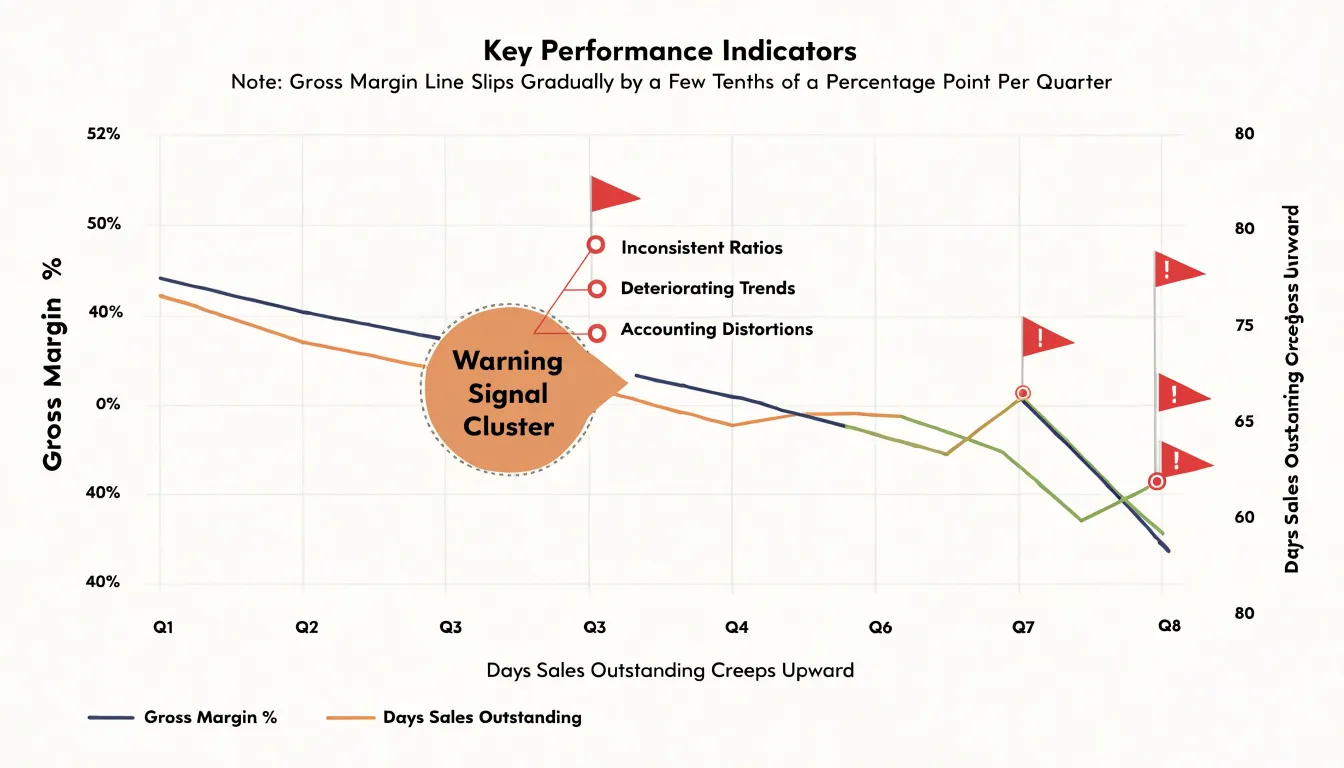
Reading the notes to the financial statements, tracking year-over-year accounting policy changes, and cross-checking ratios against cash-based measures will surface most of these adjustments. While no single flag proves trouble, a cluster of them justifies deeper investigation before relying on the metric.
Frequently Asked Questions
What is the difference between the current ratio and the quick ratio?
The current ratio divides current assets by current liabilities, while the quick ratio uses only cash and cash equivalents, marketable securities, and accounts receivable, then divides by current liabilities. The quick ratio excludes inventory because turning inventory into cash requires selling the goods and then collecting the resulting receivable, both of which take time and carry uncertainty.
What’s the difference between gross profit margin and net profit margin?
Gross profit margin subtracts cost of goods sold from revenue, divides gross profit by revenue, and multiplies by 100; net profit margin divides net income after all operating expenses, interest, taxes, and other charges by revenue. Gross margin isolates the core economics of the product, while net margin reflects the total efficiency of the organization, including overhead and debt servicing.
What does return on equity tell investors and what are its limitations?
Return on equity shows how effectively management uses shareholders’ equity to generate profits; an ROE of 15% means the company generates $0.15 in profit for every dollar of equity invested. It can be boosted by debt, can swing sharply for companies with inconsistent net income, and is not meaningful for firms with negative shareholders’ equity.
Is a high debt-to-equity ratio risky?
A higher debt-to-equity ratio signals greater reliance on creditors and a thinner cushion of owner capital to absorb losses, and a ratio persistently above 2.0 or 3.0 can point to elevated risk, particularly in cyclical industries. The ratio can be distorted by large intangible assets or share buybacks, and capital structures vary widely by sector.
How do you calculate inventory turnover and what does it indicate?
Inventory turnover is cost of goods sold divided by average inventory, and dividing 365 by the turnover figure gives days inventory outstanding. A high turnover generally signals brisk sales and lean stocking, but an excessively high figure can mean inventory is too thin and leaves the business vulnerable to stockouts, while a low ratio suggests sluggish sales, overstocking, or a deliberate stocking strategy.
What does a high P/E ratio mean?
A high P/E generally signals that investors expect strong future growth and will pay a premium, or that the stock is overpriced; a low P/E can indicate that a company is undervalued, that its earnings are viewed as unstable, or that the market expects limited growth ahead. Comparing P/E works best among businesses of similar size, maturity, and sector.