
Free Cash Flow
Free cash flow is the cash a company generates from operations minus capital expenditures, representing money left for dividends, buybacks, debt reduction, or reinvestment. Calculated as operating cash flow minus capex, it strips out accrual accounting distortions, making it harder to manipulate than net income and a key measure of financial resilience.
Table of Contents
- What free cash flow really tells you about a business
- Free cash flow formula
- Operating cash flow versus capital expenditures
- Why net income can lie while cash flow tells the truth
- How to calculate levered versus unlevered free cash flow
- Finding the right numbers on a company financial report
- How investors use free cash flow to spot dividend traps
- Red flags
What free cash flow really tells you about a business
Free cash flow is the money a business has left over after paying for the capital expenditures required to keep its operations running and growing. That simple definition carries real explanatory power. When you look at free cash flow, you are looking at the cash that management actually controls and can deploy at its discretion. That pool of money is what funds growth initiatives, whether that means building new facilities, developing products, or entering new markets. It is what supports dividend payments and share buybacks. It is what allows a company to pay down debt and strengthen its balance sheet. And it is what provides a buffer when revenue suddenly contracts during an economic downturn. A business that generates healthy free cash flow has options. A business that does not is dependent on outside financing, which can become scarce exactly when it is needed most.
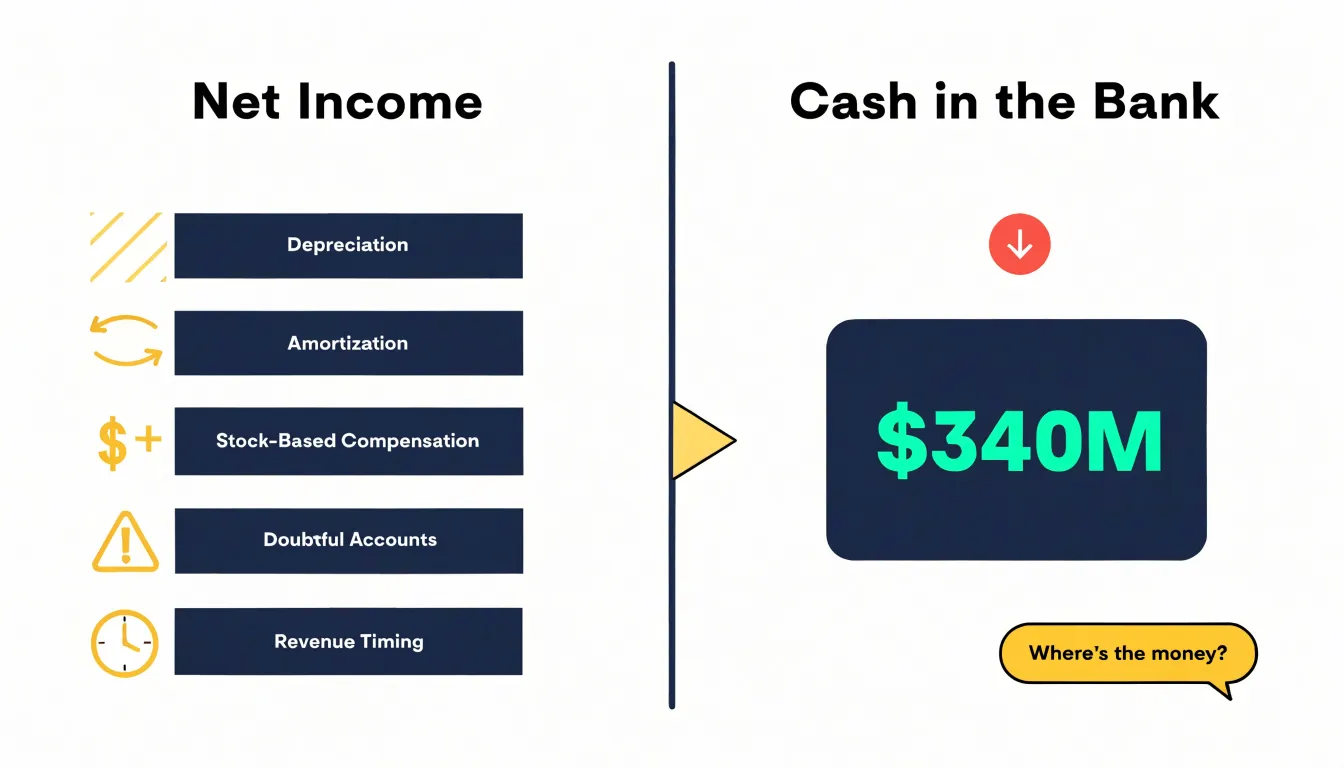
The comparison with accounting profits is where free cash flow becomes especially instructive. Net income is shaped by a long list of estimates and non-cash items: depreciation schedules, amortization of intangibles, provisions for doubtful accounts, revenue recognition timing, and stock-based compensation, among others. These judgments are legitimate, yet they create distance between reported earnings and the cash that lands in the bank. A company can report consistent profits while steadily consuming cash, and that pattern can persist for years before the strain becomes visible. Free cash flow sidesteps most of this by starting from actual cash generated by operations and subtracting the real money spent on capital assets. It is harder to dress up.
This is why lenders, acquirers, and long-term investors pay close attention to free cash flow trends. A steadily rising FCF figure suggests a business is converting its sales into spendable cash with increasing efficiency, which points to pricing power, cost discipline, or both. A declining figure, even alongside growing profits, invites a closer look at working capital, capital intensity, and the quality of earnings. Free cash flow is not a perfect measure, and it can be volatile from year to year as capital spending fluctuates. Used thoughtfully across several periods, though, it offers a clear-eyed view of a company’s financial resilience and its capacity to reward the people who own it.
Free cash flow formula
The formula for free cash flow is compact: free cash flow equals operating cash flow minus capital expenditures. Operating cash flow, found on the cash flow statement, captures the cash a business generates from its core operations after paying for day-to-day expenses, collecting from customers, and paying suppliers and employees. Capital expenditures, usually listed under investing activities on the same statement, represent the money spent on long-term assets such as property, plant, equipment, and software. Subtracting the second figure from the first isolates the cash left over after the company has maintained and expanded its asset base. That leftover cash is what can be returned to shareholders through dividends and buybacks, used to pay down debt, or reinvested in growth.
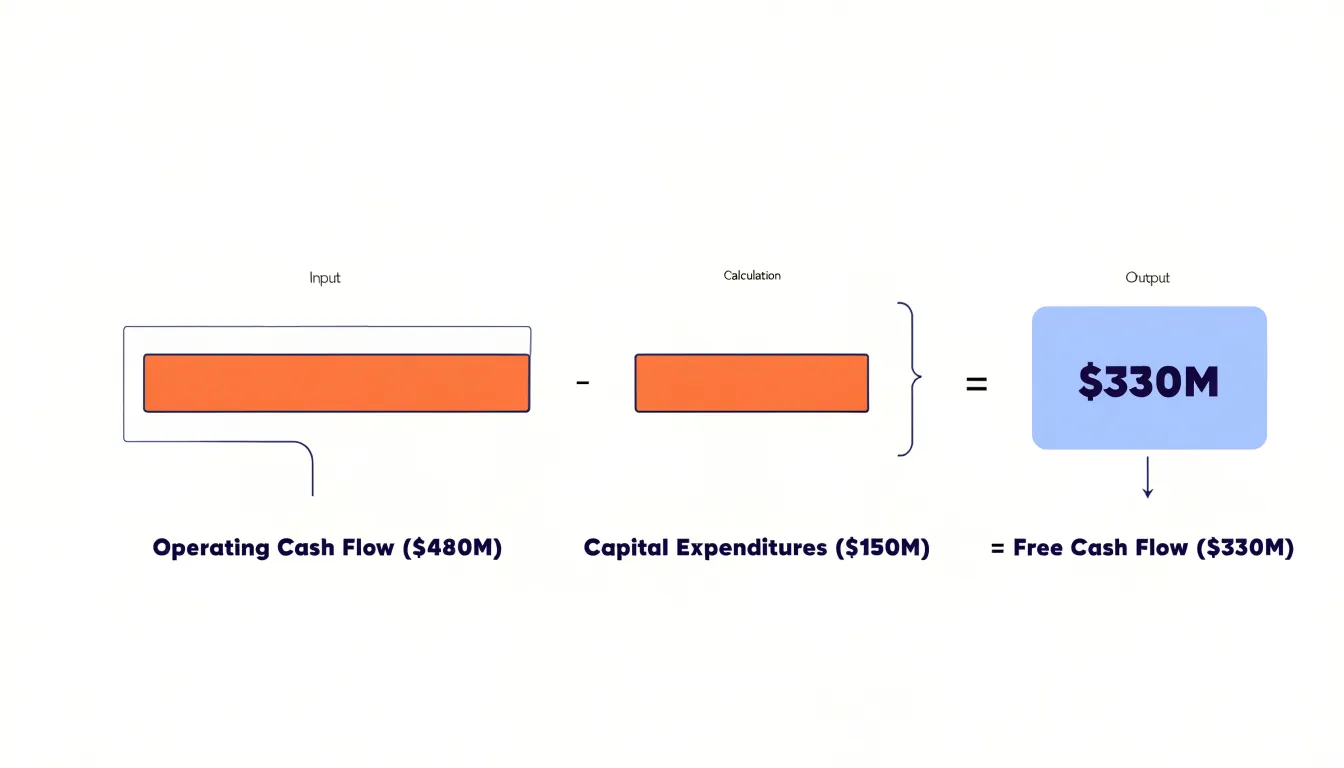
A worked example makes the calculation concrete. Suppose a company reports operating cash flow of $480 million for the year. On the investing section of its cash flow statement, purchases of property and equipment total $150 million, with no asset sales to offset them. Subtracting $150 million from $480 million gives free cash flow of $330 million. If the company had also sold an old facility for $20 million, proceeds from asset sales would typically be netted against purchases, making capital expenditures $130 million and free cash flow $350 million. Either way, the structure of the calculation stays the same.
To perform this yourself, start with the consolidated statement of cash flows rather than the income statement, since accrual accounting can distort the picture of cash generation. Locate the line labeled net cash provided by operating activities. Then move to the investing activities section and identify capital expenditures, often described as purchases of property and equipment or payments for capital assets. Subtract the capital expenditure figure from operating cash flow. A positive result indicates the business funds its own reinvestment and still has cash to spare; a negative result signals that operations are not covering the cost of maintaining the asset base, which warrants closer scrutiny of the company’s financing needs. Running this calculation across several years reveals whether free cash flow is growing steadily, fluctuating with the business cycle, or deteriorating, giving investors a clearer view of the cash engine underneath reported earnings.
Operating cash flow versus capital expenditures
Operating cash flow and capital expenditures are two fundamental components that together define free cash flow. Operating cash flow represents the cash generated from a company’s core business operations. It starts with net income and adjusts for non-cash items like depreciation and changes in working capital, such as receivables, inventory, and payables. This figure reflects the actual cash inflows and outflows from day-to-day activities, excluding financing and investing activities. A positive operating cash flow indicates that the company’s operations are producing enough cash to sustain and grow the business.
Capital expenditures, on the other hand, are investments in long-term assets like property, plant, and equipment. These outflows are necessary to maintain or expand the company’s asset base, which supports future operations. Capital expenditures are reported in the investing activities section of the cash flow statement. They represent cash spent on acquiring or upgrading physical assets, which are essential for maintaining competitiveness and driving growth.
The distinction between these two is crucial because free cash flow is calculated as operating cash flow minus capital expenditures. Operating cash flow shows how much cash the business generates from its operations, while capital expenditures show how much of that cash is reinvested to sustain and grow the asset base. Both are essential: without operating cash flow, there would be no funds to invest; without capital expenditures, the company’s assets would deteriorate, eventually impairing its ability to generate cash. By subtracting capital expenditures from operating cash flow, investors can see how much cash is available for distribution to shareholders, debt reduction, or other discretionary uses. This makes both metrics indispensable for a comprehensive assessment of a company’s financial health and its ability to create value.
Why net income can lie while cash flow tells the truth
Net income is built on the accrual basis of accounting, which records revenue when it is earned and expenses when they are incurred, regardless of when cash actually changes hands. This convention produces a smoother, more economically meaningful measure of periodic performance, yet it also opens the door to distortions that can make reported earnings diverge sharply from the cash a business actually generates. Non-cash items are the most obvious source of this gap. Depreciation and amortization reduce net income without consuming any cash in the period. Stock-based compensation is recorded as an expense even though no cash leaves the company. Impairments, write-downs, and provisions for doubtful receivables all lower reported profit while leaving the bank balance untouched. Each of these entries is legitimate, but each one widens the distance between the income statement and the movement of real money.
Timing differences create a second layer of distortion. A company may recognize revenue on a large sale before the customer pays, booking a receivable and boosting net income while cash collection slips into a later period. Conversely, a firm can receive cash upfront for goods or services delivered later, recording deferred revenue as a liability while cash sits in the bank. Inventory builds absorb cash that never appears as an expense until the goods are sold. Aggressive revenue recognition, channel stuffing, or stretching payables can all flatter near-term earnings while quietly undermining the cash position. In each case, net income tells a story about accounting events, and that story can drift far from economic reality.
Cash flow statements strip away these accrual artifacts. By starting with net income and adjusting for non-cash charges and working capital movements, the indirect method reconstructs the actual cash generated or consumed by operations. The result is harder to manipulate through accounting choices, since cash either arrives in the bank account or it does not. A company that reports rising profits alongside persistently negative operating cash flow is a warning sign; one that converts most of its earnings into cash demonstrates genuine earning power. For investors and analysts, free cash flow, which subtracts capital expenditures from operating cash flow, offers the clearest view of the money available for debt repayment, dividends, buybacks, and reinvestment. Earnings remain useful, but cash flow serves as the ground truth against which those earnings should be tested.
How to calculate levered versus unlevered free cash flow
Free cash flow can be measured in two distinct ways depending on whether the effect of debt financing is included in the calculation. The distinction matters because it determines which cash flows are matched against which discount rate in a valuation.
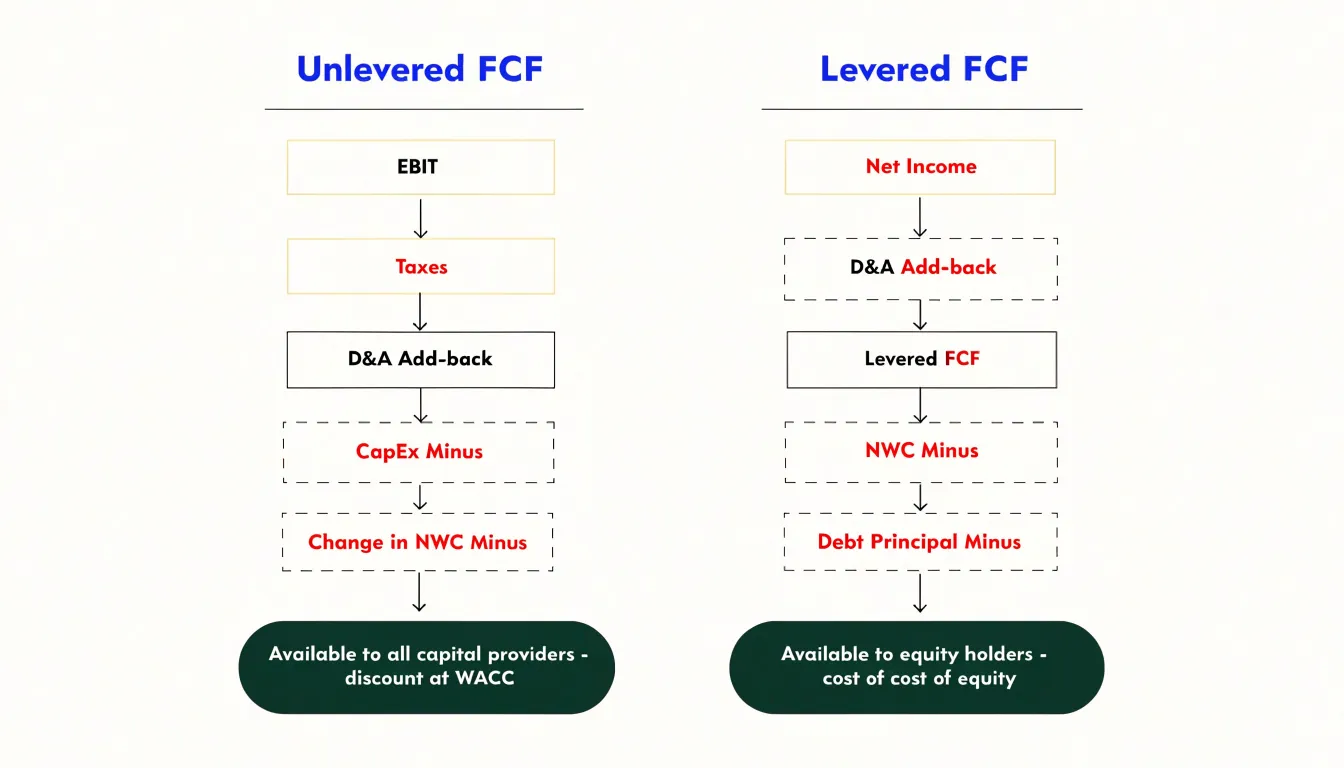
Unlevered free cash flow represents the cash a company generates from its operations before any payments to lenders or deductions related to debt. The standard formula starts with earnings before interest and taxes (EBIT), applies the relevant tax rate to arrive at a normalized tax figure (often expressed as EBIT multiplied by one minus the tax rate), then adds back non-cash charges such as depreciation and amortization. From that subtotal, analysts subtract capital expenditures and the change in net working capital. The result is the cash available to all capital providers, both equity holders and lenders, which is why it is often called free cash flow to the firm.
Levered free cash flow, by contrast, reflects the cash left for equity holders after the company has serviced its debt. The calculation begins with net income, adds back depreciation and amortization along with other non-cash items, subtracts capital expenditures and changes in working capital, and then deducts mandatory debt payments such as principal repayments. Some analysts also adjust for interest expense depending on whether it was already captured in net income. The output is free cash flow to equity, the cash that could in principle be distributed to shareholders.
In valuation, the choice hinges on the discount rate being applied. Unlevered free cash flow is paired with the weighted average cost of capital in an enterprise value analysis, since both measures treat the business as a whole independent of its capital structure. Levered free cash flow is paired with the cost of equity in a direct equity valuation, because it already reflects the burden of debt service. Using unlevered cash flow with the cost of equity, or levered cash flow with WACC, produces inconsistent results.
A practical rule of thumb: use unlevered free cash flow when comparing companies with different capital structures or when valuing the operating business as a whole. Use levered free cash flow when the analysis centers on what remains for shareholders, particularly in leveraged transactions or situations where debt terms materially affect distributable cash.
Finding the right numbers on a company financial report
The cash flow statement is the primary document for locating operating cash flow, typically found in the section labeled “Cash Flows from Operating Activities.” This subtotal appears after adjustments for non-cash items such as depreciation and amortization, changes in working capital, and other accrual corrections. On most published financial reports, the line item is clearly labeled “Net Cash Provided by Operating Activities” or a close variant, and it sits near the bottom of the operating activities section, just before the investing activities section begins. Analysts should read the full section rather than grabbing the first cash-related figure they see, since intermediate subtotals such as “cash generated from operations” can differ from the final operating cash flow number after interest and taxes are accounted for.
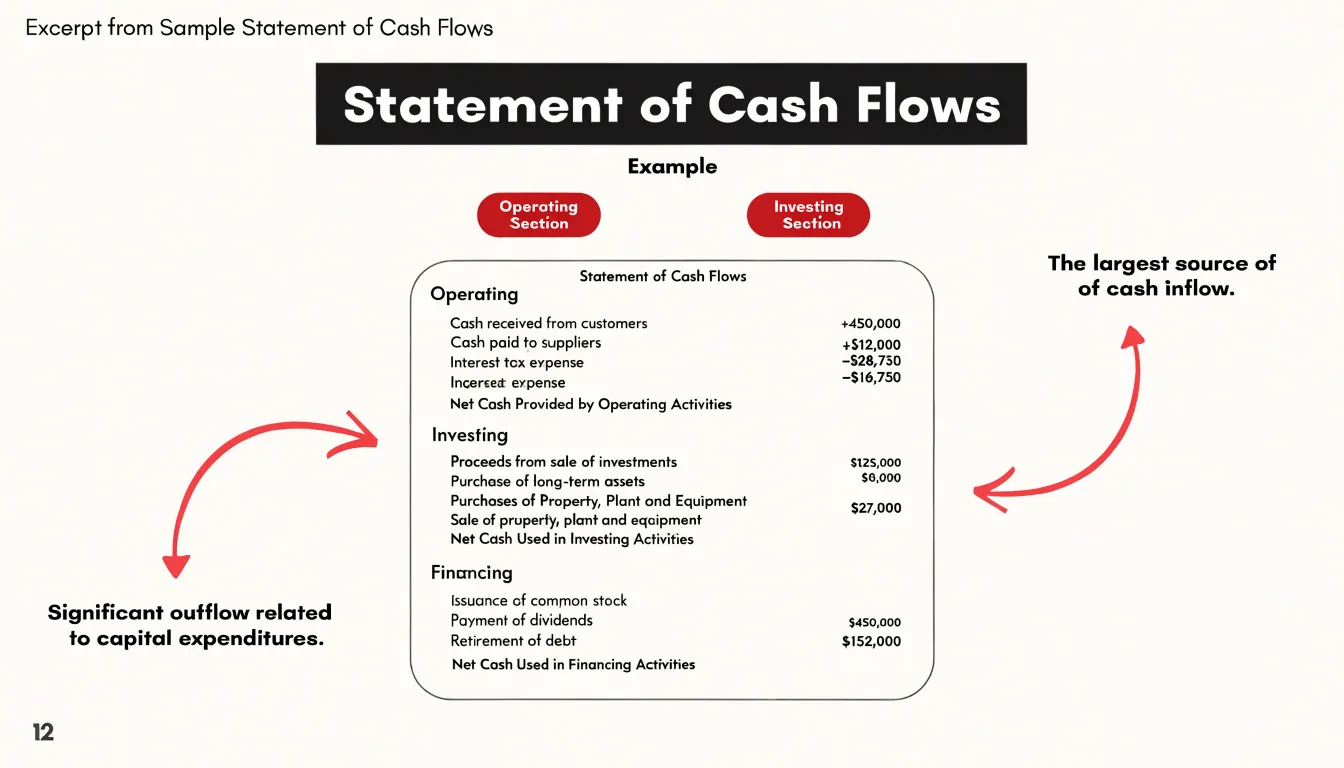
Capital expenditures are recorded within the investing activities section of the same statement. Look for labels such as “Purchases of Property, Plant and Equipment,” “Capital Expenditures,” or “Additions to Fixed Assets.” These figures usually appear as negative numbers reflecting cash outflows. Some companies combine several asset categories into a single line, while others break purchases down by asset class, so it helps to scan the notes to the financial statements for a more granular breakdown. The balance sheet offers a useful cross-check: comparing the gross property, plant and equipment balance across two periods, adjusted for disposals and depreciation, should roughly reconcile with the capex figure reported on the cash flow statement.
Accuracy depends on a few disciplined habits. First, confirm the reporting period and currency match across every document you use. Second, watch for restatements, since comparative figures from prior years may have been revised. Third, distinguish between total capex and maintenance capex, as some companies disclose only the former. Fourth, be alert to capitalized software, capitalized interest, and finance leases, which can sit outside the standard property, plant and equipment line. Finally, reconcile the cash flow statement against the balance sheet and income statement, checking that opening and closing cash balances tie out. When figures conflict, the notes to the accounts usually resolve the discrepancy. Documenting each source and line item as you extract it keeps the calculation of free cash flow transparent and repeatable.
How investors use free cash flow to spot dividend traps
A dividend trap emerges when a stock offers an unusually high yield that looks attractive on the surface but proves unsustainable over time. Investors who rely on free cash flow analysis gain a practical tool for detecting this situation before it damages their portfolio. The core comparison involves placing total dividends paid against the free cash flow the business generates. Free cash flow represents the cash left after a company funds its capital expenditures, and that pool of cash is what ultimately supports dividend payments, share buybacks, and debt reduction. When dividends paid consistently exceed free cash flow, the company is distributing more cash than its operations produce, and the shortfall must be covered by borrowing, selling assets, or issuing new shares.
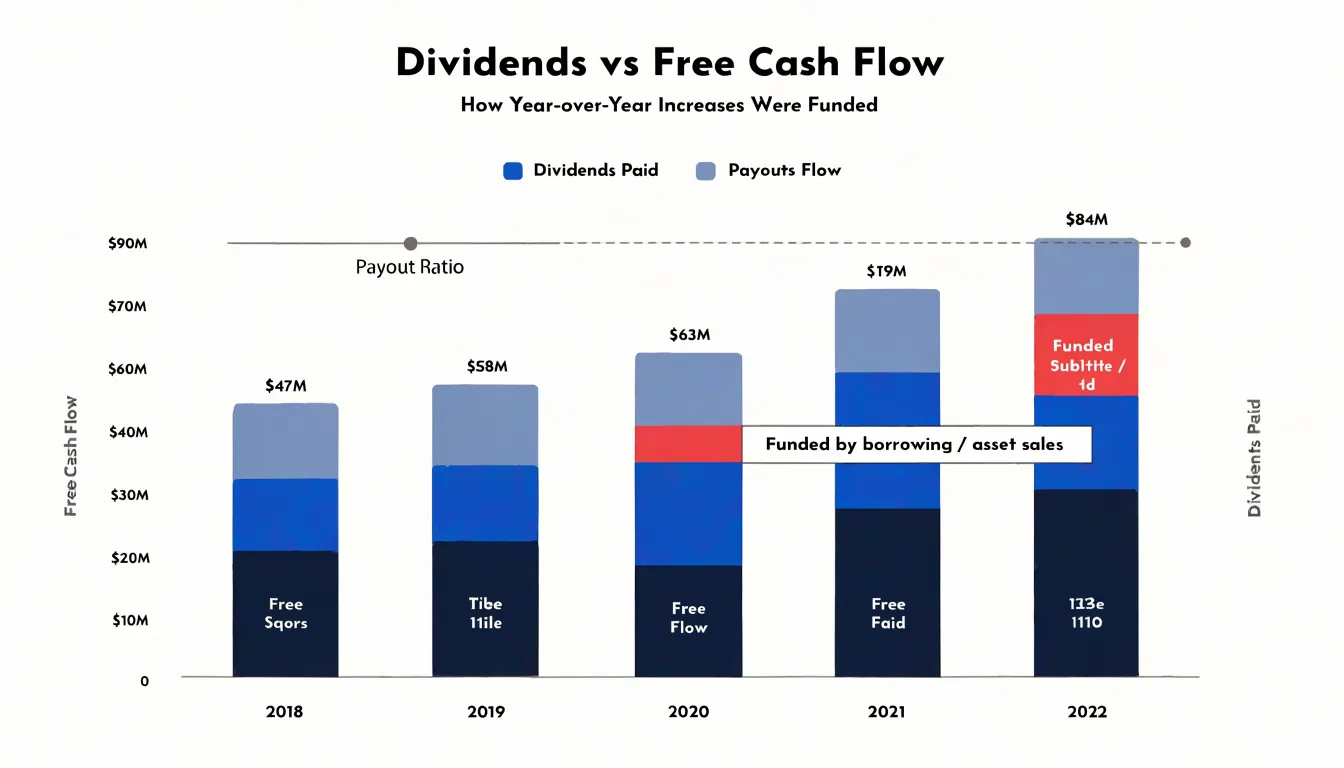
A payout ratio calculated against free cash flow rather than accounting earnings offers a clearer view of sustainability. Earnings can be shaped by non-cash items such as depreciation or one-time gains, while free cash flow tracks the actual money moving through the business. An investor who sees dividends consuming 90 or 100 percent of free cash flow recognizes that little margin remains for error. A ratio above 100 percent signals that the dividend is being funded from sources outside operating cash generation, a pattern that rarely persists without consequences.
Investors use this analysis as a screening step. They gather several years of dividend payments and free cash flow figures to distinguish temporary dips from persistent imbalances. A single year of elevated payout might reflect a cyclical downturn or a heavy capital investment cycle, while a multi-year trend of dividends outpacing free cash flow points to structural weakness. By examining whether free cash flow covers dividends with a reasonable cushion, investors can separate companies with durable payout policies from those borrowing to maintain appearances.
This approach also informs decisions about yield. A high yield paired with a declining or negative free cash flow trend raises the probability of a dividend cut, which typically triggers a sharp price decline. Investors who monitor free cash flow relative to dividends position themselves to exit or avoid such positions before the cut arrives, protecting both income and principal.
Red flags
Negative free cash flow is not automatically a sign of trouble. Early-stage companies, firms building new plants, and businesses investing heavily in growth can all run negative free cash flow for a time while they lay the foundation for future earnings. The signal becomes a red flag when negative free cash flow persists across multiple periods without a clear path to positive territory, or when it appears alongside warning signs that suggest deeper financial stress. One of the most important red flags is consistent negative free cash flow despite reported profits. When a company posts net income on its income statement but continually burns cash in operations, the gap between accounting profit and cash reality deserves scrutiny. Large accruals, aggressive revenue recognition, or difficulty converting sales into collected cash can all cause reported profits to diverge from cash generation. Over time, a business that reports earnings while its cash balance erodes is a business that may be funding its income statement with borrowed money or asset sales. Another red flag is heavy capital spending that fails to produce returns. Capital expenditures are classified as investing outflows, so a company pouring money into new facilities, equipment, or acquisitions will show depressed free cash flow by definition. That is acceptable when the spending eventually translates into higher revenue, margins, or market share. The danger arises when capital spending continues year after year without visible improvement in operating results. Persistent outlays without returns can signal poor capital allocation, projects running over budget, or an industry where competitive pressure consumes investment faster than it can generate payback. Rising debt used to cover cash shortfalls is perhaps the clearest warning sign. When operating and investing outflows exceed cash on hand, companies often turn to credit lines, bond issuance, or other borrowing to bridge the gap. A modest amount of debt to fund growth can be prudent, but an escalating reliance on debt to cover recurring cash deficits points to a structural problem. Interest costs rise, covenants tighten, and the company becomes more vulnerable to refinancing risk or a downturn in its core business. Watching these red flags together, rather than in isolation, gives investors a clearer picture of whether negative free cash flow reflects deliberate investment or mounting financial distress.
Frequently Asked Questions
What is free cash flow in simple terms?
Free cash flow is the money a business has left over after paying for the capital expenditures required to keep its operations running and growing. It is cash that management controls and can use for growth, dividends, buybacks, debt repayment, or a buffer during a downturn.
How do you calculate free cash flow?
Free cash flow equals operating cash flow minus capital expenditures. Operating cash flow is found on the cash flow statement, and capital expenditures are usually listed under investing activities.
Why can a company report profits but still have negative free cash flow?
Net income is shaped by accruals, non-cash items, and timing differences, while free cash flow starts from operating cash flow and subtracts capital expenditures. A company can report profits while burning cash, and consistent negative free cash flow despite reported profits is a red flag.
What is the difference between levered and unlevered free cash flow?
Unlevered free cash flow is generated from operations before any payments to lenders or deductions related to debt, making it cash available to all capital providers. Levered free cash flow is the cash left for equity holders after the company has serviced its debt.
Is negative free cash flow always a bad sign?
No. Early-stage companies, firms building new plants, and businesses investing heavily in growth can run negative free cash flow for a time. It becomes a red flag when negative free cash flow persists across multiple periods without a clear path to positive territory or appears alongside other warning signs.
How can investors use free cash flow to spot dividend traps?
Investors compare total dividends paid with the free cash flow the business generates; when dividends consistently exceed free cash flow, the shortfall must be covered by borrowing, selling assets, or issuing new shares. A payout ratio above 100 percent signals that the dividend is being funded from sources outside operating cash generation.