
Gross Margin
Gross margin is the percentage of revenue left after subtracting cost of goods sold (COGS), calculated as (Revenue − COGS) ÷ Revenue × 100. It shows how efficiently a company converts direct production costs into sales dollars, and the remainder must cover operating expenses like rent, salaries, and marketing before generating net profit.
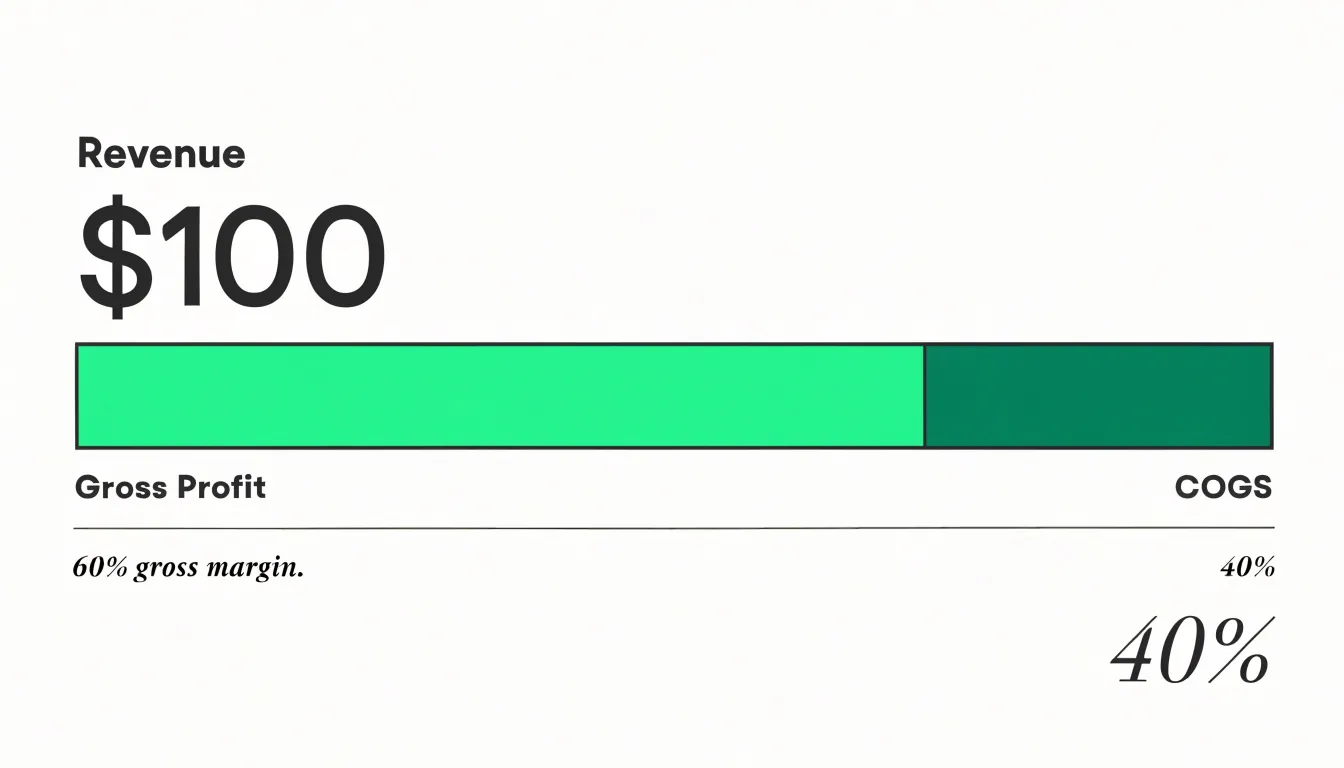
Table of Contents
- What gross margin actually tells you about business health
- Gross margin versus gross profit
- The core formula for calculating your gross margin percentage
- Step by step example
- What counts as cost of goods sold and what to leave out
- How do you know if your gross margin is healthy for your industry
- Strategic pricing tweaks
- Negotiating with suppliers to lower direct production costs
- Reducing waste and inefficiency in your daily product delivery
- Tracking gross margin trends over time to make smarter business decisions
What gross margin actually tells you about business health
Gross margin measures the percentage of revenue that remains after subtracting the direct costs of producing goods or delivering services, commonly known as cost of goods sold. That remaining percentage represents the money available to run the rest of the business. When you calculate gross margin, you are essentially asking how efficiently your core operations convert raw inputs into sellable output. A company with a 60 percent gross margin keeps sixty cents from every sales dollar before accounting for overhead, which gives it substantial room to fund rent, salaries, marketing, and research while still leaving something behind as profit. This figure sits at the foundation of the income statement because every expense that follows depends on it. Overhead does not shrink simply because margins do; fixed costs like insurance, administrative salaries, and facility leases remain constant regardless of production efficiency. When gross margin falls, the business must either find ways to cut overhead or accept thinner operating and net profits. A low gross margin places a business in a fragile position where a small increase in supplier prices or a modest sales downturn can push the company into a loss. Declining margins over several periods deserve close attention because they often point to specific underlying problems. The company may be discounting aggressively to win sales, which erodes the pricing power that healthy margins depend on. Input costs may have risen without a corresponding price adjustment, meaning the business is absorbing inflation rather than passing it along. Production inefficiencies, waste, or poorly negotiated supplier contracts can also compress margins quietly over time. Tracking gross margin across months and comparing it against industry benchmarks gives managers an early warning system. Rising margins suggest that pricing decisions and cost controls are working in tandem, while falling margins invite a review of supplier terms, production workflows, and the discounting practices used by the sales team. In this way, gross margin serves as a clear indicator of operational health that guides decisions before they appear in the bottom line.
Gross margin versus gross profit
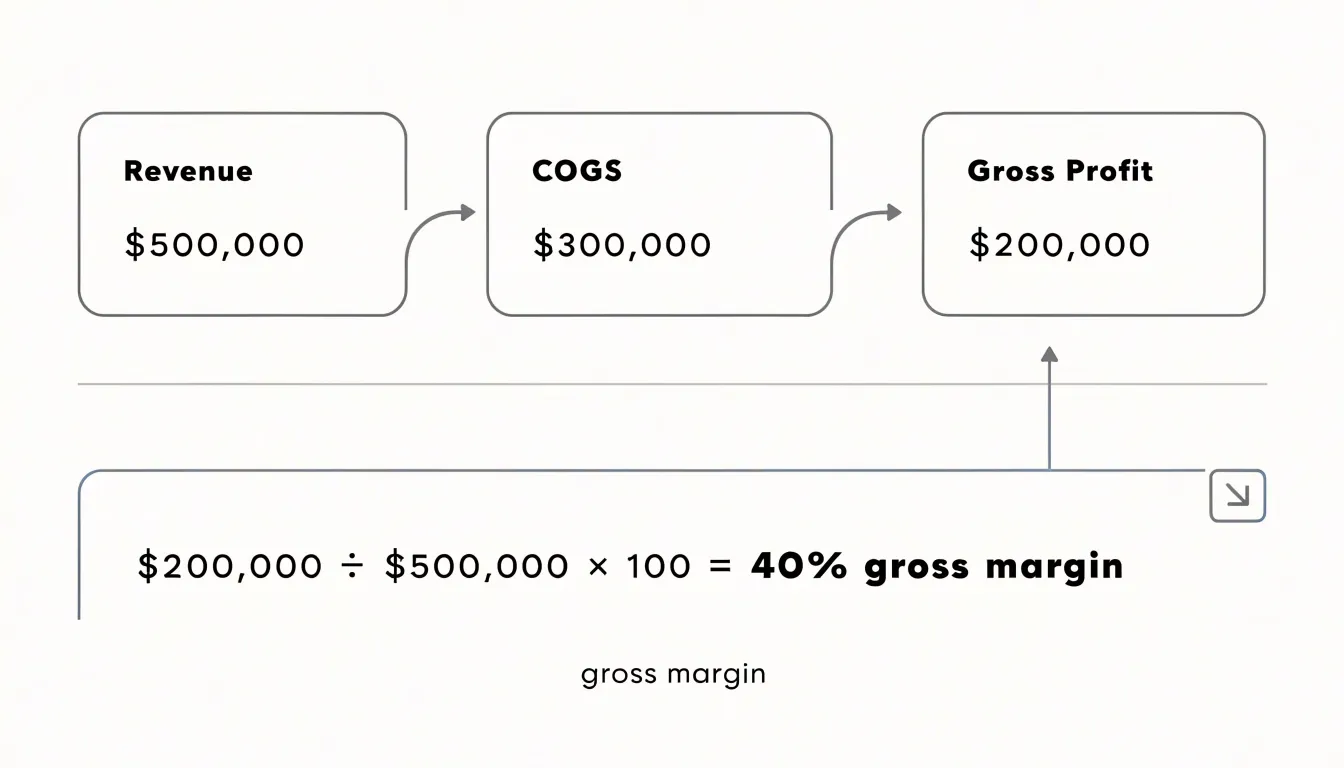
Gross profit is the absolute dollar figure a company retains after subtracting the cost of goods sold from revenue. If a business generates $500,000 in revenue and incurs $300,000 in COGS, its gross profit is $200,000. This number tells you how much money is left to cover operating expenses, interest, taxes, and eventually profit. Gross margin expresses that same relationship as a percentage of revenue. In this example, dividing $200,000 by $500,000 yields a gross margin of 40%, meaning forty cents of every revenue dollar remains after accounting for direct production costs. The dollar amount and the percentage describe the same underlying economics, yet they serve different analytical purposes.
The limitation of gross profit as a standalone figure becomes clear when comparing across products. A company might sell a premium item that generates $50 gross profit per unit and a budget item that generates $10. Looking only at dollar amounts, the premium product appears five times more valuable. Suppose the premium item sells for $500, giving it a 10% gross margin, while the budget item sells for $25, giving it a 40% gross margin. The budget product actually converts each revenue dollar into profit far more efficiently. A business relying solely on gross profit dollars might overinvest in low-margin products, missing the opportunity to scale offerings that deliver stronger percentage returns on every sale.
Comparisons across time periods present a similar problem. A company reporting $2 million in gross profit this year versus $1.5 million last year seems to be improving. If revenue doubled over the same span, however, gross margin may have fallen sharply, indicating that costs are rising faster than sales or that the company is discounting heavily to drive volume. The dollar figure masks deteriorating unit economics, while the percentage exposes them immediately.
Competitive benchmarking depends on percentage comparisons as well. A small competitor with $10 million in revenue and $4 million in gross profit operates at a 40% margin. A larger rival with $100 million in revenue and $25 million in gross profit operates at 25%. The smaller company runs a more efficient operation on every dollar it sells, even though the larger firm reports a much bigger gross profit number. Analysts, investors, and managers use gross margin precisely because it normalizes for size, making businesses of different scales directly comparable. Gross profit answers how much money a company makes from its core operations; gross margin answers how well it makes that money, and the second question drives better decisions.
The core formula for calculating your gross margin percentage
The core formula for calculating your gross margin percentage is straightforward: (Revenue – Cost of Goods Sold) / Revenue × 100. The result expresses, as a percentage, how much of each dollar of sales remains after covering the direct costs of producing or acquiring the goods you sold. To walk through a quick example, imagine a company records $500,000 in revenue for the year and incurs $300,000 in Cost of Goods Sold. Subtracting COGS from revenue leaves $200,000 in gross profit. Dividing that $200,000 by the $500,000 in revenue produces 0.4, and multiplying by 100 converts the figure into a gross margin of 40%. In practical terms, forty cents of every sales dollar stays with the business after direct production costs, available to cover operating expenses such as rent, marketing, and salaries, and ultimately to contribute to net profit.
A detail worth settling before you run the numbers is which revenue figure belongs in the denominator. The formula works with either gross revenue or net sales, yet the two produce different results and tell different stories. Gross revenue captures total sales before any deductions. Net sales subtract returns, allowances, and discounts, reflecting what the business actually kept from its sales activity. Because COGS is recorded against the goods that customers ultimately retain, pairing it with net sales keeps the numerator and denominator consistent and yields a more accurate picture of margin. A company with heavy return rates or frequent discounting can show a meaningfully different margin depending on which revenue line it uses, so consistency matters as much as the choice itself. Whichever figure you select, apply it the same way across every period you compare, and state clearly in your reporting which revenue definition underlies the calculation. That consistency allows month-over-month and year-over-year comparisons to reflect genuine changes in profitability rather than shifts in accounting convention, and it gives anyone reading your margin figures the context needed to interpret them correctly.
Step by step example
To see gross margin in action, consider a fictional retail store called Green Leaf Garden Supply. In a given quarter, the store records total revenue of $120,000 from sales of plants, pots, soil, and tools. The next step is to determine cost of goods sold (COGS), which includes all direct costs associated with the merchandise sold. For Green Leaf, COGS comprises the purchase price of inventory ($60,000), inbound freight charges ($5,000), and the cost of acquiring and preparing goods for sale, such as repackaging supplies ($2,000). Adding these gives a total COGS of $67,000.
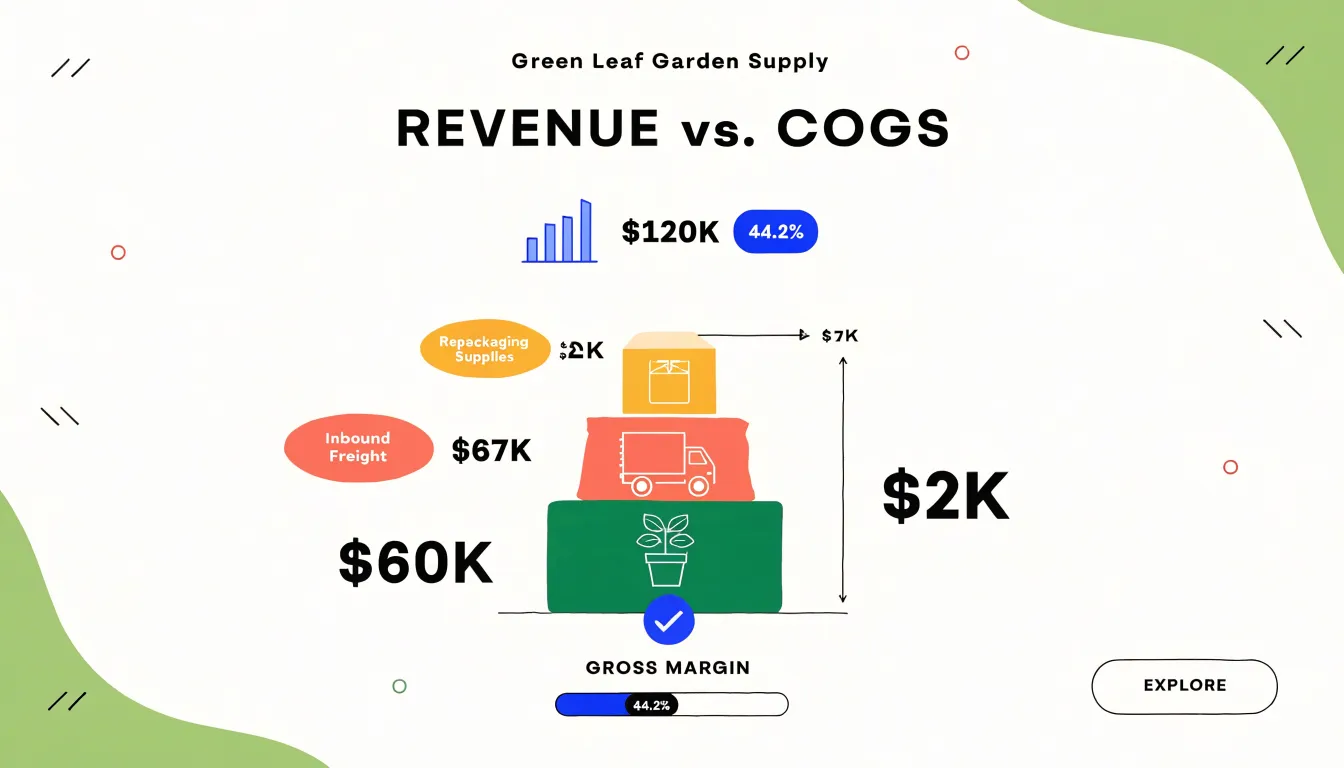
Gross profit is revenue minus COGS: $120,000 – $67,000 = $53,000. To express this as a percentage, divide gross profit by revenue and multiply by 100: ($53,000 / $120,000) × 100 = 44.2%. This means Green Leaf retains about 44 cents from every sales dollar to cover operating expenses and generate profit.
When calculating gross margin, several pitfalls can distort the result. First, avoid including operating expenses such as rent, utilities, or administrative salaries in COGS; these belong below the gross profit line. Second, be consistent with freight costs: inbound freight is typically part of COGS, while outbound shipping to customers may be treated as an operating expense or as a reduction of revenue, depending on accounting policy. Third, account for inventory changes properly: if the store’s inventory increased during the period, COGS should reflect only the cost of goods actually sold, not all purchases. Fourth, watch for discounts and returns; these reduce revenue and should be netted against sales, while the associated cost of returned goods should be removed from COGS. Finally, be mindful of shrinkage—theft, damage, or obsolescence—which increases COGS and lowers gross margin, so it should be estimated and included. By following these steps and avoiding common errors, a retail business can accurately assess its gross margin and make informed decisions about pricing and inventory management.
What counts as cost of goods sold and what to leave out
Cost of goods sold (COGS) represents the direct costs associated with producing the goods or services a company sells. To calculate gross margin accurately, you must clearly distinguish between costs that belong in COGS and those that are operating expenses. COGS typically includes the cost of raw materials and components that become part of the finished product. It also includes direct labor—wages and benefits for employees who are directly involved in manufacturing or delivering the product. Freight-in, the cost of shipping materials or goods to your facility, is another includable item, as are any direct production supplies or subcontractor costs tied to specific units. Purchase returns and allowances that reduce material costs should also be factored in. The key is that these costs vary directly with production volume and can be traced to individual units.
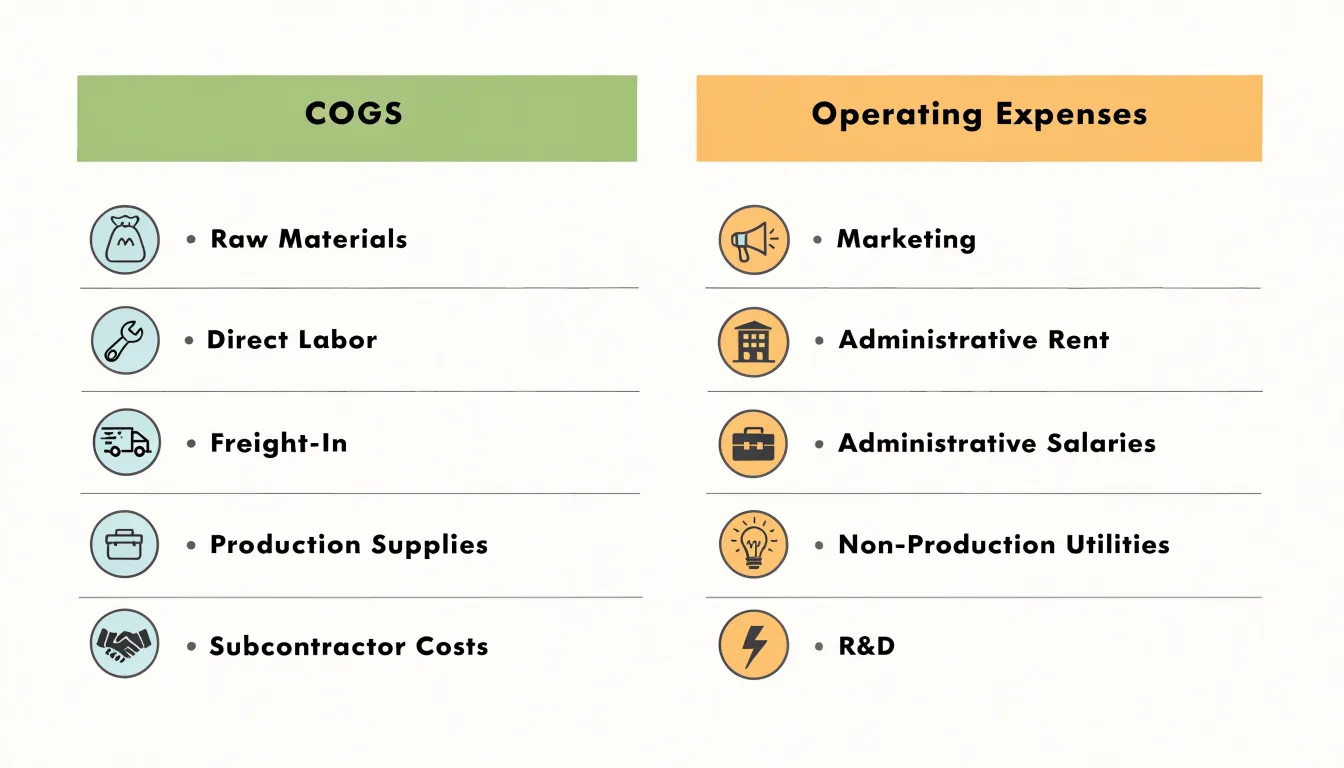
Operating expenses, on the other hand, are the costs of running the business that are not directly tied to production. Marketing and advertising expenses, rent for administrative offices, administrative salaries, and utilities for non-production facilities are classic examples. These should be excluded from COGS and reported below the gross margin line. Similarly, research and development, depreciation of office equipment, and sales commissions are operating expenses. The distinction matters because misclassifying these costs can distort gross margin and obscure the true profitability of your products.
Consistency is crucial when categorizing costs. Establish clear written policies that define what goes into COGS and apply them uniformly across periods. For example, decide whether to include inbound freight in COGS or as a separate line item, and stick with that choice. Review your chart of accounts to ensure that similar costs are always treated the same way. Train your accounting staff on these policies and perform regular reconciliations to catch inconsistencies. By maintaining consistent categorization, you make your gross margin calculations reliable and comparable over time, which supports better decision-making and clearer financial analysis.
How do you know if your gross margin is healthy for your industry
Benchmarking your gross margin begins with gathering reliable industry averages, which serve as a reference point rather than a verdict. Trade associations, industry surveys, financial databases, and public filings from comparable companies all offer useful ranges. The key is to use recent data and to look at a distribution of margins rather than a single figure, since averages can hide wide spreads between top and bottom performers. Once you have a benchmark range, you can see whether your margin sits near the middle, at the high end, or below the typical band for your sector. That comparison gives you a starting question to investigate rather than a conclusion to accept.
Variation across companies in the same industry is normal, and several factors explain most of it. Business model matters greatly: a company selling software or specialized services typically carries much higher gross margins than a distributor moving physical goods, even when both operate in adjacent markets. Scale also shapes margin, because larger purchasers often negotiate better input costs and spread fixed production overhead across more units, while smaller players may pay more per unit and run less efficient operations. Geography introduces further differences through labor costs, shipping distances, tariffs, and local pricing power. Mix of products or customers can shift margins too, since a few high-margin offerings can lift the overall figure while a large low-margin contract can drag it down. Recognizing these drivers helps you compare yourself to the right peers rather than to an undifferentiated average.
Interpreting your margin relative to peers requires context. A margin below the industry range may signal pricing weakness, input cost problems, or an inefficient cost structure, but it may also reflect a deliberate strategy such as aggressive pricing to win market share. A margin above the range can indicate strong pricing power or cost discipline, though it may also point to underinvestment, conservative accounting, or a niche position that is difficult to sustain. The most useful approach is to compare trends over several years and against the closest comparable companies, then ask what specifically drives any gap. Tracking your margin alongside peers over time reveals whether differences are structural or temporary, and that understanding turns a simple benchmark into a practical guide for pricing, sourcing, and cost decisions.
Strategic pricing tweaks
Strategic pricing tweaks offer a powerful lever for improving gross margin, but they require careful execution to avoid alienating the customers who matter most. The core idea is to raise prices in a way that reflects the value your product delivers, rather than applying a blanket increase. Value-based pricing starts with understanding what your best customers gain from your offering—time saved, revenue generated, risk reduced—and setting prices that capture a fair share of that value. This approach often reveals that loyal, high-usage customers are willing to pay more because the product is deeply embedded in their workflows. Tiered offerings provide another path: by creating differentiated packages, you can raise prices on premium tiers while keeping entry-level options accessible. This segmentation allows you to extract more value from customers who need advanced features without imposing a painful increase on price-sensitive segments. Communicating value to loyal customers is equally important. When raising prices, pair the announcement with a clear explanation of the enhancements and outcomes they receive—new features, better support, or measurable results. Transparency and advance notice help maintain trust. Testing price increases is essential. Begin with a small segment or a new cohort of customers, and compare their behavior against a control group. Monitor churn closely, but also track expansion revenue and customer lifetime value to see the net effect. Watch for leading indicators like reduced engagement or increased support tickets, which may signal dissatisfaction before cancellations occur. A staggered rollout—starting with new customers or less price-sensitive segments—limits risk while generating data. Throughout the process, maintain open feedback channels and be prepared to adjust. The goal is to find the price point that maximizes margin without eroding the loyalty of your best customers. By combining value-based pricing, tiered structures, clear communication, and disciplined testing, you can raise prices strategically and protect the relationships that drive long-term growth.
Negotiating with suppliers to lower direct production costs
Supplier negotiation is one of the most direct levers for reducing cost of goods sold, because every dollar trimmed from direct production costs flows straight into gross margin. The work begins with preparation: gathering accurate spend data, understanding the supplier’s cost structure, and knowing your own walk-away position before entering any conversation. Volume discounts are the most familiar tactic. Consolidating purchases with fewer vendors or committing to larger order quantities gives suppliers predictable demand, and that predictability has real value they can share back through tiered pricing. It helps to ask explicitly about volume breakpoints, since suppliers often have thresholds at which unit prices drop, and aligning your order size with those thresholds can unlock savings without any change in total consumption.
Long-term contracts offer another path. Suppliers will often trade a lower unit price for revenue certainty, so multi-year agreements with agreed-upon price schedules can lock in favorable rates and protect against inflation. These contracts should specify service levels, quality standards, and review clauses so that savings do not come at the expense of reliability. Alternative suppliers provide negotiating leverage as well as risk mitigation. Maintaining a qualified second source, even if it handles a small share of volume, creates competitive tension and gives you credible alternatives during price discussions. Benchmarking quotes across the market establishes a reference point that strengthens your position in any negotiation.
Total cost of ownership analysis rounds out the strategy by looking beyond the sticker price. Freight, duties, inventory carrying costs, defect rates, lead times, and the administrative burden of managing a supplier all affect the true cost of a component. A supplier with a slightly higher unit price may deliver lower overall costs through better quality and fewer disruptions. Presenting this analysis during negotiations shifts the conversation from price alone to the full economics of the relationship, opening room for joint cost-reduction efforts such as design changes, packaging efficiency, or shared logistics. Together these tactics turn procurement into an active contributor to margin rather than a passive purchasing function.
Reducing waste and inefficiency in your daily product delivery
Waste and inefficiency are quiet drains on gross margin. Every hour of rework, every unit of spoiled stock, every redundant step in a workflow carries a direct cost that shows up in the cost of goods sold line, and those costs compound across thousands of daily transactions. Operational improvements aimed at waste attack this problem at its source. Lean inventory management, for instance, aligns purchasing and production with actual demand so that capital is not tied up in stock that sits idle, ages, or becomes obsolete. Carrying excess inventory invites spoilage, storage costs, insurance, and write-offs; tightening replenishment cycles and tracking turnover keeps those costs visible and controllable. The direct savings flow straight into gross margin because they reduce the cost attached to each unit sold.
Quality control contributes in a similar way. Defects caught late are expensive: they consume materials, labor, and machine time, and they often require rework or replacement that is never recovered through price. Building inspection and testing into the production process, rather than relying on end-of-line checks, stops defective work from moving forward and consuming more resources. Scrap rates fall, warranty claims decline, and customer returns shrink, each of which removes a recurring cost from the margin calculation. The goal is consistency, so that output meets specification the first time and does not need to be redone.
Process optimization rounds out the picture by examining how work flows between steps. Bottlenecks, unnecessary movement of materials, idle equipment, and overprocessing all add cost without adding value. Mapping the value stream makes these losses visible, and small, repeated adjustments, such as reorganizing a workstation, simplifying approvals, or scheduling changeovers more efficiently, accumulate into meaningful savings over time. Labor hours per unit drop, throughput rises, and the fixed cost base is spread across more output.
The unifying principle is that cutting waste lowers direct costs while preserving the quality customers pay for. These improvements are cumulative, and because they touch daily operations, every shift delivers a little more margin than the one before.
Tracking gross margin trends over time to make smarter business decisions
Gross margin trends tell a story about your business that a single snapshot never can. A one-time calculation shows where you stand today; a trend line shows whether you are gaining ground or quietly losing it. Setting up regular margin tracking means deciding on a rhythm that fits your business cycle, whether that is monthly, quarterly, or aligned with production batches or seasonal peaks. The key is consistency: the same inputs, measured the same way, at the same intervals so comparisons remain meaningful. A simple template that captures revenue, cost of goods sold, and resulting margin percentage for each period is often enough to begin. Once the rhythm is established, the data starts to reveal patterns that would otherwise stay invisible.
Analyzing trends by product or period adds a second layer of insight. Some products carry healthy margins but sell slowly; others move quickly at thin margins, and their combined effect on the business is easy to misjudge without segmenting the numbers. Breaking margin data out by product line, customer segment, or channel shows which offerings actually contribute to profitability. Viewing the same figures across periods highlights seasonality, the effect of cost changes, and whether improvements persist or fade. A margin chart spanning twelve months will often surface gradual erosion that monthly reports alone would overlook.
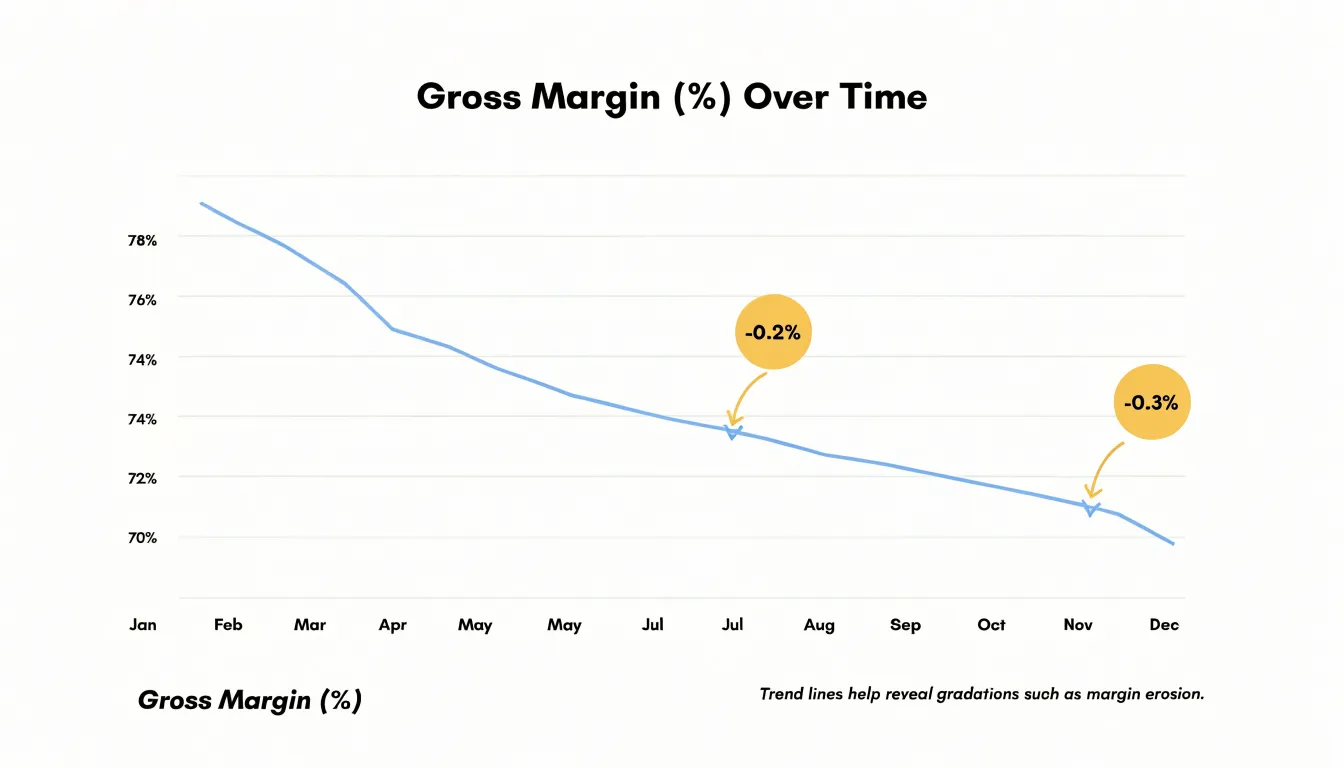
Those insights become valuable when they feed directly into decisions. A declining margin on a particular product may signal that pricing needs review, that supplier costs have crept upward, or that the product mix is shifting toward lower-value items. Rising margins can justify expanding a product line or negotiating better terms with suppliers. Sourcing decisions benefit from comparing landed costs across vendors over time, and pricing adjustments become more grounded when supported by evidence of how customers have responded to past changes. Product mix decisions gain clarity when margin data shows which categories deserve more shelf space, marketing spend, or inventory investment. The habit of regular review turns gross margin from a static figure into a working tool that guides pricing, sourcing, and portfolio choices as conditions change.
Frequently Asked Questions
What does gross margin tell you about a business?
Gross margin is the percentage of revenue left after subtracting cost of goods sold, representing money available to run the rest of the business. A low or declining gross margin can make a business fragile and often points to discounting, rising input costs, or production inefficiencies.
What is the difference between gross profit and gross margin?
Gross profit is the absolute dollar amount left after subtracting COGS from revenue, while gross margin expresses that same relationship as a percentage of revenue. Gross margin is useful for comparing products, time periods, and companies of different sizes because it normalizes for size.
How do you calculate gross margin percentage?
Use the formula (Revenue – Cost of Goods Sold) / Revenue × 100. For example, $500,000 in revenue with $300,000 in COGS leaves $200,000 gross profit and produces a 40% gross margin.
What costs should be included in cost of goods sold?
COGS typically includes direct costs such as raw materials and components, direct labor, freight-in, direct production supplies, subcontractor costs tied to specific units, and purchase returns and allowances. Operating expenses such as marketing, administrative rent, administrative salaries, and non-production utilities should be excluded from COGS.
How do I know if my gross margin is healthy for my industry?
Compare your margin with recent industry averages and a distribution of margins from trade associations, surveys, financial databases, or public filings, rather than relying on a single figure. Business model, scale, geography, and product or customer mix can explain normal variation, so a below- or above-range margin should be investigated with context.
How can negotiating with suppliers improve gross margin?
Every dollar trimmed from direct production costs flows directly into gross margin. The article suggests preparing spend and supplier cost data, asking about volume breakpoints, using long-term contracts, maintaining alternative suppliers, benchmarking quotes, and analyzing total cost of ownership.