Gross Profit vs Net Profit
Gross profit is revenue minus the direct cost of goods sold, such as materials and production labor, and shows production efficiency. Net profit is revenue minus all expenses, including operating costs, interest, and taxes, and shows what the business actually keeps. Gross profit appears near the top of the income statement; net profit is the bottom line.
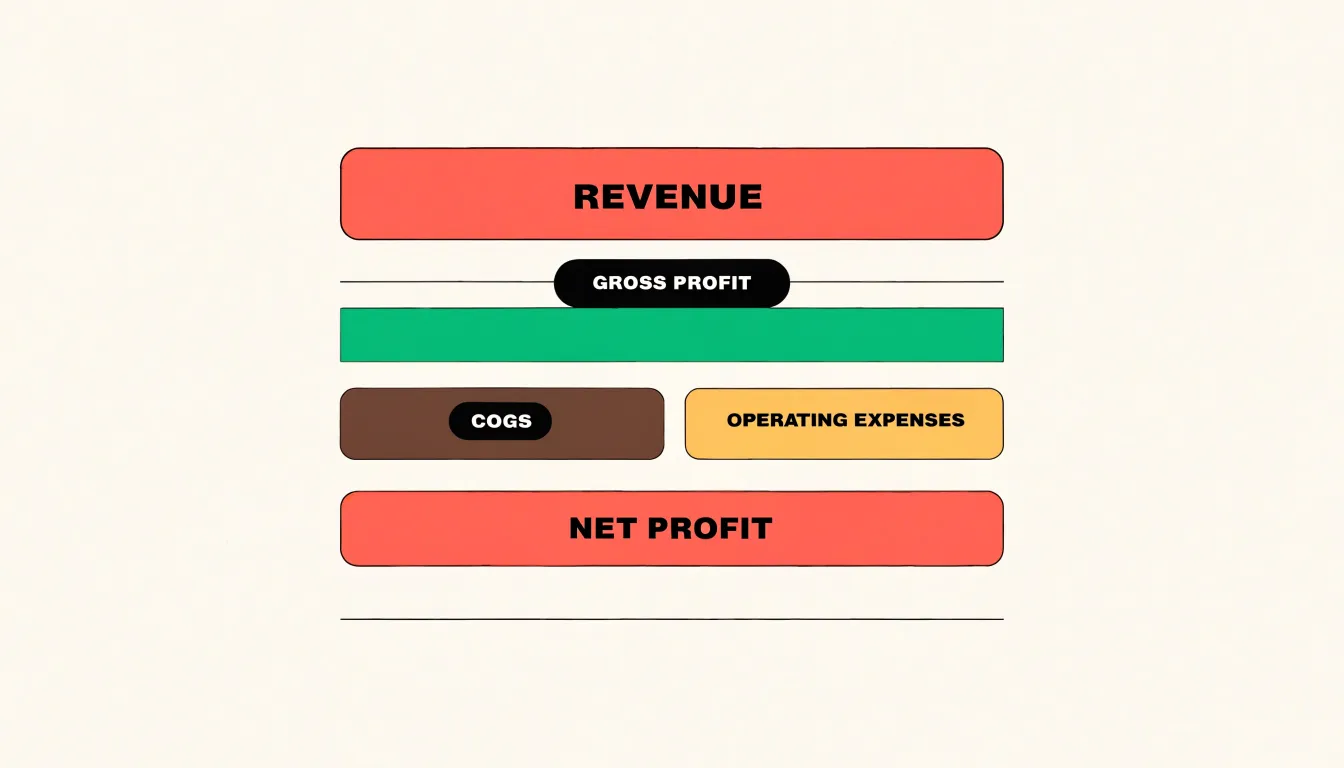
Table of Contents
- Understanding the Core Differences Between Gross and Net Profit
- What Gross Profit Measures on Your Income Statement
- How to Calculate Gross Profit Using Cost of Goods Sold
- What Net Profit Reveals About Overall Business Health
- Beyond Production Costs
- Comparing Gross Profit Margin and Net Profit Margin
- Practical Example
- Common Mistakes Small Businesses Make with Profit Metrics
- How to Improve Both Margins to Grow Your Bottom Line
Understanding the Core Differences Between Gross and Net Profit
The core difference between gross profit and net profit comes down to scope: gross profit measures what remains after subtracting the direct costs of producing goods or services, while net profit measures what remains after subtracting every expense the business incurs. Gross profit begins with revenue and deducts cost of goods sold, which includes raw materials, direct labor, manufacturing overhead, and freight on purchased inventory. This figure isolates the economics of production itself, showing whether the business earns enough on each sale to cover the cost of creating what it sells. Net profit starts from that same revenue line and deducts all operating expenses, including rent, utilities, salaries for administrative staff, marketing, insurance, depreciation, interest on debt, and taxes. The result is the bottom line, the amount the business actually keeps.
Why this distinction matters becomes clear when the two figures are read together. A company can post a healthy gross profit and still lose money, typically because operating costs, financing charges, or taxes consume the margin. Conversely, a business with a thin gross margin may run lean enough in overhead to stay profitable. Looking only at net profit can obscure problems buried in the cost structure, and looking only at gross profit can create false confidence about overall financial health. Reading both figures side by side reveals where money is being made and where it is being spent.
Decision-making depends on which question the business is asking. When evaluating pricing, product mix, or whether a specific product line is worth keeping, gross profit is the more useful signal because it isolates production economics from fixed overhead. When assessing overall viability, securing financing, or planning for taxes and reinvestment, net profit carries more weight because it reflects what the company truly earns. Managers who track both can spot whether a profitability problem originates on the factory floor or in the back office, and they can respond with targeted adjustments rather than broad cost cutting. Investors and lenders also use the gap between the two figures to gauge operational efficiency, since a wide spread suggests heavy overhead or debt burden relative to production costs. Understanding this fundamental split gives stakeholders a clearer map of how revenue converts into real earnings.
What Gross Profit Measures on Your Income Statement
Gross profit appears near the top of the income statement, calculated by subtracting cost of goods sold from total revenue. This line item sits directly beneath the revenue figure, positioning it as the first meaningful measure of profitability a reader encounters when reviewing financial statements. The calculation captures the direct costs tied to producing or acquiring the goods and services a company sells, including raw materials, direct labor, and manufacturing overhead. By isolating these costs, gross profit establishes a clear picture of how efficiently a business converts its production inputs into saleable output.
What this figure reveals is the core earning power of a company’s primary operations before administrative expenses, marketing outlays, interest payments, and taxes enter the picture. A healthy gross profit indicates that a business can cover its direct production costs and still retain funds to support the broader organization. Managers watch this number closely because it responds quickly to shifts in pricing strategy, supplier costs, and production methods. When raw material prices rise or discounting intensifies, gross profit absorbs that pressure first, giving leadership an early signal about operational strain. Investors likewise use gross profit to compare companies within the same industry, since it strips away financing and tax structures that vary widely between firms.
The limitations of gross profit stem from its narrow scope. It accounts only for direct production costs and ignores the many other expenses required to run a business, such as sales commissions, rent for administrative offices, research spending, and debt service. A company can report strong gross profit while still losing money once operating expenses are deducted. This measure also offers limited insight for service businesses or software firms where the distinction between direct and indirect costs becomes blurry. Additionally, gross profit says nothing about cash flow, working capital management, or the timing of revenue recognition. Because of these boundaries, gross profit works best as a starting point for financial analysis, revealing production efficiency while leaving the fuller profitability picture to measures further down the income statement.
How to Calculate Gross Profit Using Cost of Goods Sold
Calculating gross profit begins with a single, straightforward formula: Gross Profit = Revenue − Cost of Goods Sold. Revenue here means the total income generated from selling goods or services during a given period, before any expenses are subtracted. Cost of Goods Sold, usually shortened to COGS, represents the direct costs tied to producing or acquiring the items a business sells. Subtracting one from the other reveals how much money remains after covering those direct production costs, which gives a clear picture of core profitability before overhead and other expenses enter the picture.
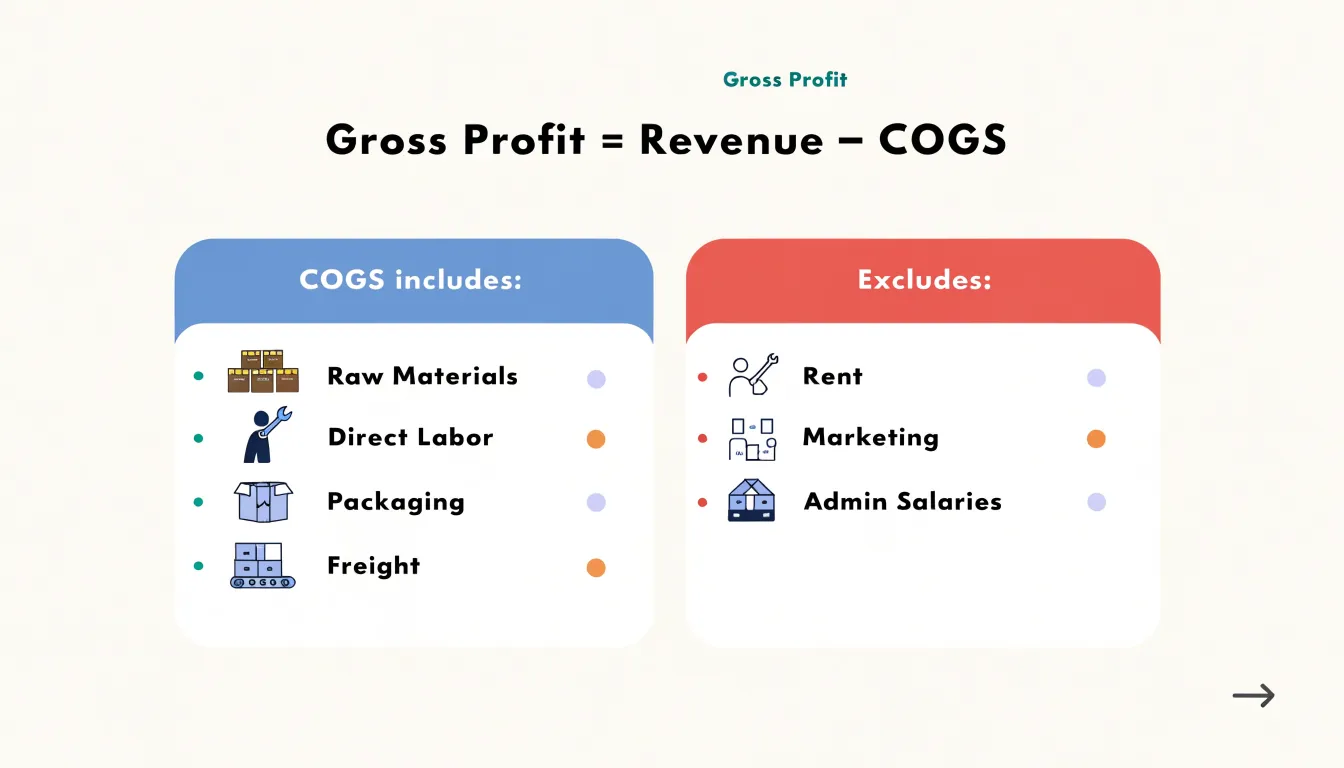
The composition of COGS deserves careful attention, since the accuracy of the gross profit figure depends entirely on what gets included. COGS typically covers costs directly connected to creating or purchasing inventory: raw materials, components, manufacturing labor, packaging, freight and shipping costs for incoming goods, and wholesale purchase prices for retailers. For a furniture maker, COGS might include timber, upholstery fabric, hardware, and the wages of workers assembling each piece. For an online clothing retailer, COGS would consist of the wholesale price paid to suppliers plus inbound shipping and packaging materials. Service businesses can also have a COGS equivalent, such as the cost of subcontractors or materials consumed while delivering a client project.
Equally important is recognizing what stays out of COGS. Operating expenses like rent, marketing, administrative salaries, insurance, and utilities belong elsewhere, since they support the business as a whole rather than any individual product. Keeping these categories separate preserves the meaning of gross profit as a measure of production-level efficiency.
A worked example makes the mechanics concrete. Suppose a boutique bakery earns 120,000 dollars in revenue for the year. Its COGS includes flour, sugar, dairy, and other ingredients at 35,000 dollars, wages for bakers at 25,000 dollars, and packaging at 5,000 dollars, totaling 65,000 dollars. Gross profit equals 120,000 minus 65,000, or 55,000 dollars. Expressed as a margin, that comes to roughly 46 percent, meaning the bakery retains about 46 cents from every sales dollar after direct costs. Tracking this figure over time helps owners spot rising ingredient prices, negotiate supplier terms, and price products appropriately.
What Net Profit Reveals About Overall Business Health
Net profit is the figure that remains after every operating cost, tax obligation, interest payment, and one-time charge has been subtracted from revenue. It sits at the very bottom of the income statement, which is why it is commonly called the bottom line. Because it captures the cumulative effect of every financial decision a business makes, net profit functions as a comprehensive scorecard for overall business health. It tells owners and investors whether the company is genuinely viable or merely busy. A firm can post impressive sales and still post a net loss, and that gap between activity and outcome is exactly what net profit exposes.
The journey from revenue to net profit passes through several layers of deduction. Gross profit removes the direct cost of goods sold, then operating expenses such as salaries, rent, marketing, and utilities come out, followed by depreciation, interest on debt, and taxes. Each layer reflects a different dimension of management performance. A strong net profit signals that pricing, cost control, and capital structure are all working in alignment. A thin or negative net profit, even alongside healthy gross margins, suggests that overhead, debt servicing, or inefficient operations are eating into the gains made at earlier stages.
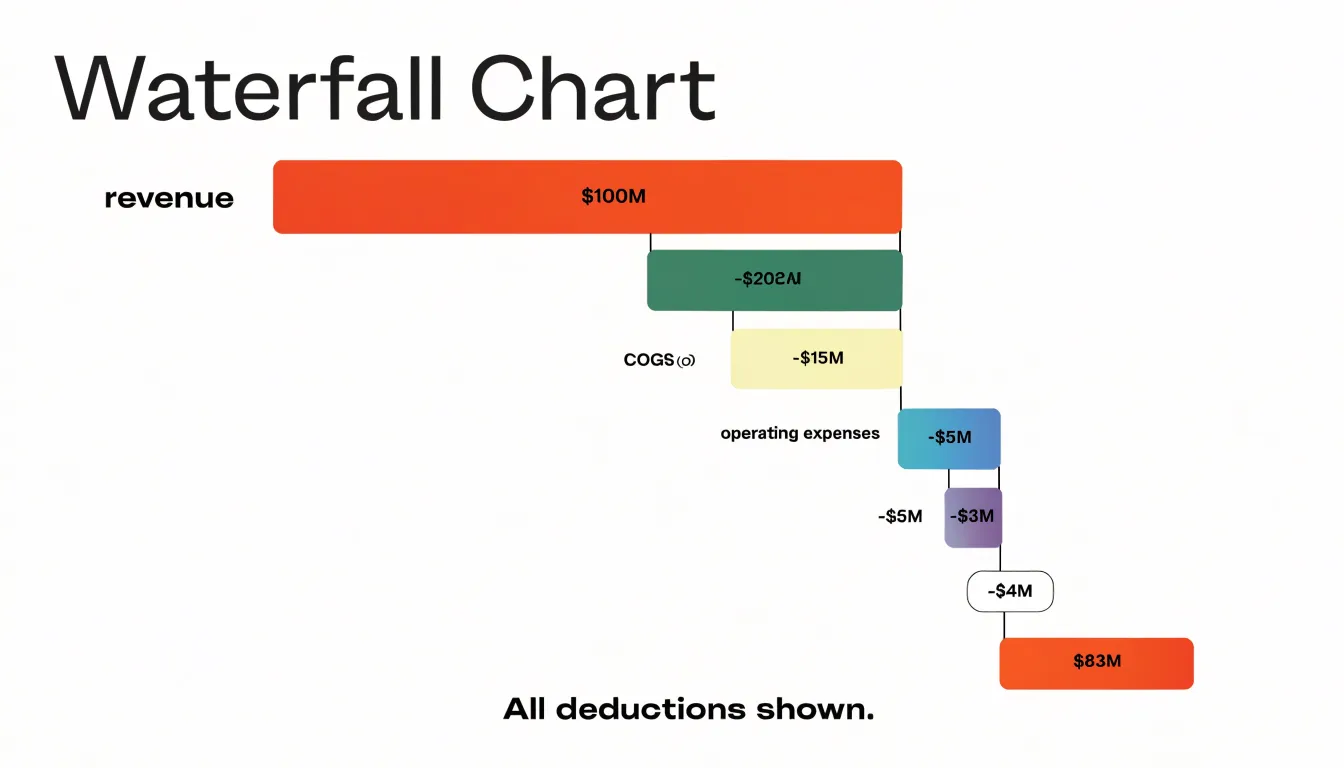
This makes net profit the ultimate measure of financial success because it answers the question stakeholders care about most: after everything is paid, what is left? That residual amount funds reinvestment, debt reduction, dividends, and cash reserves that carry a company through downturns. Lenders scrutinize net profit when assessing creditworthiness, and investors use it to gauge whether a business can generate sustainable returns over time.
Net profit also supports trend analysis. Tracking it across quarters and years reveals whether profitability is improving, stagnating, or deteriorating, and comparing net profit margin against industry peers shows how efficiently a company converts revenue into earnings relative to competitors. Used alongside cash flow statements and balance sheet data, net profit provides a clear, consolidated view of whether the business is building lasting financial strength.
Beyond Production Costs
Gross profit captures the direct costs of delivering a product or service, covering materials, direct labor, and manufacturing overhead tied to production. Net profit reaches considerably further into the business, accounting for every expense the company incurs while operating. The bridge between the two figures is where many of the most consequential costs of running a business appear, and understanding what sits on that bridge helps explain why a company with healthy gross margins can still finish the year with modest or negative net profit.
Operating expenses form the largest category of costs deducted from gross profit. These include selling, general, and administrative expenses such as salaries for sales and management staff, marketing and advertising, rent, utilities, office supplies, insurance, and professional fees for legal and accounting services. Research and development spending also falls here for many businesses, as does depreciation on equipment and facilities not directly tied to production. These costs keep the organization running day to day, and they accumulate quickly regardless of how many units the company sells.
Interest expense is another deduction, reflecting the cost of borrowing. Companies that financed expansion, inventory, or equipment through loans or credit lines will see interest payments reduce net profit even when operations perform well. For capital-intensive businesses, interest can represent a meaningful share of the gap between gross and net figures.
Taxes follow interest on the income statement. Income tax obligations at the federal, state, and local levels are calculated after operating and interest expenses are subtracted, which means the tax bill depends on the profitability that remains at that stage. A company with strong gross profit but heavy operating costs will owe less tax, though it also keeps less of what it earns.
Finally, net profit absorbs one-time and miscellaneous items: losses on asset sales, restructuring charges, impairment write-downs, and foreign exchange fluctuations. These irregular costs can swing net profit sharply from one period to the next. Taken together, these deductions explain why net profit represents the most complete picture of what a business actually earns after every obligation is satisfied.
Comparing Gross Profit Margin and Net Profit Margin
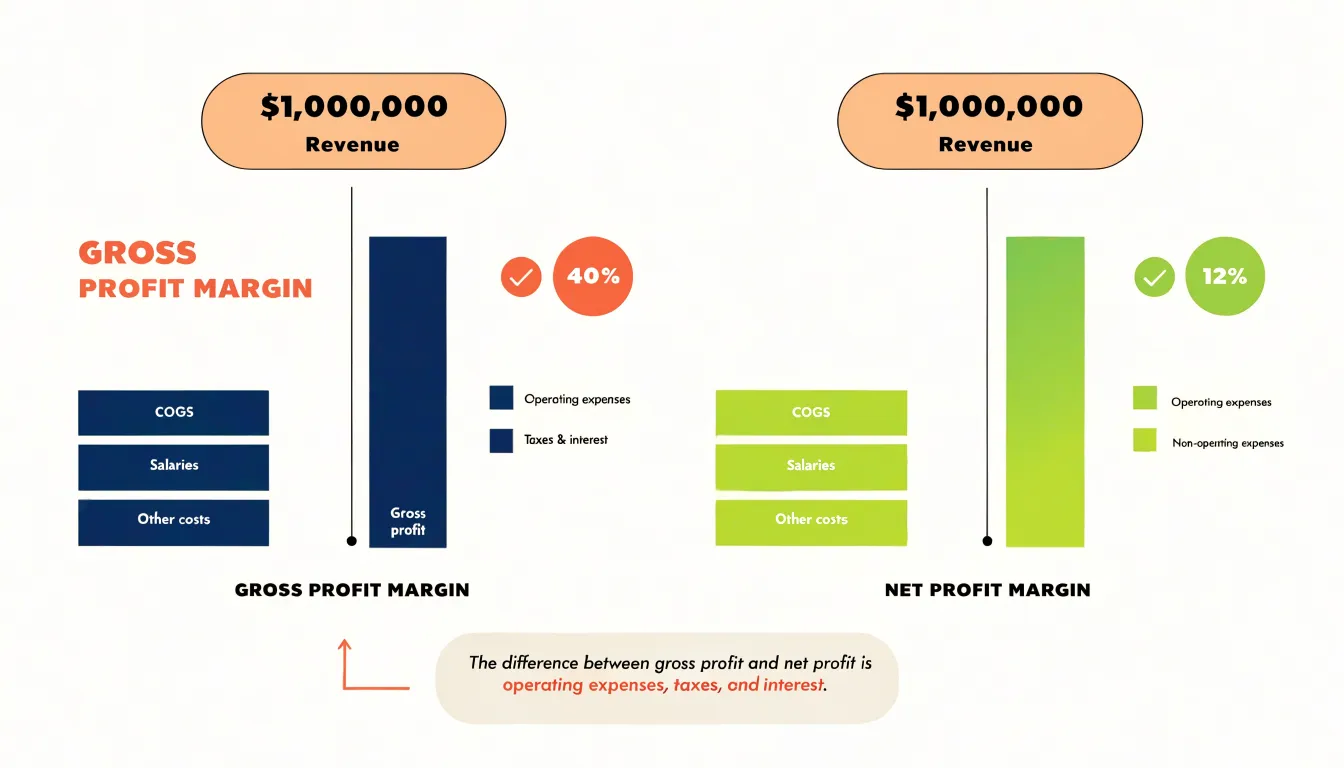
Gross profit margin and net profit margin are two key ratios that provide insight into a company’s financial health and operational efficiency. To calculate gross profit margin, subtract the cost of goods sold (COGS) from revenue to get gross profit, then divide gross profit by revenue and multiply by 100 to express it as a percentage. For example, if a company has $1,000,000 in revenue and $600,000 in COGS, its gross profit is $400,000, and its gross profit margin is 40%. This margin indicates how efficiently a company uses its raw materials and labor to produce goods or services. A higher gross margin suggests that the company can retain more profit per dollar of sales to cover other expenses, such as operating costs, taxes, and interest. It reflects pricing strategy and production efficiency. Net profit margin, on the other hand, takes into account all expenses, including operating expenses, taxes, and interest. To calculate it, subtract all expenses from revenue to get net profit, then divide net profit by revenue and multiply by 100. Using the same example, if the company has $200,000 in operating expenses, $50,000 in taxes, and $30,000 in interest, its net profit is $120,000, resulting in a net profit margin of 12%. This margin shows the overall profitability of the company after all costs are accounted for. It indicates how well the company manages its total expenses and generates profit from its operations. When interpreting these margins, it’s important to consider industry norms and trends over time. A high gross margin relative to peers may indicate a competitive advantage in production or pricing, while a low gross margin could signal inefficiencies or intense price competition. Net profit margin provides a bottom-line view of profitability; a consistently low net margin might prompt a review of operating expenses or debt levels. Comparing the two margins can reveal areas for improvement. For instance, a company with a high gross margin but low net margin may have excessive operating expenses or high interest costs, suggesting a need to streamline overhead or reduce debt. Conversely, a low gross margin but high net margin might indicate effective cost control in other areas. Both margins should be analyzed together to gain a comprehensive understanding of financial performance.
Practical Example
To illustrate the difference between gross profit and net profit, consider a hypothetical retail store, “Green Leaf Grocers.” The store’s income statement for a recent quarter provides a clear walkthrough. Start with total revenue: Green Leaf recorded $120,000 in sales. Next, subtract the cost of goods sold (COGS), which includes the wholesale cost of inventory, freight, and packaging—totaling $70,000. This yields a gross profit of $50,000. At this stage, the store has covered the direct costs of the products it sold, but many other expenses remain.
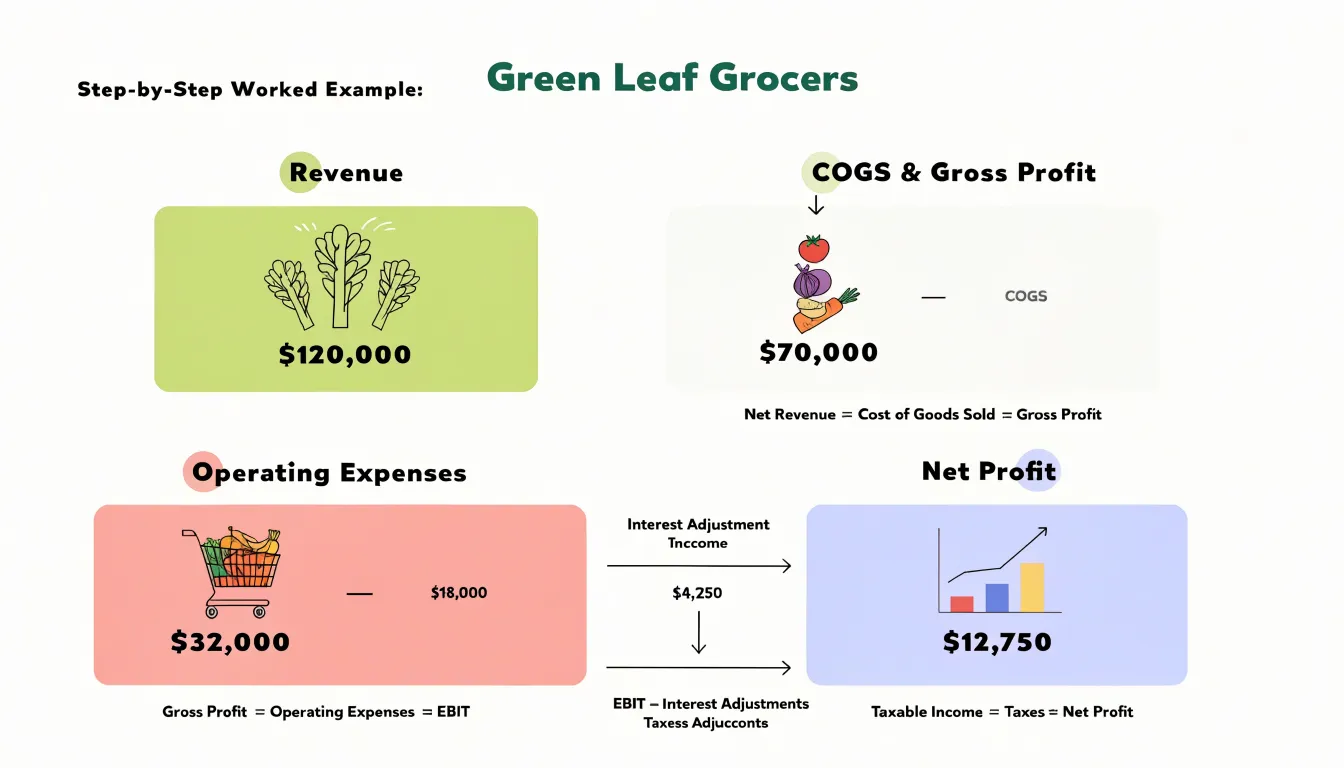
Now move to operating expenses. Green Leaf pays $12,000 in rent, $15,000 in wages, $3,000 for utilities, and $2,000 for marketing. These operating expenses sum to $32,000. Subtract this from gross profit: $50,000 minus $32,000 leaves $18,000. This figure is operating profit (also called EBIT). From here, account for non-operating items. Green Leaf has a small business loan with $1,500 in interest expense and also earns $500 in interest income from a savings account. Adjusting operating profit by these items gives $18,000 - $1,500 + $500 = $17,000. This is pre-tax profit. Finally, apply a 25% tax rate: $17,000 × 0.25 = $4,250 in taxes. Subtract taxes to arrive at net profit: $17,000 - $4,250 = $12,750.
This step-by-step calculation highlights how each expense layer reduces profit. Gross profit shows the store’s core merchandising margin, while net profit reveals the bottom line after all costs. Suppose Green Leaf negotiates a lower rent of $10,000; operating expenses drop to $30,000, operating profit rises to $20,000, pre-tax profit becomes $19,000, and net profit increases to $14,250. Conversely, a $2,000 increase in COGS would lower gross profit to $48,000 and net profit to $11,250, assuming other factors unchanged. Tracking these figures regularly helps a retail store manager identify which costs most affect profitability and make informed decisions about pricing, inventory, and overhead.
Common Mistakes Small Businesses Make with Profit Metrics
Small business owners often wear many hats, and financial analysis is frequently one of the tasks that receives less attention than it deserves. This environment makes several profit-metric mistakes remarkably common. One of the most frequent is confusing profit with cash flow. A business can show a healthy gross profit on its income statement while running short of cash in the bank, because profit is an accounting measure that reflects revenue earned and expenses incurred, while cash flow tracks the actual movement of money in and out of accounts. Revenue recorded when an invoice is issued may not be collected for thirty, sixty, or ninety days, and large inventory purchases or loan repayments can drain cash without appearing as operating expenses in the same period. Owners who treat profit as a proxy for available cash can find themselves unable to meet payroll despite a profitable quarter. The remedy is to review a cash flow statement alongside profit figures and to forecast collections and payments on a rolling basis.
Another common error is ignoring overhead allocation. Many small businesses calculate gross profit only on direct costs, such as materials and direct labor, and then assume the remaining gross margin is available to cover rent, insurance, administrative salaries, and marketing. When overhead is never allocated to products or service lines, some offerings appear far more profitable than they truly are. A product with a strong gross margin can consume disproportionate warehouse space, customer service time, or marketing spend, turning it into a net loss once those costs are assigned. Owners can avoid this by developing a simple, consistent method for allocating overhead, whether based on square footage, labor hours, or revenue share, and applying it regularly enough to reveal which offerings genuinely contribute to the bottom line.
Misclassifying costs is a third frequent problem. Expenses that belong in cost of goods sold sometimes get recorded as operating expenses, and vice versa, which distorts both gross and net profit. Freight-in on inventory, packaging, and certain production supplies are typical candidates for misclassification. Establishing clear written definitions for each cost category, reviewing the chart of accounts periodically with an accountant, and reconciling classifications at each month-end close will keep profit metrics accurate and comparable over time.
How to Improve Both Margins to Grow Your Bottom Line
Improving both gross and net margins is essential for sustainable growth in your bottom line. Start with gross margin by focusing on cost of goods sold (COGS). Renegotiate with suppliers to secure better pricing, especially as your order volumes grow. Explore alternative suppliers or materials that maintain quality while reducing costs. Streamline production processes to minimize waste and improve efficiency; even small reductions in material or labor costs per unit can significantly impact gross margin. Consider adjusting your product mix to emphasize higher-margin offerings, and review pricing strategies to ensure they reflect the value you deliver without leaving money on the table.
For net margin, target overhead expenses that don’t directly drive revenue. Conduct a thorough audit of operating costs, from rent and utilities to software subscriptions and marketing spend. Identify areas where you can cut without sacrificing core operations—perhaps by renegotiating service contracts, switching to more cost-effective vendors, or adopting remote work to reduce facility costs. Automate repetitive tasks to lower labor expenses and improve accuracy. Evaluate your marketing channels for return on investment, reallocating budget to the most effective ones. Also, review your debt structure to minimize interest expenses and take advantage of any tax efficiencies available to your business.
The interplay between these strategies is powerful. A higher gross margin provides more cushion to cover overhead and invest in growth initiatives. A leaner overhead structure means more of each gross profit dollar flows to the bottom line. Together, they create a compounding effect: as margins improve, you generate more cash to reinvest in areas like product development, marketing, or talent, which in turn drives revenue growth. This cycle of margin expansion and reinvestment fuels sustainable business growth, enhances financial resilience, and increases the value of your company. By systematically addressing both COGS and overhead, you build a stronger foundation for long-term profitability.
Frequently Asked Questions
What is the difference between gross profit and net profit?
Gross profit measures what remains after subtracting the direct costs of producing goods or services, while net profit measures what remains after subtracting every expense the business incurs. Gross profit begins with revenue and deducts cost of goods sold, while net profit also deducts operating expenses, interest on debt, and taxes.
How do you calculate gross profit?
Gross profit is calculated as Revenue minus Cost of Goods Sold. Cost of Goods Sold represents the direct costs tied to producing or acquiring the items a business sells.
What does net profit tell you about overall business health?
Net profit is the figure that remains after every operating cost, tax obligation, interest payment, and one-time charge has been subtracted from revenue. It functions as a comprehensive scorecard for overall business health and shows what the company actually keeps.
What is the difference between gross profit margin and net profit margin?
Gross profit margin is calculated by dividing gross profit by revenue and multiplying by 100, while net profit margin is calculated by dividing net profit by revenue and multiplying by 100. Gross profit margin reflects pricing strategy and production efficiency, while net profit margin shows overall profitability after all costs are accounted for.
Why is profit not the same as cash flow?
Profit is an accounting measure that reflects revenue earned and expenses incurred, while cash flow tracks the actual movement of money in and out of accounts. A business can show a healthy gross profit while running short of cash in the bank.
How can a business improve both gross and net margins?
Improve gross margin by renegotiating with suppliers, exploring lower-cost materials that maintain quality, streamlining production, adjusting product mix toward higher-margin offerings, and reviewing pricing. Improve net margin by auditing overhead, renegotiating service contracts, switching to cost-effective vendors, automating repetitive tasks, evaluating marketing ROI, and reviewing debt structure to minimize interest expenses.