
How to Calculate IRR (and How It Differs from NPV)
Internal rate of return (IRR) is the discount rate at which a project’s net present value equals zero—the rate that makes the present value of cash inflows equal the present value of outflows. It represents the annualized return an investment is expected to earn, or the break-even cost of capital it can bear before destroying value.
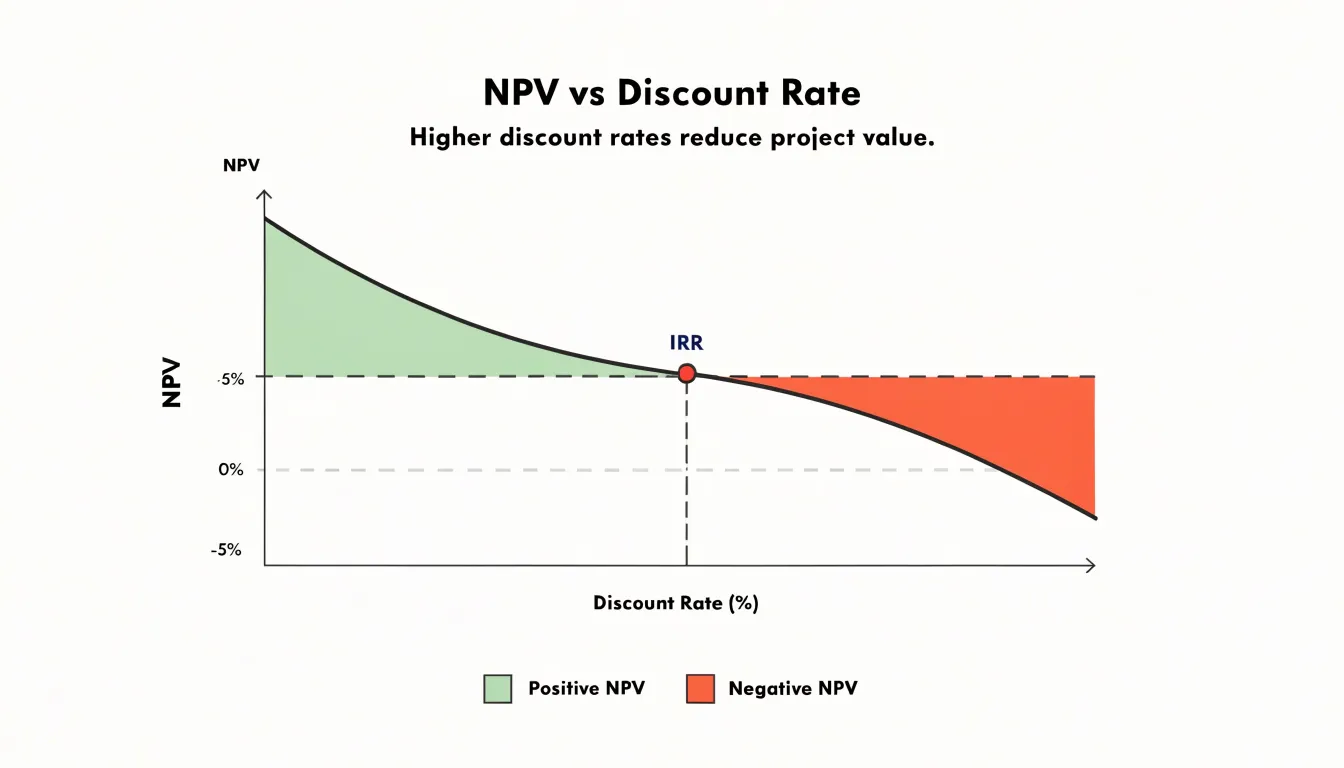
Table of Contents
- Understanding the Core Purpose of Internal Rate of Return
- The Mathematical Formula Behind Internal Rate of Return
- Calculating IRR
- How to Calculate Internal Rate of Return in Excel
- What Net Present Value Tells You About an Investment
- IRR vs NPV
- When Internal Rate of Return Can Mislead Investors
- Choosing the Right Metric for Your Project Evaluation
Understanding the Core Purpose of Internal Rate of Return
The internal rate of return exists because investors need a single, intuitive number that summarizes the profitability of a project or investment. Financial analysis often produces a stream of cash flows spread across many years—an initial outlay followed by inflows of varying size—and comparing those streams directly is difficult. IRR condenses the entire stream into one percentage: the annualized rate of return the investment is expected to earn. That simplicity is precisely why the metric has become a standard tool for evaluating capital projects, acquisitions, and other long-horizon investments.
The definition of IRR is precise: it is the discount rate at which the present value of a project’s expected cash inflows exactly equals the present value of its cash outflows, so the net present value of the project becomes zero. In other words, if a project were funded entirely with borrowed money charged at the IRR, the project would generate exactly enough cash to repay the loan and its interest, leaving nothing extra. Any discount rate below the IRR produces a positive NPV, meaning the project creates value; any rate above it produces a negative NPV. The IRR is the break-even cost of capital—the threshold interest rate the investment can bear before it stops being worthwhile.
Investors use IRR primarily as a comparison tool. Because it is expressed as a percentage rather than a dollar amount, it allows projects of different sizes and durations to be weighed against one another on a common scale. A project with an IRR of 18 percent can be directly compared with one returning 12 percent, with the hurdle rate the company requires, or with the return available from alternative uses of the same capital. For fund managers and corporate finance teams, this makes IRR a natural screening device: projects whose IRR clears the required threshold move forward for deeper analysis, while those that fall short are set aside.
The percentage format also makes IRR easy to communicate to non-specialists. A board member or outside investor can grasp that a project is expected to return 15 percent annually without reviewing a multi-year cash flow schedule. This accessibility explains why IRR remains one of the most widely quoted metrics in investment appraisal, even alongside more technically complete measures.
The Mathematical Formula Behind Internal Rate of Return
At the heart of IRR lies a single equation: set the net present value of all cash flows to zero and solve for the discount rate. Formally, for a project with initial investment CF0 (typically negative) and subsequent cash flows CF1, CF2, …, CFn occurring at times t = 1, 2, …, n, the IRR is the rate r that satisfies: 0 = CF0 + CF1/(1+r)^1 + CF2/(1+r)^2 + … + CFn/(1+r)^n. In this expression, the cash flows are known quantities from the project’s forecasts, while r is the unknown variable. The equation states that the sum of the present values of all cash inflows and outflows, discounted at the IRR, equals zero. Economically, this means the project’s cash flows exactly repay the initial investment and earn a return equal to r on the outstanding balance.
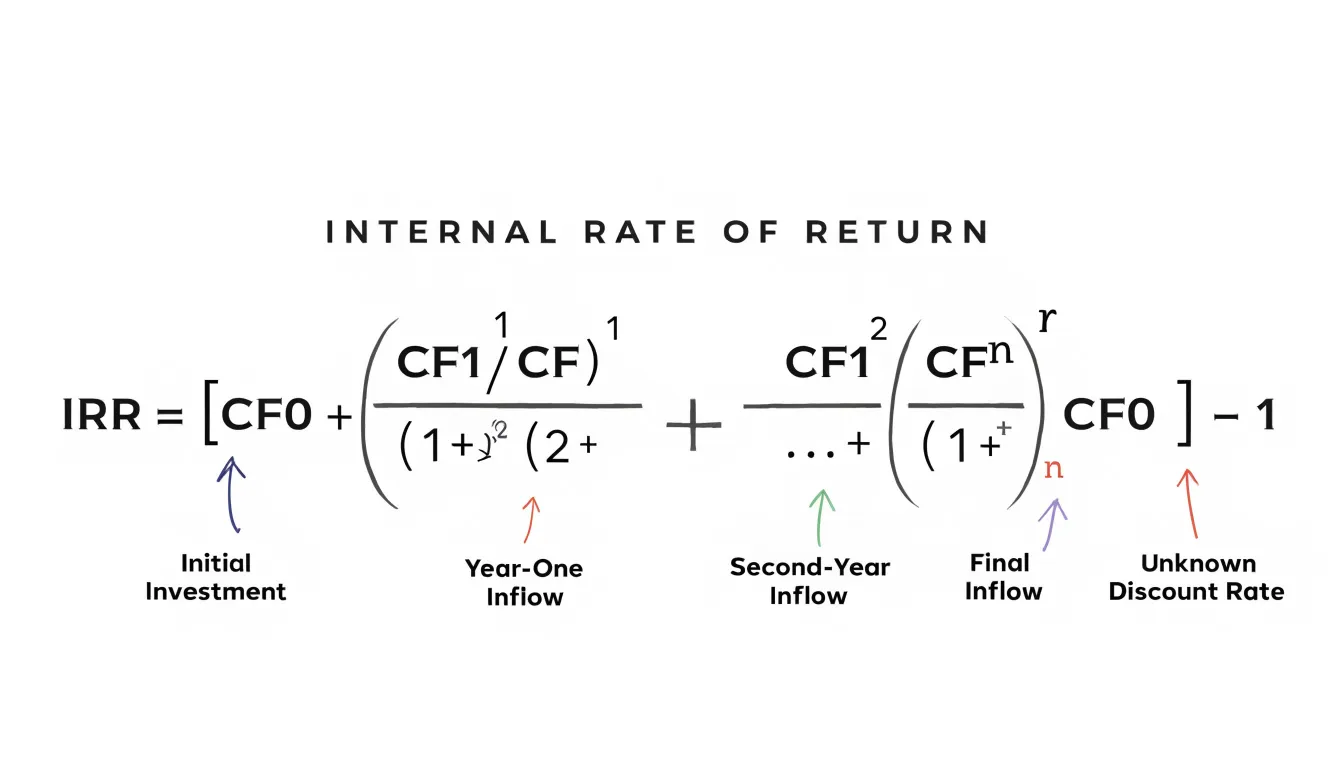
Because the equation involves (1+r) raised to various powers, it is a polynomial in r. For a simple case with one initial outflow and one inflow, the equation reduces to a linear form that can be solved algebraically. For example, if CF0 = -100 and CF1 = 110, then 0 = -100 + 110/(1+r), which gives r = 10%. However, as soon as there are multiple cash flows, the equation becomes a higher-degree polynomial, and no general algebraic solution exists for polynomials of degree five or higher, per the Abel-Ruffini theorem. Even for lower degrees, the formulas are cumbersome and rarely used in practice.
Consequently, IRR is almost always found through iterative methods. These numerical techniques start with an initial guess for r and repeatedly refine it until the NPV is sufficiently close to zero. Common approaches include the Newton-Raphson method, which uses the derivative of the NPV function to accelerate convergence, and the bisection method, which brackets the root within an interval and halves it repeatedly. Modern spreadsheet functions and financial calculators implement such algorithms behind the scenes. The iterative nature of the calculation explains why IRR can sometimes fail to converge or may produce multiple solutions when cash flows alternate signs, a topic explored later in this article.
Calculating IRR
To see how IRR is calculated by hand, start with a simple cash flow stream: an initial outlay of $1,000 today, followed by inflows of $600 at the end of year one and $600 at the end of year two. The IRR is the discount rate that makes the present value of these inflows exactly equal the $1,000 outlay, which means solving 1000 = 600/(1+r) + 600/(1+r)². Because this equation has no simple closed-form solution for r, the practical approach is trial and error: guess a rate, compute the NPV at that rate, and adjust the guess based on whether the result is positive or negative.
Begin with a guess of 10%. The year-one inflow discounts to 600/1.10 = $545.45, and the year-two inflow discounts to 600/1.21 = $495.87. The total present value is $1,041.32, which exceeds the $1,000 cost, so the NPV is +$41.32. A positive NPV means the discount rate is too low, since a higher rate shrinks the present value. Try 15% next. The factors become 600/1.15 = $521.74 and 600/1.3225 = $453.69, for a total of $975.43 and an NPV of −$24.57. The IRR now sits between 10% and 15%, because the NPV changes sign across that range.
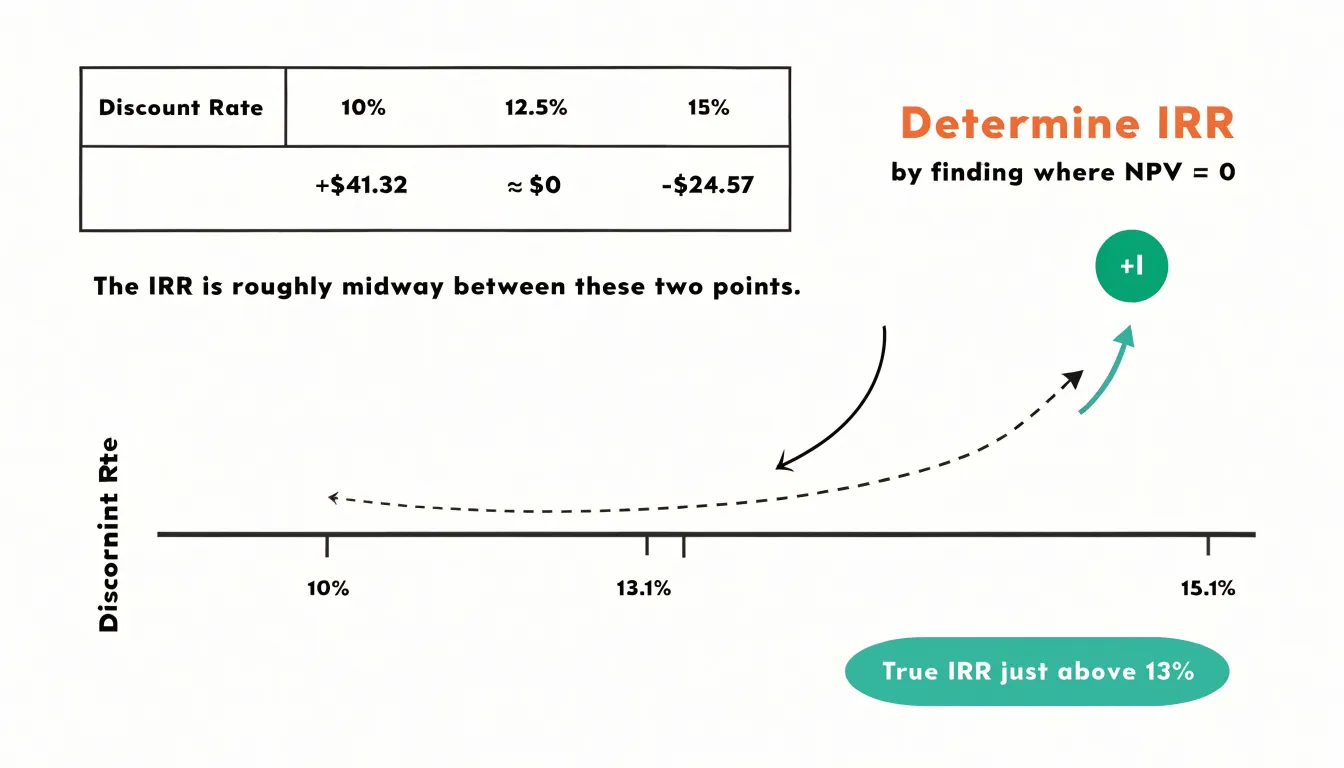
To narrow it down without endless guessing, interpolate linearly between the two bracketing rates. The NPV falls by $65.89 ($41.32 + $24.57) as the rate rises by five percentage points. The IRR lies roughly $41.32/$65.89 of the way from 10% to 15%, which is about 0.627 × 5% = 3.14 points above 10%, giving an estimate near 13.1%. Checking directly at 13%: 600/1.13 = $530.97 and 600/1.2769 = $469.89, totaling $1,000.86, an NPV of about +$0.86. That confirms the true IRR is just above 13%. Interpolation is an approximation because NPV does not fall in a perfectly straight line as the rate changes, but with two reasonably close guesses the error is small. The same guess, check, and interpolate cycle scales to longer cash flow streams; the arithmetic grows, yet the logic stays identical.
How to Calculate Internal Rate of Return in Excel
Excel provides two dedicated functions for calculating the internal rate of return, and choosing the right one depends on the timing pattern of your cash flows. The standard IRR function assumes that every cash flow occurs at evenly spaced intervals, typically one year apart. Setup is straightforward: list your cash flows in a single column or row, beginning with the initial investment as a negative number and following with each subsequent inflow or outflow as positive or negative values. Then enter =IRR(range) in an empty cell, where the range covers the entire sequence of cash flows. Excel solves iteratively for the discount rate that sets the net present value of that stream to zero. If the function returns an error, supplying a guess value such as =IRR(range, 0.1) often helps the algorithm converge, particularly when the true rate is far from zero or when the cash flow pattern alternates between positive and negative values.

Setting up ranges correctly matters more than many users expect. The range must include the initial investment and every subsequent cash flow, with no blank cells or text labels inside it, since Excel treats blanks inconsistently and text values interrupt the computation. Column headers and descriptions belong outside the range, not within it. The sign convention also deserves attention: at least one cash flow must be negative and at least one positive, or the function cannot find a meaningful solution. Laying out the timeline consistently, with dates or period labels in an adjacent column, reduces errors later when you revisit the model.
For cash flows that arrive at irregular intervals, IRR can produce misleading results because it implicitly assumes uniform spacing, XIRR addresses this by pairing each cash flow with its actual date. The format is =XIRR(values, dates), where the values range and dates range must be the same length and aligned row by row. The first date anchors the calculation, and the function returns an annualized rate regardless of how far apart the payments fall. Common pitfalls include mixing annual and monthly cash flows in one IRR calculation, omitting the initial outflow, and feeding XIRR dates stored as text rather than real date values. Auditing the sign and timing of each entry before running either function will keep your results reliable.
What Net Present Value Tells You About an Investment
Net Present Value answers a straightforward question: once you account for the time value of money, how much wealth does a project add in today’s dollars? To calculate NPV, you forecast the cash inflows and outflows the investment will generate over its life, then discount each of those cash flows back to the present using a required rate of return. That discount rate reflects the opportunity cost of capital, the return you could reasonably expect from putting the same money into an alternative of comparable risk. Sum the discounted inflows, subtract the discounted outflows, and the result is the NPV.
The figure you get is expressed in currency, not percentages, which makes it unusually direct to interpret. It represents value creation measured on the same scale as the initial outlay. A positive NPV means the discounted inflows exceed the discounted outflows, so the project is expected to return more than the required rate and to add value to the business or investor. A negative NPV means the project is expected to fall short of the required return, eroding value relative to simply deploying the capital elsewhere. An NPV of zero means the project is expected to earn exactly the required rate, a break-even outcome in economic terms.
Interpreting those three results involves more than a simple accept-or-reject rule. Positive NPV projects are generally worth pursuing, but the size of the number matters alongside the scale of the investment and the reliability of the forecasts behind it. Negative NPV signals that the expected cash flows do not justify the cost of capital, though a strategic project might still proceed for reasons outside the calculation. Zero NPV sits at the margin: the project neither adds nor destroys value at the assumed discount rate, which often flags sensitivity to small changes in assumptions.
The discount rate itself drives much of the interpretation. Raise the rate and future cash flows shrink in present terms, pushing NPV down; lower it and distant cash flows carry more weight. Because long-dated projects are especially sensitive to this input, the rate must reflect the true risk of the cash flows. NPV also scales with project size, so a large project can show a big NPV in absolute terms without being the most efficient use of capital. Reading the number alongside the investment required gives a fuller picture of what the project contributes.
IRR vs NPV
Internal rate of return and net present value rest on different assumptions, and those assumptions shape how each metric behaves in real decision making. NPV discounts all future cash flows at a rate the analyst selects, typically the company’s cost of capital or a hurdle rate reflecting the risk of the project. That discount rate anchors the entire calculation to an external benchmark. IRR instead solves for the discount rate that sets NPV to zero, producing a single percentage that describes the project’s own return profile. The difference matters because IRR implicitly assumes interim cash flows are reinvested at the IRR itself, while NPV assumes reinvestment at the chosen discount rate. For projects with unusually high IRRs, that reinvestment assumption can be optimistic, since the company may not have other opportunities yielding the same rate.
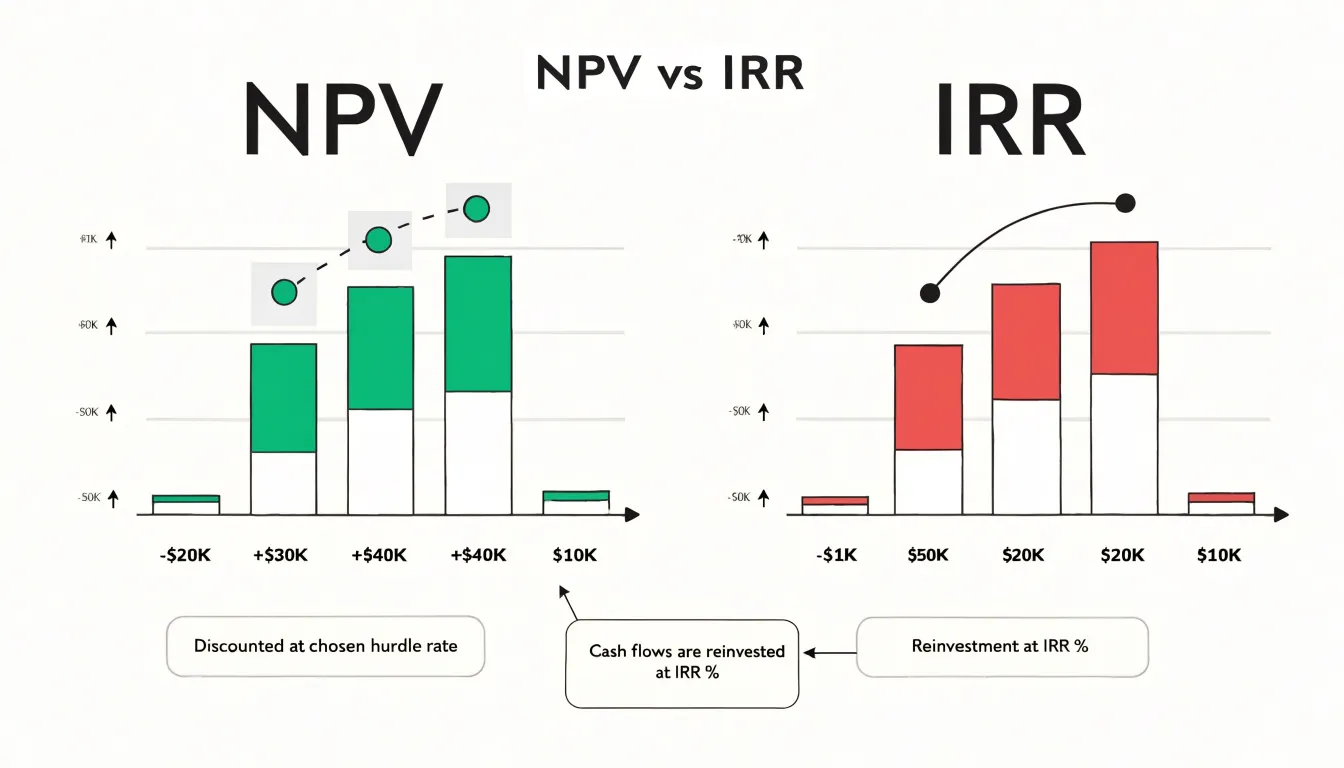
Scale is another practical divergence. IRR is expressed as a percentage, so it says nothing about the absolute value a project creates. A small project with a 40% return and a large project with a 25% return can both look attractive on an IRR basis, even when the larger project generates far more wealth in dollar terms. NPV captures that magnitude directly. When projects are mutually exclusive or capital is constrained, scale becomes central, and a high percentage return on a modest investment may be worth less than a lower percentage return on a substantial one.
Timing patterns also produce different rankings. Projects with cash flows arriving early tend to show higher IRRs, while projects with larger later cash flows can show stronger NPVs depending on the discount rate. Multiple sign changes in a cash flow stream can even yield more than one IRR, leaving the analyst without a clear answer. NPV does not suffer from this ambiguity.
For ranking projects and making capital allocation decisions, NPV is generally the more reliable metric because it measures value creation in absolute terms and avoids reinvestment and multiplicity problems. IRR remains useful as a communication tool and a quick screen, particularly when comparing projects of similar scale and duration. A sound practice pairs the two, using IRR for intuition and NPV for the final decision.
When Internal Rate of Return Can Mislead Investors
The Internal Rate of Return (IRR) is a widely used metric in capital budgeting, but it can lead investors astray in several scenarios. One common issue arises with unconventional cash flows, where a project alternates between negative and positive cash flows over its life. In such cases, the IRR equation can yield multiple solutions, making it unclear which rate to use for decision-making. For example, a project with an initial outlay, a subsequent cash inflow, and a later cleanup cost may have two IRRs, both mathematically valid. Investors relying on a single IRR figure might misinterpret the project’s true profitability.
Another limitation is the reinvestment rate assumption inherent in IRR. The calculation assumes that all interim cash flows are reinvested at the IRR itself, which can be unrealistic. If the IRR is significantly higher than the actual reinvestment rate available, the project’s true return may be overstated. This assumption is particularly problematic for projects with high IRRs and long durations, where the compounding effect of reinvested cash flows at the IRR can inflate the apparent return.
IRR also ignores project size and timing differences. When comparing mutually exclusive projects, a smaller project with a high IRR might appear more attractive than a larger project with a lower IRR but higher absolute returns. For instance, a project requiring a $10,000 investment and returning 30% might have a lower net present value than a $1 million project returning 15%. Without considering the scale, investors could choose the smaller project and miss out on greater value creation. Similarly, IRR does not account for differences in cash flow timing. Two projects with the same IRR but different cash flow patterns can have vastly different NPVs, especially when discount rates vary over time. The IRR metric treats all cash flows equally in terms of timing, which can obscure the impact of early versus late cash flows.
In summary, while IRR is a useful tool, investors should be aware of its limitations and consider complementary metrics like NPV to make well-informed decisions.
Choosing the Right Metric for Your Project Evaluation
Selecting between NPV and IRR begins with a clear view of what each metric communicates about a project. NPV translates a project’s future cash flows into today’s dollars, giving a direct estimate of how much value the investment adds to the firm. IRR reports the annualized return the project is expected to earn, expressed as a percentage. Understanding this distinction makes it easier to match the metric to the decision at hand.
Project scale is often the first consideration. When comparing opportunities of similar size, IRR offers an intuitive benchmark that stakeholders can weigh against hurdle rates and the cost of capital. For projects of very different scales, NPV becomes more informative because a small project can post a high percentage return while contributing modest absolute value, whereas a larger project may show a lower IRR yet generate far greater wealth. When the goal is maximizing total value, NPV should carry substantial weight in the final ranking.
Capital constraints shape the analysis as well. Under a fixed budget, the practical question becomes how to allocate limited funds across competing uses. Here IRR can be useful for screening candidates quickly and for ranking projects when capital is rationed, since it highlights the efficiency of each dollar deployed. NPV complements this by showing the absolute value created per project, which helps confirm that the chosen combination of investments delivers the strongest overall outcome within the budget envelope.
In many cases the most reliable approach is to use both metrics together. Calculate NPV to establish whether a project creates value and how much, and calculate IRR to understand the return profile and compare it against financing costs and alternative uses of capital. When the two metrics point in different directions, dig into the underlying cash flow patterns, timing differences, and reinvestment assumptions before making a decision. Documenting both figures in the project evaluation also gives decision-makers a fuller picture and supports clearer communication with investors and senior management. The right choice ultimately depends on the specific decision context, the scale of capital involved, and the organization’s stated objective of maximizing long-term value.
Frequently Asked Questions
What does IRR tell you about an investment?
IRR condenses a stream of cash flows into one annualized percentage: the discount rate at which the project’s net present value becomes zero. It is the break-even cost of capital—discount rates below the IRR produce a positive NPV, while rates above it produce a negative NPV.
How do you calculate IRR by hand when there are multiple cash flows?
With multiple cash flows, the IRR equation becomes a higher-degree polynomial that generally has no simple algebraic solution, so IRR is almost always found through iterative methods. A practical approach is trial and error: guess a rate, compute the NPV, adjust the guess based on whether NPV is positive or negative, and optionally interpolate between bracketing rates.
What Excel function should I use to calculate IRR?
Use =IRR(range) for cash flows that occur at evenly spaced intervals, and use =XIRR(values, dates) when cash flows arrive at irregular intervals. The range should include the initial investment and every subsequent cash flow, with no blank cells or text labels inside it.
What does a positive NPV mean?
A positive NPV means the discounted inflows exceed the discounted outflows, so the project is expected to return more than the required rate and add value. A negative NPV means the project is expected to fall short of the required return, while an NPV of zero means it is expected to earn exactly the required rate.
How is IRR different from NPV?
NPV discounts future cash flows at a rate the analyst selects, typically the company’s cost of capital or hurdle rate, and expresses the result in currency. IRR instead solves for the discount rate that sets NPV to zero and reports a percentage; IRR also implicitly assumes interim cash flows are reinvested at the IRR, while NPV assumes reinvestment at the chosen discount rate.
When can IRR be misleading?
IRR can be misleading when unconventional cash flows alternate between negative and positive, which can yield multiple solutions, and its reinvestment assumption can overstate returns if actual reinvestment rates are lower. It also ignores project size and timing differences, so NPV is generally the more reliable metric for ranking projects and making capital allocation decisions.