
How to Calculate Markup (and How It Differs from Margin)
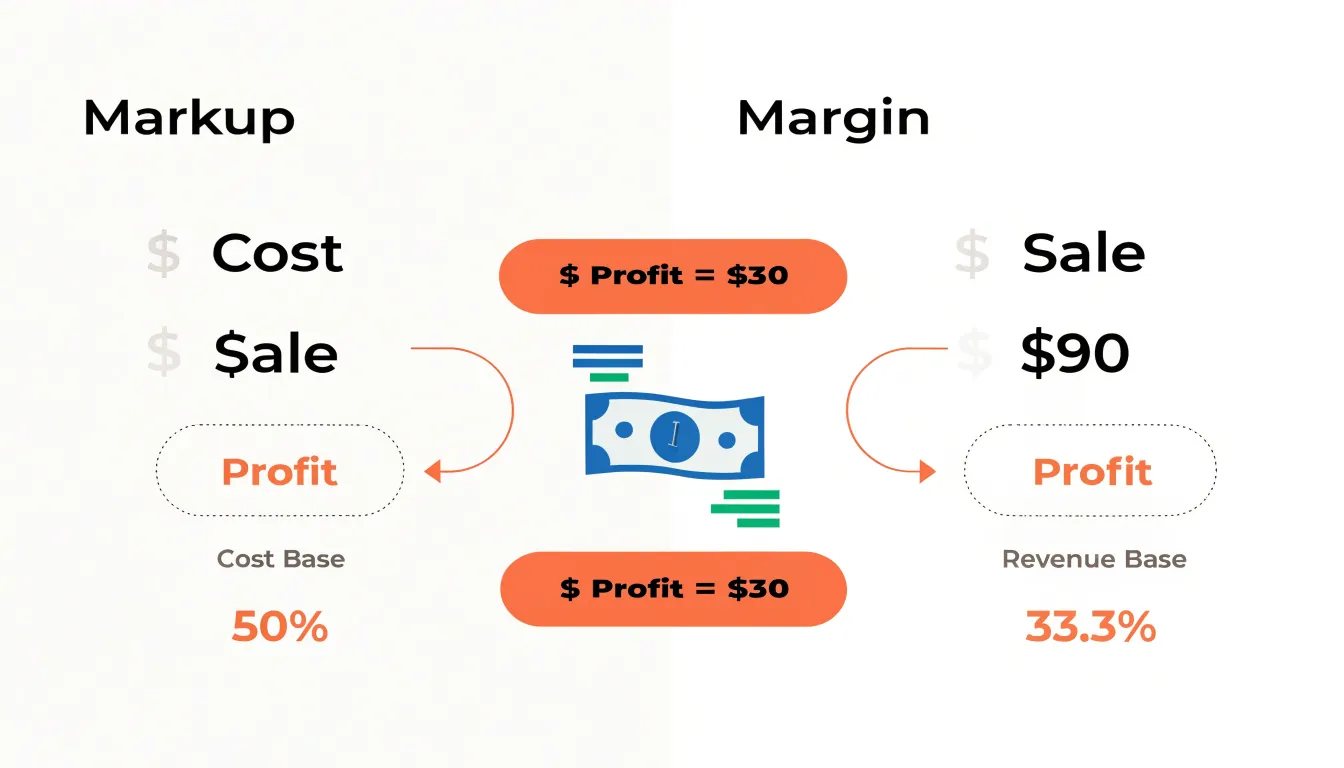
Markup is the percentage added to a product’s cost to set its selling price, calculated as (Price − Cost) / Cost × 100. Margin expresses the same profit as a share of revenue instead, calculated as (Price − Cost) / Price × 100. Because price exceeds cost, markup is always the higher figure: a 50% markup equals a 33.3% margin.
Table of Contents
- The fundamental difference between pricing markup and profit margin
- What happens when you confuse markup with margin?
- How to calculate markup using a simple step by step formula
- Step by step walkthrough
- How to calculate profit margin from total sales revenue
- Math breakdown comparing markup and profit margin on the same product
- Quick conversion guide
- Common pricing mistakes that erode small business revenue
- How to select the right pricing strategy for your business
The fundamental difference between pricing markup and profit margin
Markup and profit margin both describe the relationship between what a product costs you and what you charge for it, yet they measure that relationship from opposite ends of the transaction. Pricing markup is the percentage you add to your cost to arrive at a selling price. If an item costs $60 to produce or acquire and you apply a 50% markup, you add $30 to the cost and set the price at $90. The markup percentage is calculated against the cost base: the $30 addition is half of the $60 cost, hence 50%. Profit margin takes the same $30 and expresses it as a share of the selling price instead. Thirty dollars divided by the $90 price is 33.3%, so the identical transaction carries a 50% markup and a 33.3% margin at the same time. The dollar profit never changes; only the denominator does. Markup divides profit by cost, while margin divides profit by revenue. Because price always exceeds cost in a profitable sale, the revenue base is the larger number, which means the margin percentage will consistently come out lower than the markup percentage applied to the same item. This gap widens as the percentages climb, and that is where much of the confusion in business reporting originates. A company that applies a consistent 100% markup across its catalog might describe its products as earning a 50% margin, and both statements would be accurate. Problems arise when someone casually uses the two terms interchangeably, applying a 40% margin target to a cost calculation and inadvertently pricing the product at a markup that delivers far less profit than intended. Understanding which base each figure uses keeps pricing decisions grounded in the actual economics of the sale, whether the goal is covering overhead, hitting a profit target, or matching competitor prices.
What happens when you confuse markup with margin?
When a business owner mixes up markup and margin, the mistake rarely stays on the spreadsheet. It travels into pricing decisions, sales conversations, and long-term planning, and the damage compounds quietly over time. The most common and immediate consequence is underpricing. Suppose a product costs $60 to make, and the owner wants a 40 percent markup. The correct selling price is $84. If they instead apply 40 percent as a margin and calculate backwards from a guess, or simply add 40 percent to a number they believe represents profit, they can easily land on prices that look reasonable on an invoice while leaving far too little gross profit to cover rent, labor, and overhead. Each sale then contributes less than the business needs, and the shortfall only becomes visible when bills come due.
Overestimating profits follows closely behind. A 40 percent markup on a $60 cost produces $24 of gross profit, which works out to a margin of roughly 28.6 percent. An owner who believes they are earning a 40 percent margin will budget as though every sale carries several extra points of profit. They may commit to new equipment, hire additional staff, or promise investors a return that the underlying numbers cannot support. When actual results arrive, the gap between belief and reality feels like a sudden downturn, even though the arithmetic was wrong from the start.
The ripple effects reach cash flow and strategy. Underpriced products sell quickly, which feels like success, but rapid sales at thin margins drain inventory and generate less cash than expected. Discounts get approved on the assumption of healthy margins, turning modest promotions into loss-making transactions. Loan applications and financial statements built on inflated margin figures can mislead lenders and the owner alike. Perhaps most damaging, these errors distort decisions about which products to push and which to discontinue, since the true profitability of each line remains hidden. The remedy is simple discipline: label every percentage clearly, calculate markup from cost and margin from price, and verify both figures before any pricing decision is finalized.
How to calculate markup using a simple step by step formula
Learning how to calculate markup begins with understanding the single formula that drives the entire process. The markup percentage is expressed as Markup % = (Price – Cost) / Cost × 100. In this formula, Price represents the selling price you charge to customers, and Cost represents what you paid to acquire or produce the item. The difference between those two figures is your gross profit in dollar terms, and dividing that profit by the cost tells you how much you are marking up the item relative to what you spent. Multiplying by 100 converts that ratio into an easy-to-read percentage.
The calculation becomes clearer when you walk through an example. Imagine you run a small retail shop and purchase a lamp from a supplier for $40. You decide to sell that lamp to your customers for $60. The first step is to subtract the cost from the price: $60 minus $40 equals $20. That $20 is your gross profit on the sale. The second step is to divide that profit by the cost: $20 divided by $40 equals 0.5. The third step is to multiply by 100, which gives you 50. Your markup on the lamp is therefore 50 percent, meaning you added half of the wholesale cost on top of it to arrive at the selling price.
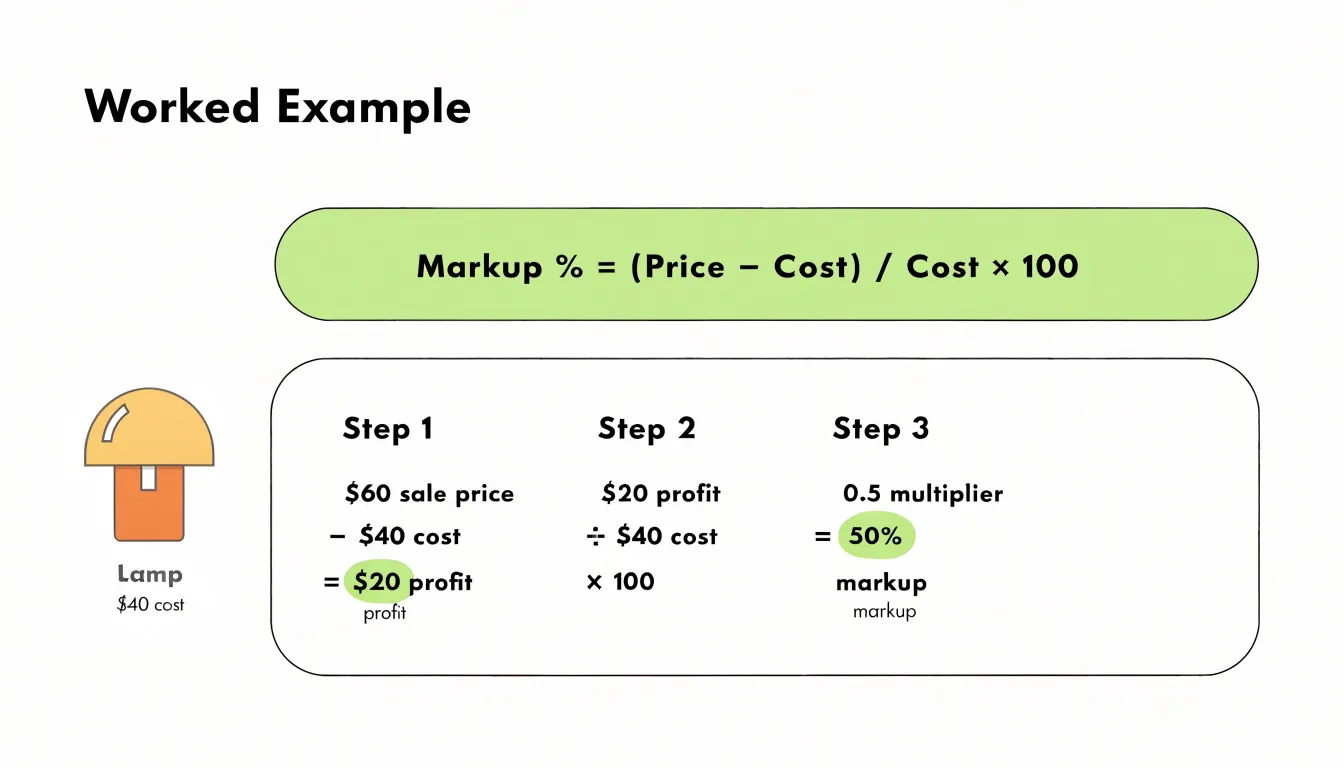
It helps to work through the steps in a consistent order every time. Start by identifying the cost figure, since it serves as the denominator in the formula. Next, identify the selling price. Subtract cost from price to find the profit amount. Divide the profit by the cost, then multiply by 100 to express the result as a percentage. Following this sequence keeps the arithmetic straightforward and reduces the chance of mixing up the numbers.
Once you are comfortable with the formula, you can also run it in reverse to set prices. If you know your cost and the markup percentage you want to apply, multiply the cost by the markup percentage, then add that amount back to the cost to arrive at the selling price. In the lamp example, a $40 cost with a 50 percent markup yields a $20 addition, producing the $60 price. This flexibility makes the markup formula a practical tool for both analyzing past sales and planning future pricing decisions.
Step by step walkthrough
Pricing a retail product begins with a clear understanding of your true cost. Imagine a small retailer sourcing a line of insulated water bottles from a supplier at $12 per unit. That $12 is the starting point, but the full cost picture often includes inbound freight, duties, and handling, which might add another $1.50 per bottle, bringing the landed cost to $13.50. Establishing this accurate base figure matters, because every later calculation builds on it.
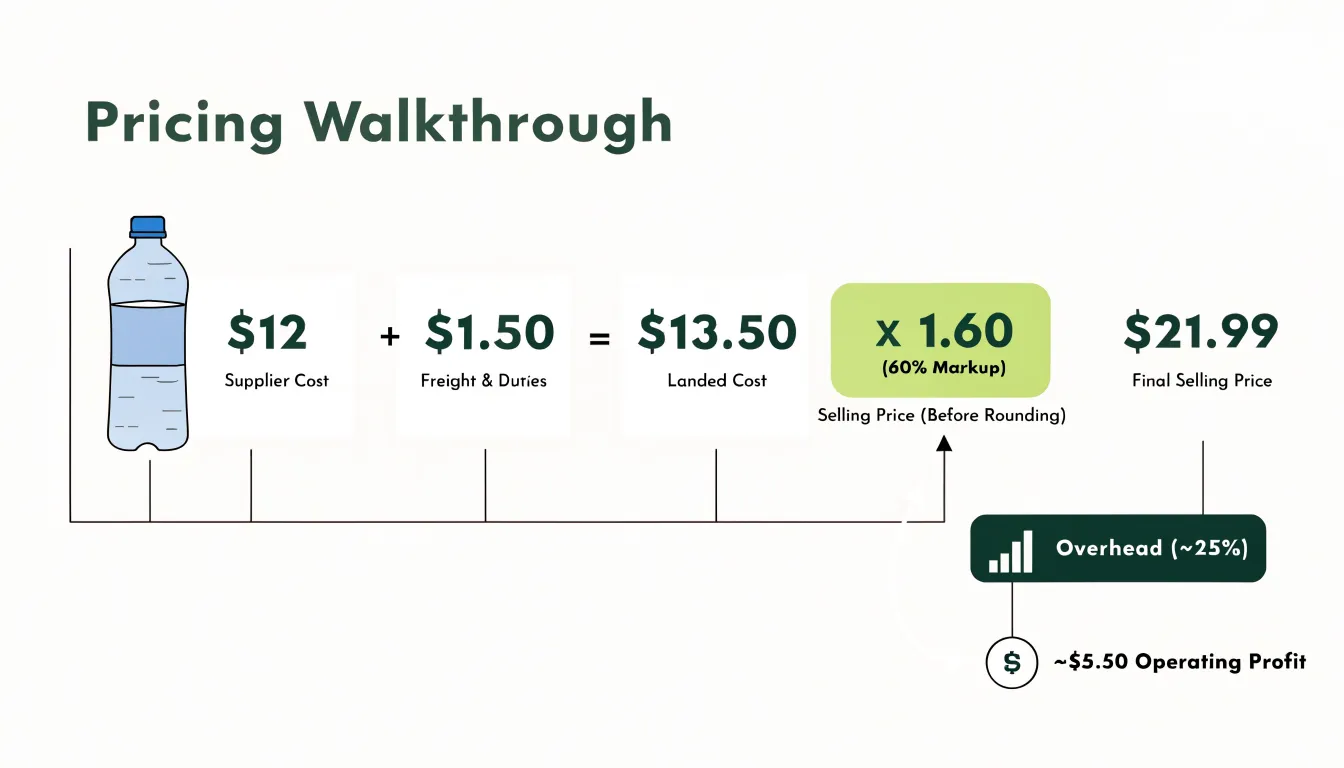
With cost in hand, the next step is choosing a target markup. Many retailers in this category aim for a markup of around 50% to 100%, depending on the product’s market position. Suppose the retailer settles on a 60% markup. The markup formula takes the cost and multiplies it by one plus the markup percentage expressed as a decimal: $13.50 × 1.60, which gives a selling price of $21.60. Rounding to a customer-friendly $21.99 keeps the pricing clean while preserving the intended profit per unit of roughly $8.49.
That gross profit has to carry more than the product itself. Overhead is the next consideration. Rent, utilities, staff wages, payment processing fees, insurance, and marketing all draw from the margin between cost and price. A common approach is to estimate overhead as a percentage of sales and check whether the chosen markup leaves enough room. If overhead consumes, say, 25% of each sale, the retailer keeps about $5.50 per bottle as operating profit before taxes, which may or may not be adequate depending on volume and fixed expenses.
Competition shapes the final decision as well. If similar bottles sell locally for $18 to $20, a $21.99 price may push customers toward rivals unless the product offers distinct features or strong branding. Conversely, if competing bottles retail near $26, the $21.99 price leaves room to raise the markup and improve profit without losing appeal. Retailers often review competitor pricing before finalizing a number, then adjust the markup up or down to balance profitability with market reality.
The walkthrough ends with a documented price: cost of $13.50, markup of 60%, selling price of $21.99, and a clear view of how much each sale contributes toward overhead and profit. Repeating this process across a product line builds consistent, defensible pricing decisions.
How to calculate profit margin from total sales revenue
Profit margin expresses how much of every dollar of sales a business actually keeps as profit, and calculating it from total sales revenue is one of the simplest and most revealing exercises an owner can perform. The formula is straightforward: Margin % = (Revenue – Cost) / Revenue × 100. Revenue here means total sales revenue, the full amount collected from customers before any expenses are deducted. Cost refers to the direct cost of the goods or services sold, often called cost of goods sold or COGS. Subtracting cost from revenue gives gross profit, and dividing that figure by revenue converts it into a percentage of sales.
To see how this works in practice, imagine a small furniture retailer that records total sales revenue of $50,000 for a month. The cost of the furniture it sold during that period, including what it paid suppliers plus freight, comes to $30,000. Gross profit is therefore $50,000 minus $30,000, or $20,000. Dividing $20,000 by $50,000 gives 0.40, and multiplying by 100 produces a profit margin of 40 percent. In plain terms, the retailer keeps 40 cents of profit from every dollar of sales, with the remaining 60 cents covering the cost of the products sold.
The same calculation scales down to individual products or up to annual figures. If a bakery generates $8,000 in weekly sales and spends $5,600 on ingredients, packaging, and the labor directly tied to production, its profit margin is ($8,000 – $5,600) / $8,000 × 100, which equals 30 percent. Running the numbers at both the product level and the total sales level helps confirm that the overall figure reflects what is happening across the catalog.
A few practical notes make the calculation more reliable. Use revenue net of returns and discounts, so the percentage reflects money the business actually keeps. Match costs to the same period as the revenue, and include only direct costs in this formula. Tracking margin over several months reveals trends that a single snapshot can hide, and comparing margins across product lines shows where the business earns its strongest returns.
Math breakdown comparing markup and profit margin on the same product
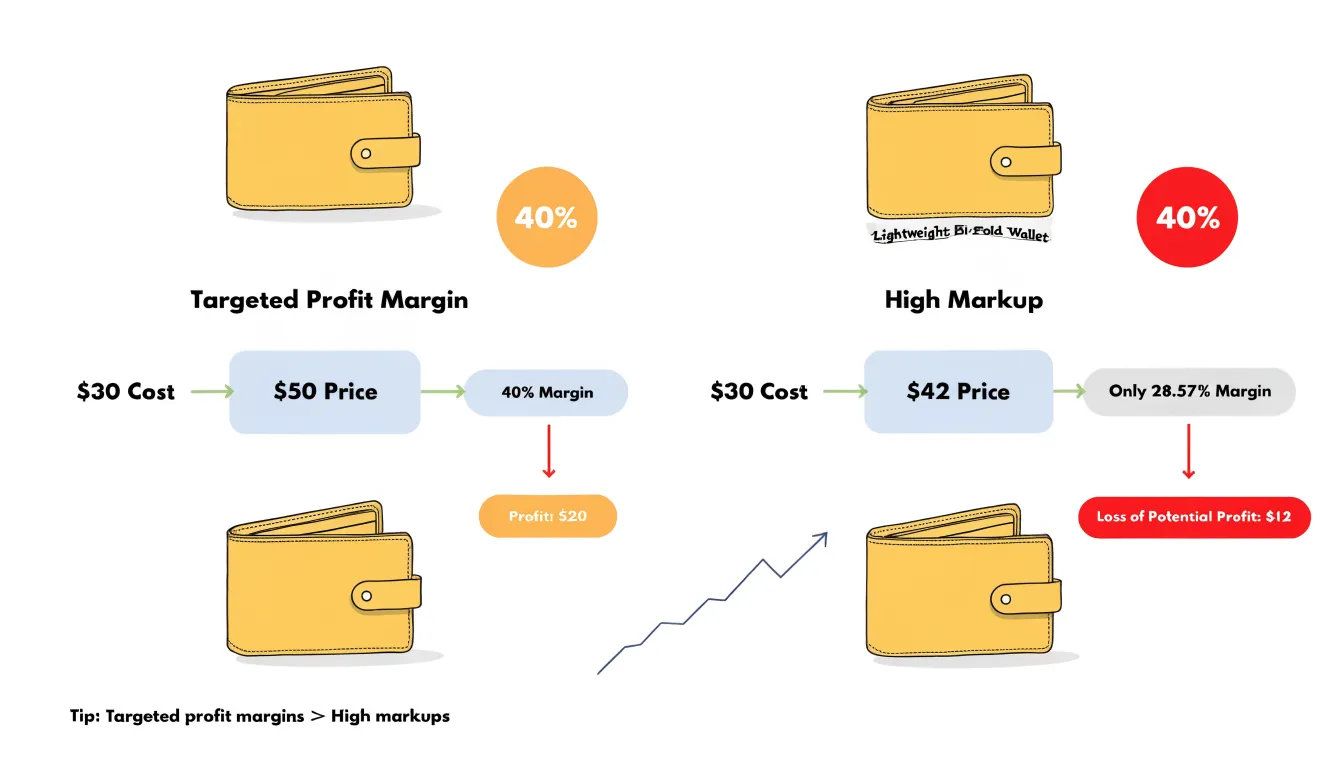
To see how markup and margin diverge in practice, consider a single product: a handcrafted leather wallet that costs $30 to produce and sells for $50. The profit on each sale is $20, the difference between the selling price and the cost. Markup expresses this profit as a percentage of the cost. Dividing the $20 profit by the $30 cost yields 0.6667, or 66.67%. This tells you that the selling price is 66.67% above the cost. Margin, by contrast, expresses the same $20 profit as a percentage of the selling price. Dividing $20 by $50 gives 0.40, or 40%. So the identical $20 profit appears as a 66.67% markup and a 40% margin.
The percentages differ because they use different bases. Markup uses cost as its denominator, while margin uses revenue. Since the selling price is always higher than the cost for a profitable product, the markup percentage will consistently exceed the margin percentage. The gap widens as the profit grows relative to cost. For example, if the wallet sold for $60, the profit would be $30. Markup would be $30 ÷ $30 = 100%, and margin would be $30 ÷ $60 = 50%. The markup doubled, but the margin rose only from 40% to 50%. This illustrates that a 100% markup corresponds to a 50% margin, a common source of confusion in pricing discussions.
Understanding this relationship is crucial for setting prices and evaluating profitability. A business that aims for a 40% margin must set the selling price at cost divided by (1 minus the desired margin). For the $30 wallet, that means $30 ÷ (1 − 0.40) = $50. Conversely, if a business applies a 40% markup to the $30 cost, the selling price becomes $42, yielding only a 28.57% margin ($12 ÷ $42). Misinterpreting markup as margin can lead to underpricing and eroded profits. By working through a concrete example like the wallet, it becomes clear that markup and margin are two sides of the same coin, each offering a different perspective on the same financial reality.
Quick conversion guide
Converting a markup percentage into a margin percentage is one of the most practical skills in pricing, and the formula is refreshingly simple. Take your markup expressed as a decimal, divide it by one plus that same decimal, and you have your margin. Written out: Margin % = Markup % / (1 + Markup %). If your markup is 25%, convert it to 0.25, then divide by 1.25 to get 0.20, or a 20% margin. That single calculation tells you that for every dollar of sales, twenty cents remains after covering the cost of the item.
A quick table makes the relationship easy to scan during everyday pricing work. A 10% markup equals about a 9.1% margin. A 20% markup converts to a 16.7% margin, and a 25% markup to 20%. Moving up, a 33.3% markup lands on a 25% margin, a 50% markup becomes a 33.3% margin, and a 100% markup becomes a 50% margin. At the higher end, a 200% markup works out to a 66.7% margin. Having these pairs memorized or printed near your pricing spreadsheet saves time and prevents confusion when a supplier, colleague, or client quotes figures using the other convention.
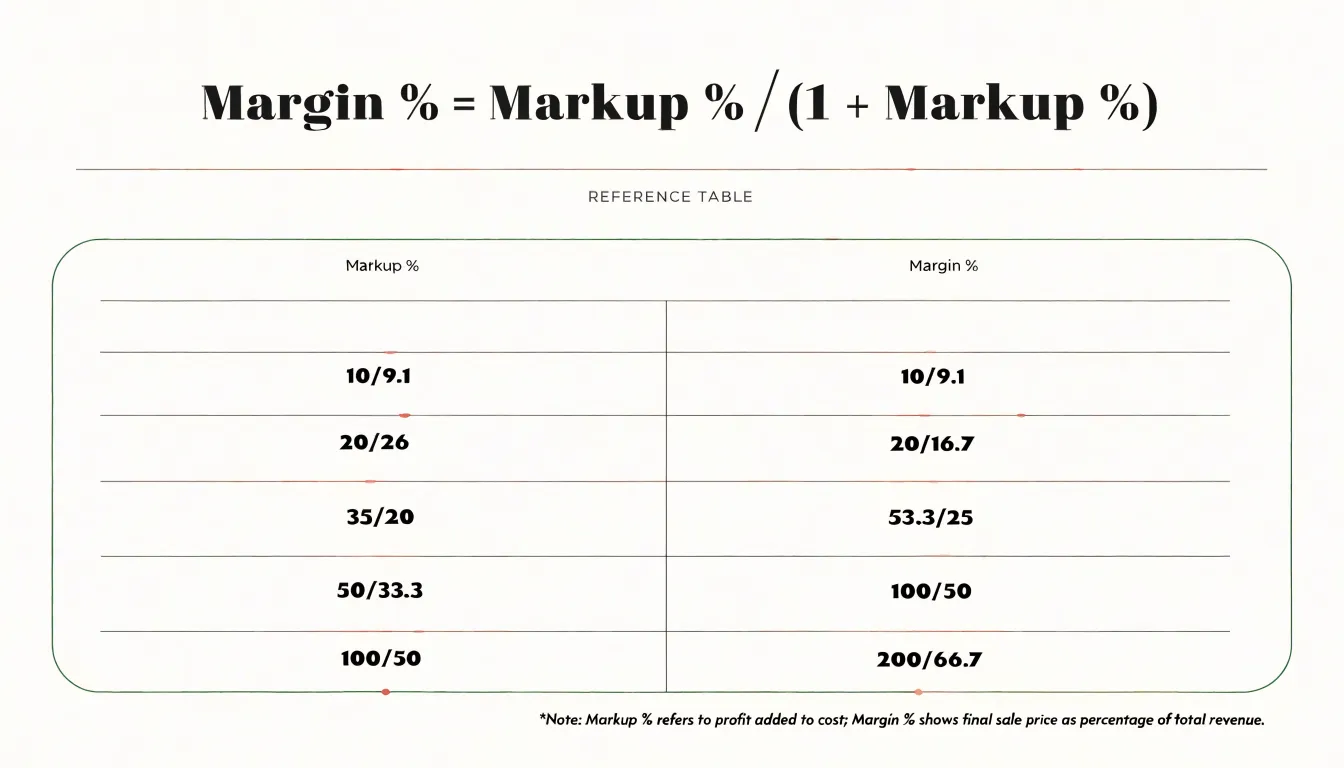
Worked examples help cement the habit. Suppose you sell a product for $80 that cost you $60, giving a $20 markup. As a percentage of cost, that is 20 ÷ 60, or 33.3% markup. Running the conversion, 0.333 ÷ 1.333 gives 0.25, a 25% margin. In reverse, if a target margin of 40% is required, divide 0.40 by 1 minus 0.40 to get 0.667, a 66.7% markup. Notice how the margin figure is always lower than the markup figure, and the gap widens as percentages climb. This happens because markup is measured against cost while margin is measured against the selling price, which is always the larger base. Keeping the conversion formula and a short reference table on hand makes it easy to translate between the two measures accurately, whether you are reviewing a single product, negotiating with a vendor, or setting prices across an entire catalog.
Common pricing mistakes that erode small business revenue
Pricing errors rarely announce themselves. They accumulate quietly, shrinking margins a few percentage points at a time until a business that looks busy on paper finds itself struggling to cover its bills. The most common mistakes follow recognizable patterns, and each one can be corrected once it is identified.
Treating markup as margin is the most frequent and costly confusion. A product priced at a 50 percent markup yields only a 33 percent margin, because margin is calculated on the selling price while markup is calculated on cost. Business owners who apply a target margin figure as if it were a markup end up underpricing every item, and the shortfall compounds across every sale. The fix is simple: decide which number the business needs, convert between the two deliberately, and document the formula so it is applied consistently.
Ignoring overhead costs is another common trap. Pricing based only on the direct cost of goods leaves rent, insurance, software, salaries, and marketing unpaid. A product can show a healthy gross margin and still lose money once indirect expenses are allocated. A practical approach is to calculate a fully loaded cost per unit by spreading fixed overhead across expected sales volume, then build the price from that base.
Failing to account for discounts is a quieter leak. When a business offers a 10 percent discount, it must sell roughly 11 percent more units just to hold the same revenue, and considerably more to hold the same profit. Promotional pricing should be planned in advance, with the volume increase required to break even calculated before the discount is announced.
Finally, many small businesses set prices once and never revisit them. Costs rise steadily through supplier increases, wage adjustments, and inflation, and a price that was profitable two years ago may barely break even today. Building a scheduled pricing review, whether quarterly or annually, keeps prices aligned with current costs. Reviewing supplier invoices, tracking cost trends, and setting a clear threshold for automatic review all help.
Avoiding these mistakes comes down to discipline: tracking costs accurately, understanding the relationship between markup and margin, planning discounts with numbers attached, and treating pricing as an ongoing process rather than a one-time decision.
How to select the right pricing strategy for your business
Selecting the right pricing strategy begins with understanding the three foundational approaches available to most businesses and the situations where each one works best. Cost-plus pricing starts with your total costs and adds a fixed markup percentage on top. This approach is straightforward, easy to communicate to your team, and ensures every sale covers its costs plus a predictable profit. It suits businesses with stable cost structures, such as manufacturers, wholesalers, or service providers delivering repeatable work, where customers are price-aware and comparisons are simple.
Value-based pricing works from the opposite direction. It sets prices according to what customers believe the product or service is worth, drawing on the outcomes it delivers, the time it saves, or the problems it solves. A consultant who saves a client weeks of effort, or a software tool that increases a team’s output, can command prices far above their underlying costs because the perceived value justifies it. This strategy rewards businesses with a differentiated offering and a clear understanding of their customers’ priorities, and it typically requires solid market research and confident communication of benefits.
Competitive pricing positions your offer relative to what rivals charge. You might price below the market to win volume, match competitors to stay neutral, or price above them to signal quality and exclusivity. This approach keeps you responsive to market conditions and is common in crowded categories where customers can easily compare alternatives. It demands regular monitoring of competitor prices and a clear rationale for where you sit in the landscape.
Aligning the chosen strategy with your business goals matters as much as the method itself. A goal of rapid market share growth may point toward competitive pricing with lean markups, while a goal of premium brand positioning calls for value-based pricing supported by strong differentiation. Consider your target market’s sensitivity to price, their buying habits, and what they value most. Finally, connect pricing to your profit objectives by modeling how each strategy affects revenue, volume, and margins, then reviewing prices regularly as costs, competition, and customer expectations shift over time.
Frequently Asked Questions
What is the difference between markup and profit margin?
Markup is calculated against cost and is the percentage added to cost to reach a selling price, while margin expresses the same dollar profit as a share of selling price or revenue. For example, $30 profit on a $60 cost and $90 price is a 50% markup but a 33.3% margin.
How do you calculate markup on a product?
Use Markup % = (Price – Cost) / Cost × 100. For example, a $40 lamp sold for $60 has $20 profit, so $20 ÷ $40 × 100 = 50% markup.
How do you calculate profit margin from total sales revenue?
Use Margin % = (Revenue – Cost) / Revenue × 100, where revenue is total sales and cost is the direct cost of goods sold. For example, $50,000 revenue and $30,000 cost gives $20,000 gross profit and a 40% margin.
What happens when you confuse markup with margin?
Confusing markup with margin can lead to underpricing and overestimating profits, and those errors can distort cash flow, discounts, loan applications, and product decisions. The article recommends labeling every percentage clearly, calculating markup from cost and margin from price, and verifying both figures before finalizing pricing.
How do you convert markup percentage to margin percentage?
Convert markup to margin with Margin % = Markup % / (1 + Markup %), using markup as a decimal. For example, a 25% markup becomes 0.25 ÷ 1.25 = 20% margin.
What are the main pricing strategies for a small business?
The article describes cost-plus pricing, value-based pricing, and competitive pricing. Choose based on business goals, target market price sensitivity and buying habits, and profit objectives, then review prices regularly as costs, competition, and customer expectations shift.