
How to Calculate NPV
Net present value (NPV) is the sum of all future cash flows discounted to today’s value at a required rate of return, minus the initial investment. A positive NPV means the project creates value above the discount rate; a negative NPV means it destroys value; zero means it exactly meets the required return.
Table of Contents
- What Net Present Value Tells You About an Investment
- Understanding the Core Formula
- Why the Time Value of Money Matters for Your Cash Flow
- Step by Step Guide to Gathering Your Financial Inputs
- Worked Example
- How Do You Choose the Right Discount Rate
- Calculating Net Present Value Quickly Using Excel or Google Sheets
- Common Calculation Mistakes That Distort Your Results
- What Does a Positive or Negative NPV Mean for Your Decision
What Net Present Value Tells You About an Investment
Net present value converts every future cash flow an investment is expected to produce into today’s dollars, then compares that total against the amount of money required to launch the project. The result is a single figure expressed in currency, and that figure answers a direct question: once the cost of capital and the erosion of purchasing power over time are stripped out, how much wealth does this investment genuinely create or destroy? A positive NPV means the projected inflows, discounted back to the present, exceed the upfront outlay by that margin. A negative NPV means the project is expected to return less than the money tied up in it, leaving the investor worse off than if the funds had simply earned their required rate of return elsewhere.
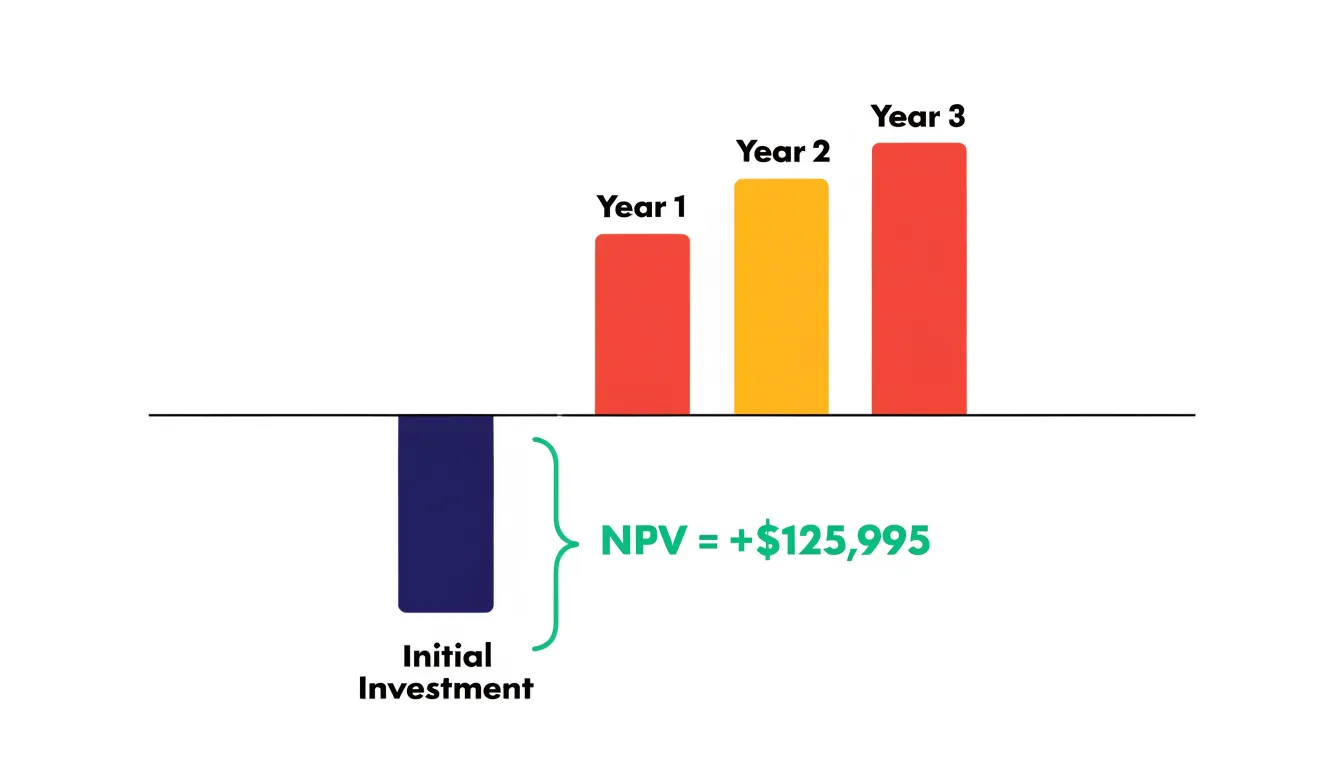
The mechanics rest on the time value of money. A dollar received three years from now is worth less than a dollar in hand today, because today’s dollar can be invested and grow. NPV handles this by applying a discount rate, typically the investor’s cost of capital or a hurdle rate reflecting the risk of the project, to each future cash flow. The further out the cash flow and the higher the discount rate, the more its present value shrinks. Summing the discounted inflows and subtracting the initial investment produces the net figure. This process gives every dollar of future benefit a common yardstick, making projects with different timelines and cash-flow patterns directly comparable.
The go/no-go quality of NPV follows from its arithmetic. Because the discount rate already represents the return an investor could earn on comparable alternatives, any positive NPV signals that the project beats that benchmark in absolute dollar terms. Zero NPV indicates the project earns exactly the required return and no more. Negative NPV warns that the capital would perform better in its next-best use. Managers and investors use these thresholds as decision rules: accept projects above zero, reject those below, and rank competing proposals by the size of their NPV when capital is limited. The dollar-denominated output also communicates scale, showing whether a venture adds a marginal amount of value or a transformative one, which helps decision-makers weigh an investment against its alternatives with clarity.
Understanding the Core Formula
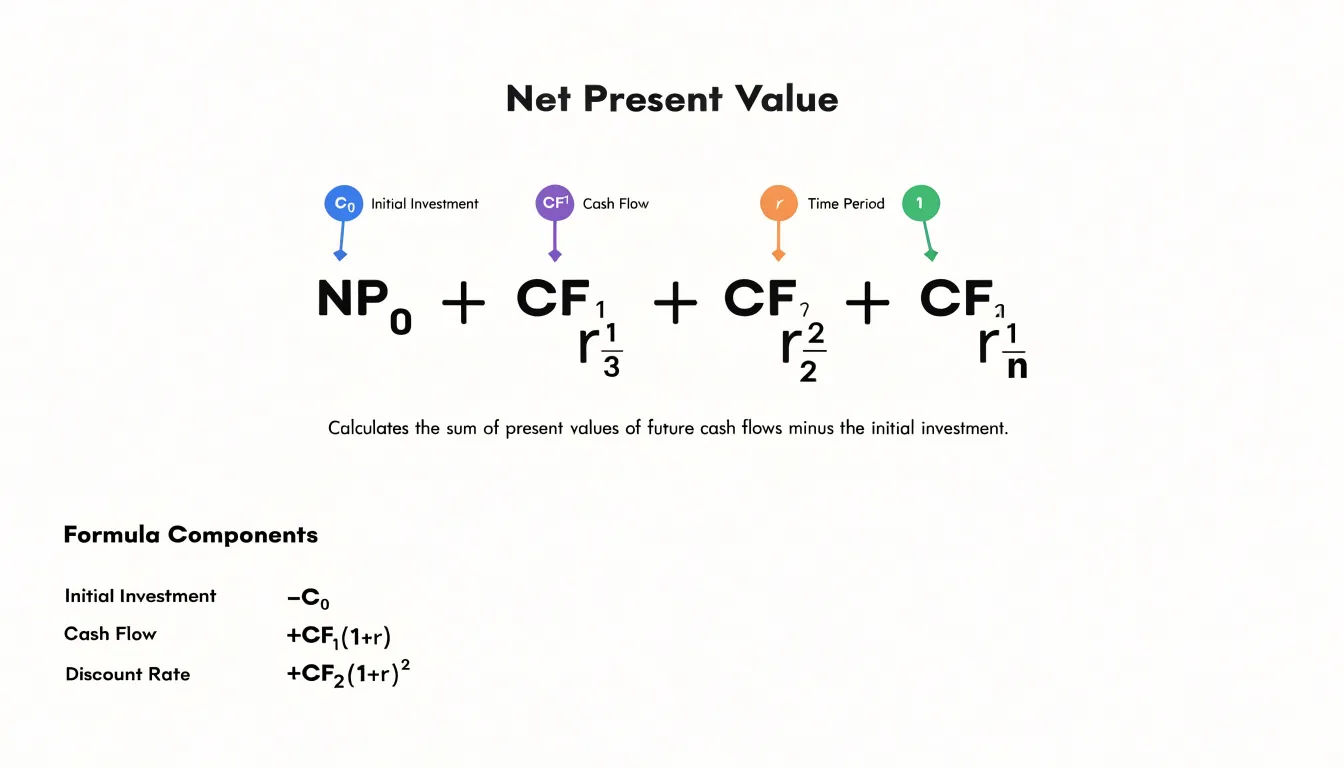
The NPV equation rests on four inputs, and each one carries a distinct meaning within the calculation. The initial investment, typically written as C₀, represents the upfront cost of the project, purchase, or decision being evaluated. It is entered as a negative number because it is cash leaving your hands at time zero, before any returns begin. Getting this figure right matters, since every subsequent cash flow is measured against it.
Periodic cash flows, often labeled CF₁ through CFₙ, are the expected amounts of money coming in or going out during each period after the initial outlay. These might be revenues from an investment, cost savings from a new piece of equipment, or any other incremental cash movement tied to the decision. Each period’s flow is entered separately because the formula discounts them individually, so a project with uneven returns is handled just as easily as one with steady payments.
The discount rate, usually denoted r, expresses the opportunity cost of capital—the return you could reasonably expect from an alternative investment of similar risk. It also captures the time value of money: a dollar received today is worth more than a dollar received later, and the discount rate quantifies that difference. A higher rate shrinks the present value of future cash flows, reflecting greater risk or a more attractive alternative use of the funds.
Finally, the time periods, represented by t or n, define when each cash flow occurs. The variable t indexes each period so the formula knows how many compounding periods to apply when discounting that particular flow. A cash flow arriving in year three is divided by (1 + r) cubed, while one arriving in year one is divided by (1 + r) once.
Together, these four variables produce the net present value: the sum of all discounted future cash flows minus the initial investment. When the result is positive, the projected returns exceed the cost of capital at the chosen discount rate. Each input therefore shapes the outcome directly, and small changes in any one of them—especially the discount rate—can shift the final figure substantially.
Why the Time Value of Money Matters for Your Cash Flow
The time value of money rests on a simple observation: a dollar received today can be put to work immediately, while a dollar promised for tomorrow cannot. Money has earning potential. Deposit a dollar in an interest-bearing account, and it grows. Invest it in a business, and it may grow faster still. Because of this potential, any delay in receiving cash carries a cost. A dollar that arrives a year from now is worth less than a dollar in hand today, and the further into the future a payment sits, the more its value erodes. This principle sits at the heart of every net present value calculation, because NPV exists precisely to translate future dollars into today’s terms so that they can be compared on equal footing.
Discounting is the mechanism that performs this translation. Each future cash flow is divided by a factor that grows with time, shrinking distant cash flows more than near ones. The rate used for discounting captures two distinct forces. The first is opportunity cost: the return you could have earned by putting that money into its next best alternative use. If your capital could earn eight percent elsewhere, receiving a payment later means forgoing that eight percent, and the discount rate accounts for the foregone gain. The second force is inflation, the steady rise in prices that reduces what any given sum of money can buy. A payment fixed at a thousand dollars five years from now purchases less than a thousand dollars purchases today, so inflation erodes purchasing power across time.
Combining these forces explains why a large cash inflow far in the future may contribute surprisingly little to NPV. A payment projected for year ten might look impressive on paper, yet after discounting at a rate that reflects both opportunity cost and inflation, its present value may shrink dramatically. Ignoring the time value of money leads to a common and costly error: treating all future cash flows as though they were received today. A project can appear profitable under that assumption and turn out to be a poor use of capital once the timing of cash flows is properly weighed. Discounting future cash flows gives you a realistic, comparable picture of what a stream of payments is truly worth right now, which is the foundation for sound investment decisions.
Step by Step Guide to Gathering Your Financial Inputs
Before any NPV calculation, an analyst needs a firm grasp of three categories of financial inputs: the initial investment, the stream of future cash flows, and the discount rate. Treat each as a separate research task, because each carries its own sources of error.
Start with the initial cost. This encompasses every outlay required to get a project off the ground: equipment purchases, installation, permits, working capital, training, and any one-time setup expenses. Go through vendor quotes and internal estimates line by line, and add a contingency of ten to fifteen percent to absorb the surprises that almost always appear. Record the figure as a single negative cash flow occurring at time zero.
Next, build the future cash flow schedule. For each period, estimate inflows such as sales revenue, cost savings, or salvage value, and subtract outflows such as operating expenses, maintenance, and taxes. Speak with the people closest to the operation, since their knowledge grounds projections in reality. Where historical data exist, use them as a baseline, then adjust for known changes in pricing, volume, or costs. Present the result as a clear table with one row per period, and keep the assumptions behind each number visible so reviewers can challenge them.
The discount rate is the most consequential and most subjective input. It reflects the opportunity cost of capital, meaning the return the organization could earn on an investment of comparable risk. Many teams begin with the company’s weighted average cost of capital and then add a risk premium for ventures that are less certain. A higher rate penalizes distant cash flows more heavily, so a small change in this input can swing the NPV substantially. Run the calculation with a base case plus a lower and higher rate to see how sensitive the result is.
Finally, audit the assembled inputs: confirm that the timing of each cash flow aligns with the discount periods, verify that signs are consistent, and check that the initial outlay is not double-counted in later periods. Clean inputs are the foundation of a trustworthy NPV figure.
Worked Example
To see how NPV comes together in practice, consider a manufacturing company evaluating a new production line. The equipment costs $500,000 upfront, including installation. Management projects the line will generate net cash inflows of $150,000 in year one, $180,000 in year two, $200,000 in year three, $170,000 in year four, and $120,000 in year five, after which the equipment is expected to have no salvage value. The company’s required rate of return, used as the discount rate, is 10 percent.
The first step is to lay out each year’s cash flow alongside its discount factor, calculated as 1 divided by (1 + 0.10) raised to the power of the year number. Year one’s factor is 0.9091, year two’s is 0.8264, year three’s is 0.7513, year four’s is 0.6830, and year five’s is 0.6209. Multiplying each cash flow by its factor produces the present value: $136,365 for year one, $148,752 for year two, $150,260 for year three, $116,110 for year four, and $74,508 for year five. The initial $500,000 outlay occurs at time zero, so its factor is 1.0 and its present value remains $500,000.
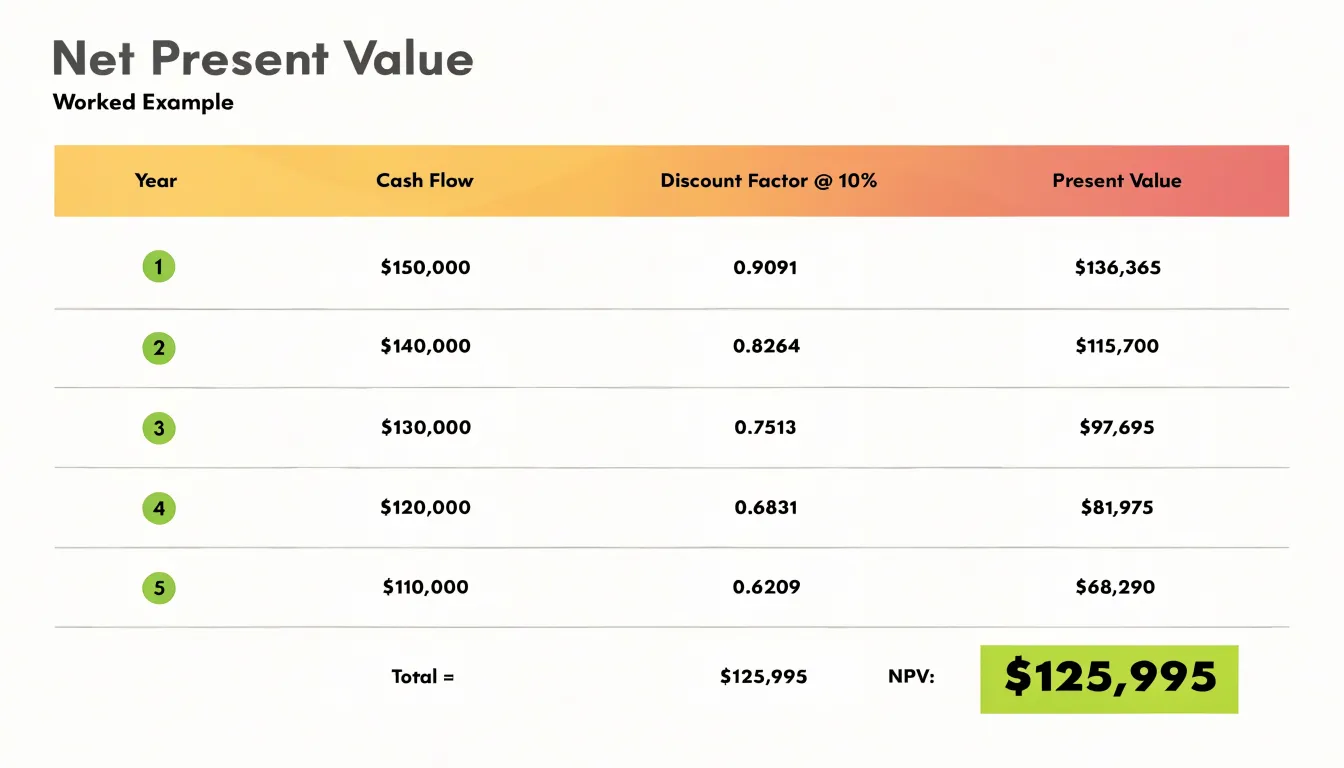
Summing the discounted inflows gives $625,995. Subtracting the $500,000 initial investment yields an NPV of $125,995. Because this figure is positive, the project is expected to add value above the 10 percent return the company requires. Put another way, after recovering the investment and earning the required return on capital, the project leaves roughly $126,000 in additional value for the firm. A negative result would have signaled that the project fails to clear the hurdle rate, while a result near zero would indicate the project merely meets the required return.
The example also illustrates NPV’s sensitivity to the discount rate. At a higher rate, say 15 percent, the discount factors shrink and the present value of later cash flows falls sharply, narrowing the margin of approval. This is why analysts often pair the base-case calculation with sensitivity checks on both the discount rate and the cash flow estimates.
How Do You Choose the Right Discount Rate
Choosing the right discount rate is one of the most consequential judgment calls in an NPV analysis, because the rate you plug in effectively encodes every assumption you hold about risk, opportunity cost, and the value of money over time. The most common starting point is the cost of capital. For a company, this usually means the weighted average cost of capital, which blends the after-tax cost of debt with the cost of equity in proportion to the firm’s target capital structure. The cost of capital represents the minimum return the business must earn to satisfy its lenders and shareholders, so discounting at this rate answers a simple question: does the project clear the hurdle set by the people funding it? For an individual investor, the analogue is the return available on comparable investments, such as a diversified portfolio or a bond of similar duration and credit quality.
Risk adjustment comes next. A project with predictable, contract-backed cash flows can reasonably be discounted at a rate close to the cost of capital, while a venture into a new market, an untested product line, or an early-stage company warrants a higher rate. Analysts often build this in through a risk premium added to the base rate, or through scenario and sensitivity analysis that shows how the outcome shifts under different assumptions. The required rate of return is the investor’s own threshold, the return that makes the effort and illiquidity worthwhile; it may sit above the calculated cost of capital when capital is scarce or when alternative uses of funds are especially attractive.
The choice of rate has a dramatic effect on the result because discounting compounds over time. A project with long-dated cash flows is far more sensitive to rate changes than one that pays back quickly. Moving the discount rate from 8 percent to 12 percent can turn a comfortably positive NPV into a negative one, flipping the investment decision entirely. This sensitivity is why good practice involves testing a range of rates, reporting the internal rate of return alongside NPV, and documenting the reasoning behind the chosen rate so that reviewers can challenge the assumptions rather than the arithmetic.
Calculating Net Present Value Quickly Using Excel or Google Sheets
Spreadsheet software turns NPV calculation into a quick, repeatable task once the cash flow timeline is laid out correctly. The first step is building a clean timeline in a single column: list each period in order (Year 0, Year 1, Year 2, and so on) beside a matching column of cash flows, with outflows entered as negative numbers and inflows as positive numbers. Keep the initial investment in its own row at the top of the table, because the timing convention matters: the NPV function in both Excel and Google Sheets discounts every value in the range as if it arrives at the end of a period. That means the period-zero cash flow, which occurs today, should normally be added outside the function rather than included inside the range.
With the timeline in place, the NPV function does the heavy lifting. Its syntax is NPV(rate, value1, [value2], …), where the rate is the per-period discount rate expressed as a decimal, such as 0.08 for eight percent. If the cash flows sit in cells B2 through B6 and the rate is in cell E1, the formula reads =NPV(E1, B2:B6). For a project with an upfront cost in B1, the complete calculation becomes =B1 + NPV(E1, B2:B6). The result is the present value of all future cash flows net of the initial outlay. If the discount rate is annual but cash flows arrive monthly, divide the annual rate by twelve before entering it in the formula so that the rate and the period length match.
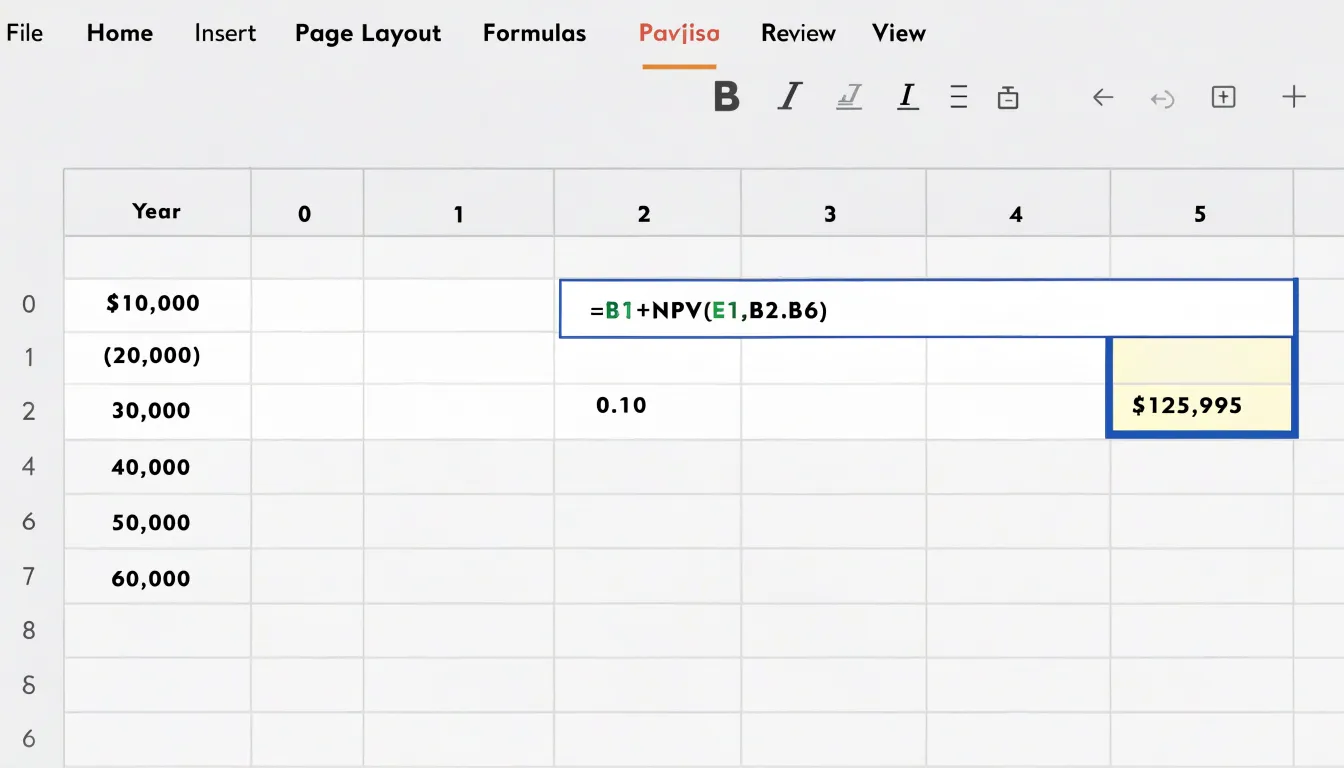
For faster work, a common shortcut bundles the rate and range into a single formula and adds the initial investment directly, for example =B1+NPV(E1,B2:B6), which can be copied down a column to compare several projects side by side. You can also reference a named range for the cash flows, making the formula easier to read, and use absolute references like $E$1 to lock the discount rate when filling the formula across multiple rows. A quick sanity check is to set the rate to zero: the formula should then return the simple sum of the cash flows, confirming the timeline is entered correctly.
Common Calculation Mistakes That Distort Your Results
Several common calculation mistakes can significantly distort your NPV results, and recognizing them early can save you from making poor investment decisions based on misleading numbers. One frequent error is forgetting to include the initial investment as a negative cash flow in Year 0. When you omit the upfront cost, every subsequent calculation treats the project as though it were free to start, which inflates the NPV and can make even unprofitable ventures appear attractive. The initial outlay must always anchor the calculation as the first term in your series.
Another pitfall involves mixing nominal and real cash flows. Nominal cash flows include the effects of inflation, while real cash flows are adjusted to remove them. If your projected cash flows are stated in nominal terms, your discount rate must also be nominal. Pairing nominal cash flows with a real discount rate, or the reverse, produces a mismatch that systematically overstates or understates the present value. Consistency between the two is essential: decide which convention you are using and apply it throughout the entire calculation.
Using the wrong discount rate is equally damaging. The discount rate should reflect the risk profile of the project and the opportunity cost of capital, often captured by the weighted average cost of capital or a rate tailored to the project’s specific risk. Plugging in a rate that is too low makes risky projects look safe, while an overly high rate may cause you to reject sound investments.
Inconsistent timing of cash flows is a subtle but common error. NPV assumes cash flows occur at discrete intervals, typically at the end of each period. If some cash flows are recorded as occurring at the beginning of the year while others are assigned to year-end, the discounting becomes uneven. Similarly, counting the same cash flow twice or miscounting the number of periods shifts the present value. Establishing a clear timeline and applying it consistently across every cash flow keeps the calculation reliable.
What Does a Positive or Negative NPV Mean for Your Decision
Once you have calculated a net present value figure, the number itself carries a clear decision signal. A positive NPV means the projected cash flows, discounted back to today’s dollars, exceed the initial investment. In practical terms, the project is expected to create value above and beyond the return required by your discount rate. For a standalone decision, a positive result supports acceptance of the project, since undertaking it should leave the business better off than walking away. The size of the positive figure also tells you how much margin of safety exists; a large positive NPV suggests the project can absorb some forecasting error and still remain worthwhile.
A negative NPV points in the opposite direction. The discounted benefits fall short of the cost, meaning the project is expected to destroy value relative to the return your capital could earn elsewhere. For an accept-or-reject decision, a negative result typically leads to rejection. Keep in mind that a negative NPV is not always a definitive no; strategic considerations such as market entry, regulatory compliance, or option value may justify proceeding anyway, but those reasons should be weighed deliberately and separately from the financial calculation.
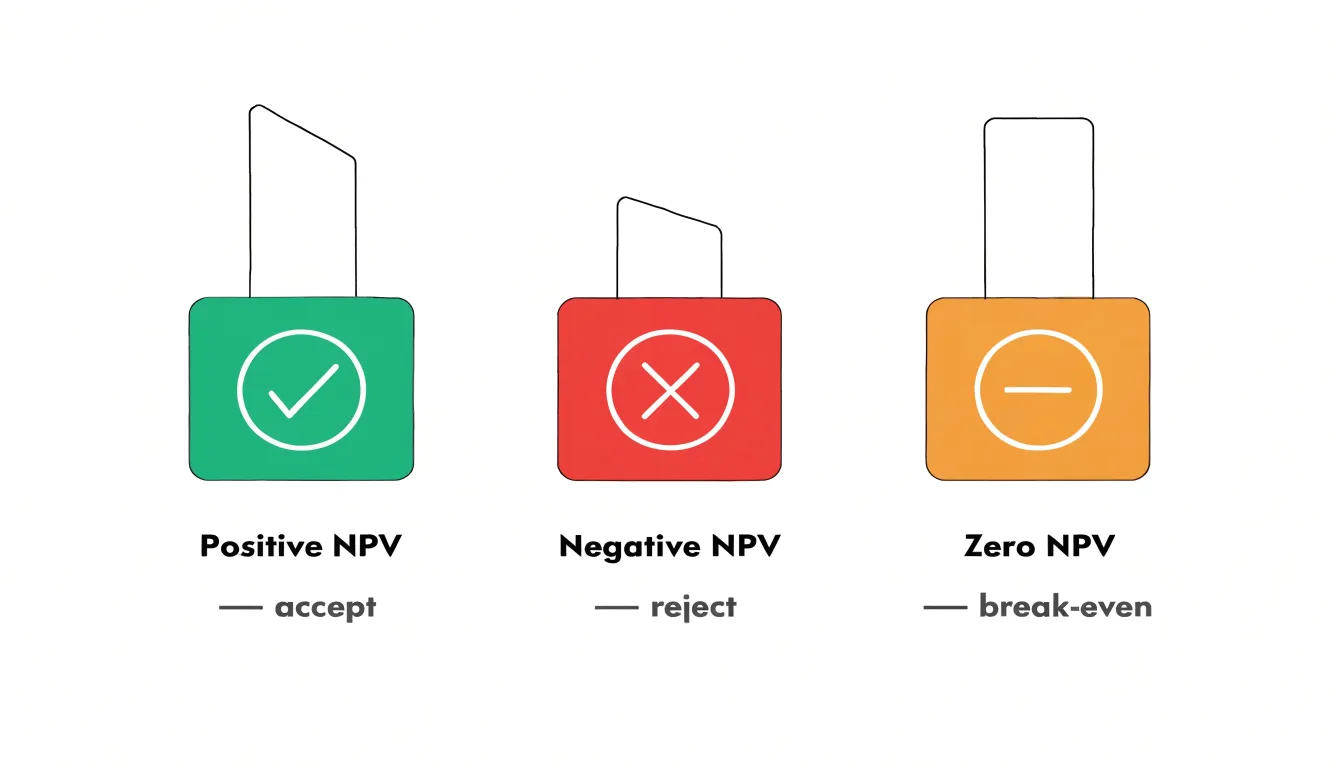
An NPV of exactly zero represents the break-even point. The project earns precisely your required rate of return, no more and no less. It neither adds nor subtracts value under the assumptions used, so the decision often hinges on qualitative factors or on whether the discount rate already reflects an adequate hurdle.
When comparing several mutually exclusive alternatives, the interpretation shifts from sign to magnitude. The option with the highest positive NPV is generally the preferred choice, because it creates the most value in absolute dollar terms. Ranking by NPV helps you allocate limited capital toward the investments that contribute most. Revisit the underlying assumptions whenever results are close, since small changes in cash flow estimates or the discount rate can flip the ranking.
Frequently Asked Questions
What does a positive NPV mean?
A positive NPV means the projected cash flows, discounted back to today’s dollars, exceed the initial investment by that margin. For a standalone decision, a positive result supports acceptance because the project is expected to create value above the return required by your discount rate.
What are the four inputs in the NPV formula?
The four inputs are the initial investment, typically written as C₀ and entered as a negative number at time zero; periodic cash flows, labeled CF₁ through CFₙ; the discount rate, usually denoted r; and the time periods, represented by t or n. Together they produce NPV by summing discounted future cash flows and subtracting the initial investment.
Why is a dollar received later worth less than a dollar today?
The time value of money rests on the fact that money received today can be put to work immediately and has earning potential, while money promised for tomorrow cannot. Delay carries an opportunity cost, and inflation reduces purchasing power over time, so future cash flows are discounted to translate them into today’s terms.
How do you choose the right discount rate for NPV?
A common starting point is the cost of capital: for a company, usually the weighted average cost of capital, and for an individual investor, the return available on comparable investments. Riskier or less certain projects often warrant a higher rate through a risk premium, and the choice matters because discounting compounds over time.
How do you calculate NPV in Excel or Google Sheets?
Build a clean timeline with periods in one column and cash flows in another, entering outflows as negative numbers and inflows as positive numbers. Keep the initial investment separate because the NPV function discounts every value in the range as if it arrives at the end of a period; for example, with the upfront cost in B1, future cash flows in B2:B6, and the rate in E1, use =B1+NPV(E1,B2:B6).
What does a negative NPV mean for an investment decision?
A negative NPV means the discounted benefits fall short of the cost, so the project is expected to destroy value relative to the return your capital could earn elsewhere. For an accept-or-reject decision, a negative result typically leads to rejection, but it is not always a definitive no because strategic considerations such as market entry, regulatory compliance, or option value may justify proceeding anyway and should be weighed separately.