
How to Calculate ROI (With Formula and Examples)
ROI is calculated as (Net Profit ÷ Total Investment) × 100, where net profit equals total gain minus total cost. For example, a $10,000 project returning $13,000 yields $3,000 net profit and a 30% ROI. The result expresses profit as a percentage of invested capital, letting you compare investments of different sizes on equal footing.
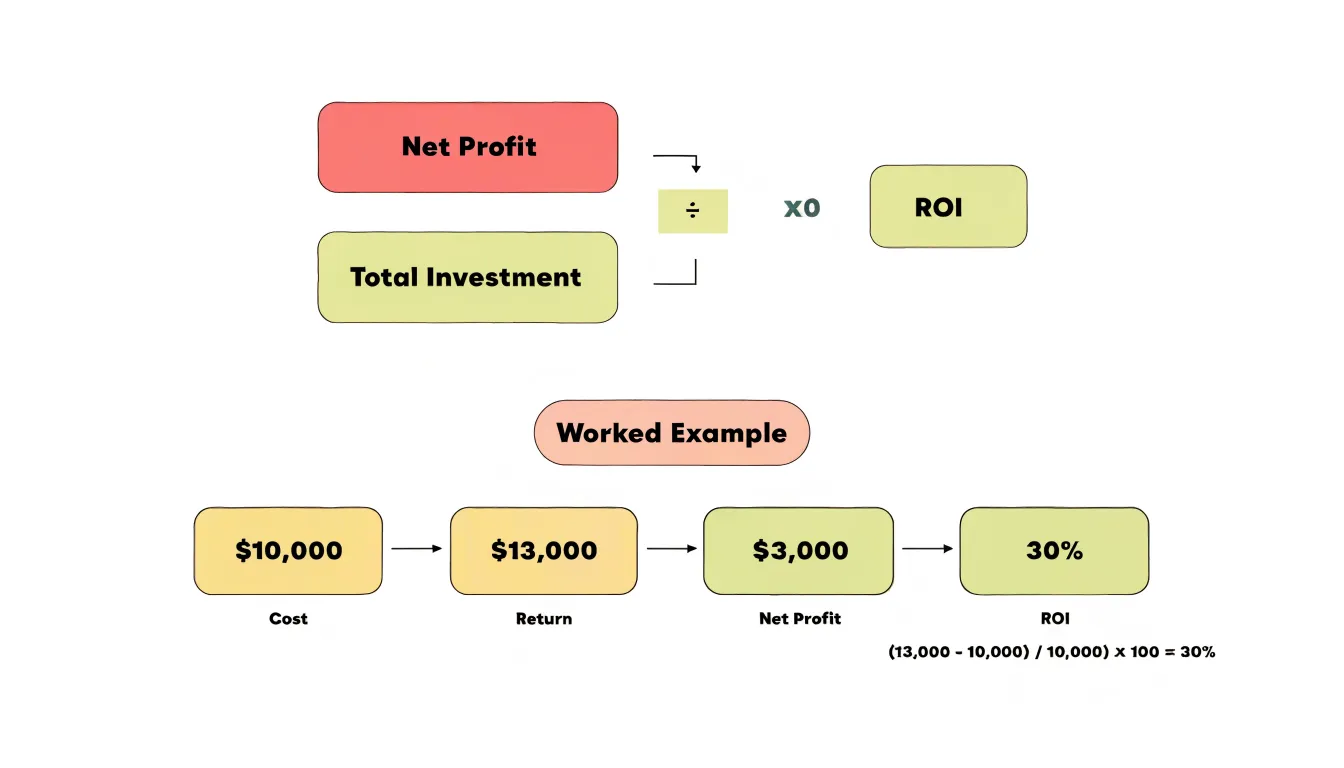
Table of Contents
- What return on investment actually measures
- The basic return on investment formula explained
- Calculating ROI
- How to calculate returns on a stock investment
- Measuring returns on home improvements and real estate
- Accounting for hidden fees taxes and maintenance costs
- Why does the length of time change your real return
- Annualized ROI
- Common mistakes that distort your calculation results
What return on investment actually measures
Return on investment measures how much profit an investment generates relative to the money committed to it. The standard definition expresses ROI as a ratio of net profit to total cost. To calculate it, you take the gain from the investment, subtract the total cost of making that investment, and divide the result by the total cost. The output is usually written as a percentage. For example, if a project costs $10,000 and produces $13,000 in returns, the net profit is $3,000, and the ROI is 30 percent. This simple ratio gives managers, investors, and analysts a common language for comparing widely different undertakings, from a marketing campaign to new equipment to a stock purchase.
What the ratio reveals is efficiency. ROI answers a straightforward question: for every dollar spent, how many dollars of profit came back? A higher ROI indicates that capital was converted into profit more effectively, which makes it easier to rank competing opportunities and to judge whether a given outlay cleared a minimum threshold. Because the formula normalizes results into a percentage, a small project and a large one can be placed side by side on a like-for-like basis, and decisions can be grounded in measured outcomes rather than intuition.
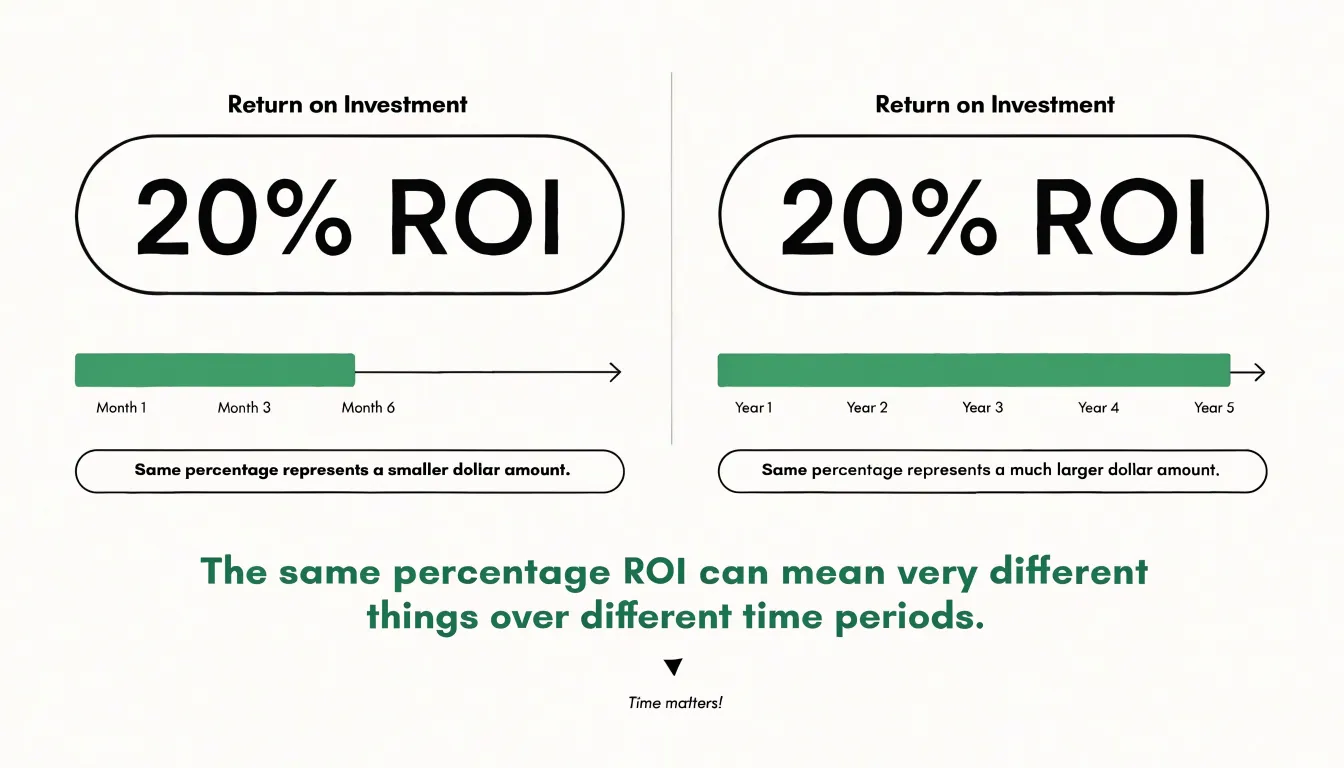
The measure has clear boundaries, though. ROI captures a single snapshot of profit against cost, and it treats all dollars as equal regardless of when they arrive. A 20 percent return earned over six months is very different from the same 20 percent earned over five years, yet the basic formula reports both identically. It also says nothing about risk. Two investments with the same ROI can carry vastly different chances of loss, and the calculation will not distinguish between a safe, predictable payoff and a speculative one. Beyond that, ROI typically ignores intangible benefits, the cost of capital, and the effects of inflation or taxes. These omissions make ROI a useful starting point for evaluation rather than a complete picture, and sound analysis usually pairs it with time-sensitive and risk-aware measures.
The basic return on investment formula explained
The standard return on investment formula expresses an investment’s profitability as a percentage: ROI = (Net Profit / Total Investment) × 100. Each part of this formula plays a specific role, and understanding them individually makes the calculation straightforward to apply across many situations.
Net Profit is the first component. It refers to the financial gain produced by the investment after all associated costs have been subtracted from the revenue or benefit it generated. To find net profit, take the total amount the investment brought in and subtract the total amount spent on it. Net profit can be positive, meaning the investment earned more than it cost, or negative, meaning it lost money. Using net profit rather than gross revenue ensures the final percentage reflects the true financial outcome.
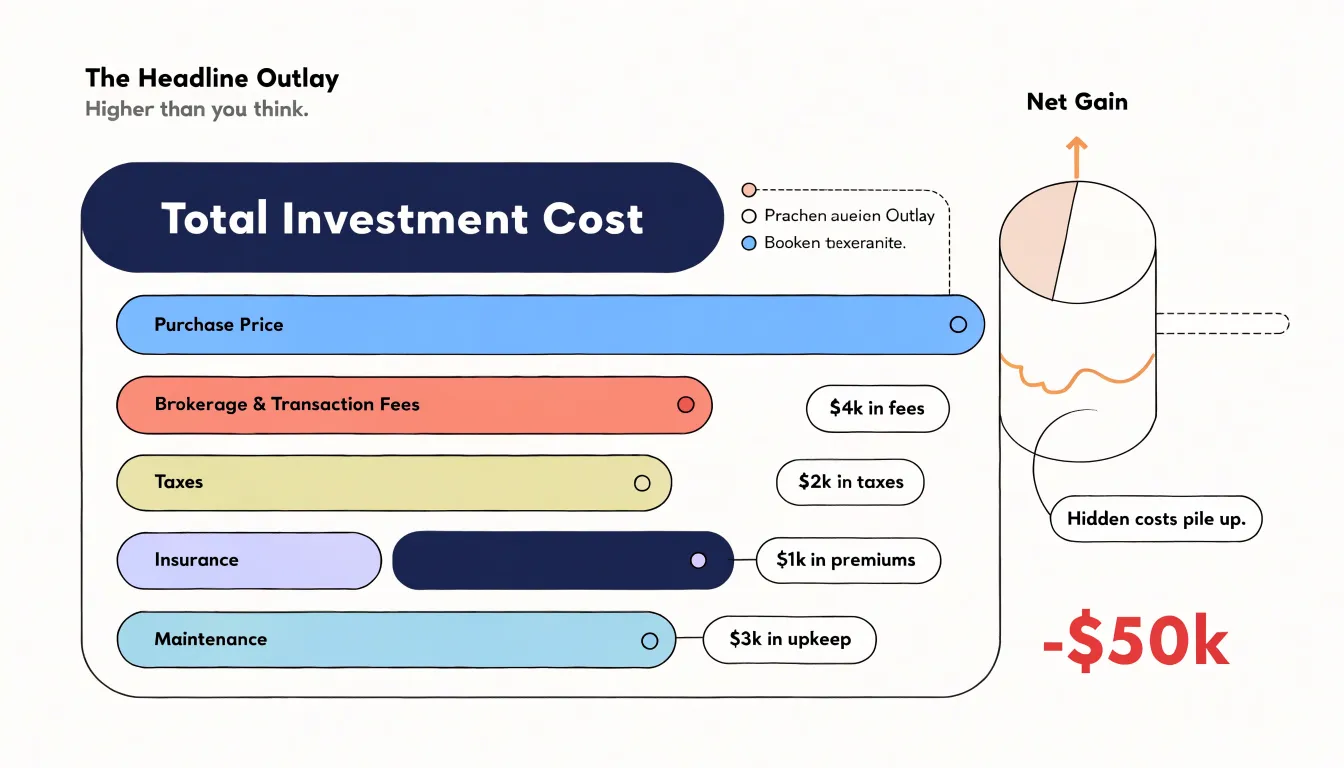
Total Investment is the second component. It represents the full amount of money committed to the investment, including the initial outlay plus any additional costs required to acquire, maintain, or exit it. Being thorough about what counts as investment cost produces a more accurate figure. Common inclusions are the purchase price, transaction fees, and any ongoing expenses directly tied to the investment.
Multiplying by 100 converts the resulting ratio into a percentage, which is the conventional way ROI is communicated. Without this step, the result is a decimal that is harder to interpret at a glance.
A simple example illustrates the calculation. Suppose a small business spends $5,000 on a marketing campaign and the campaign generates $8,000 in additional revenue. The net profit is $8,000 minus $5,000, which equals $3,000. Dividing $3,000 by the $5,000 total investment gives 0.6. Multiplying by 100 produces an ROI of 60 percent. This means that for every dollar invested in the campaign, the business earned 60 cents in profit beyond recovering its costs.
The same formula scales from small personal purchases to large corporate projects, which accounts for its widespread use. Applying it consistently, with careful attention to what counts as net profit and total investment, gives decision-makers a clear and comparable measure of how well their money has performed.
Calculating ROI
Calculating ROI begins with a clear definition of the investment you are evaluating. Start by identifying the total gains the investment produces. Gains include any revenue, savings, or value generated over a defined period. For a practical scenario, imagine a small business that spends $5,000 on a social media advertising campaign. Over three months, the campaign generates $12,000 in tracked sales. The gain in this case is the $12,000 in additional revenue.
Next, identify all costs associated with the investment. Costs go beyond the initial outlay and can include labor, tools, maintenance, and any ongoing expenses tied to the project. In the advertising example, the $5,000 campaign fee is the primary cost, though the business might also include $1,000 in staff time spent managing the campaign, bringing total costs to $6,000.
With gains and costs established, apply the standard ROI formula: ROI equals (Gain minus Cost) divided by Cost, multiplied by 100 to express the result as a percentage. Using the scenario, subtract $6,000 from $12,000 to get a net gain of $6,000. Divide that $6,000 by the $6,000 cost to get 1.0, then multiply by 100 for an ROI of 100 percent. This means the campaign returned a net profit equal to its total cost.
Interpreting the final percentage requires context. A positive ROI indicates the investment returned more than it cost, while a negative ROI signals a loss. The 100 percent figure shows the campaign doubled the money invested, which is a strong result for a short-term marketing effort. Compare this percentage against the business’s typical benchmarks, alternative investments, and the time frame involved. A 100 percent return over three months differs meaningfully from the same return over three years.
Finally, document your assumptions about which gains and costs were included, since ROI figures shift depending on scope. Consistent, transparent calculations allow you to compare investments fairly and make better resource decisions over time.
How to calculate returns on a stock investment
Calculating ROI on a stock investment begins with the same fundamental formula used across finance: ROI equals net profit divided by the total cost of the investment, expressed as a percentage. What makes stocks distinct is the need to account for two separate sources of return, dividends and capital gains, along with all the costs incurred to acquire and hold the position. Net profit therefore includes any increase in the share price, any dividends received during the holding period, minus the purchase price and any brokerage fees, commissions, or transaction charges paid on both the buy and sell sides. The total investment cost includes the original purchase price plus those buying fees.
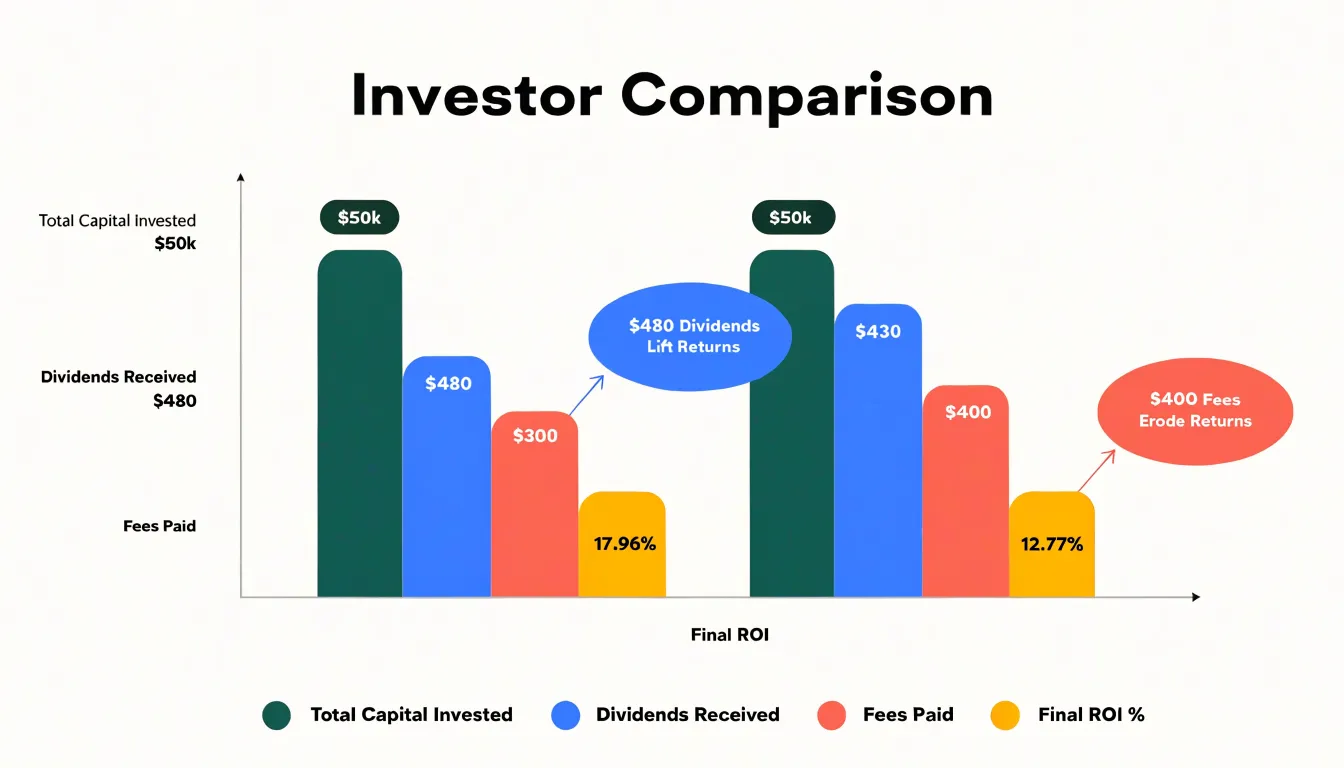
Consider two investors comparing results. Investor A buys 100 shares at $50 each, paying a $10 brokerage fee, for a total outlay of $5,010. After one year the shares are worth $58, and the company paid $1.20 per share in dividends, or $120 in total. Selling incurs a $10 fee. The net profit is the sale proceeds of $5,800 minus the selling fee, plus $120 in dividends, minus the $5,010 total cost, which equals $900. Dividing $900 by $5,010 gives an ROI of roughly 17.96%.
Investor B buys 200 shares at $25, paying the same $10 fee, for a total cost of $5,010. After a year the shares trade at $28, and dividends total $0.30 per share, or $60. With a $10 selling fee, proceeds are $5,600, and net profit comes to $5,600 minus $10 plus $60 minus $5,010, which equals $640. The ROI is about 12.77%. Both investors committed the same capital, yet Investor A achieved a higher return because of stronger price appreciation and a larger dividend yield. The comparison shows how dividends can materially lift total return and how seemingly small fees slightly erode the percentage, which matters more on larger positions or frequent trading. Running this calculation for each holding lets an investor rank performance on a like-for-like basis and see which positions are genuinely earning their keep.
Measuring returns on home improvements and real estate
Measuring returns on home improvements and real estate investments requires a systematic approach that accounts for both upfront costs and ongoing financial benefits. For home renovations, the ROI calculation begins by determining the total cost of the project, including materials, labor, permits, and any incidental expenses. Next, you need to estimate the increase in the property’s value attributable to the renovation. This can be done through professional appraisals before and after the work, or by comparing the sale prices of similar renovated homes in the area. The ROI is then calculated as the net gain from the renovation (increased value minus renovation cost) divided by the renovation cost, expressed as a percentage. For example, if a kitchen remodel costs $25,000 and increases the home’s value by $30,000, the ROI is ($30,000 - $25,000) / $25,000 = 20%. It’s important to note that not all renovations yield a positive ROI; projects like minor bathroom updates or landscaping often recoup a higher percentage of their cost than high-end additions.
For rental properties, ROI calculation incorporates rental income and operating expenses. Start by summing all acquisition costs: purchase price, closing fees, and any immediate repairs. Then, calculate the annual net operating income (NOI) by subtracting operating expenses—such as property taxes, insurance, maintenance, property management fees, and vacancies—from the gross rental income. The ROI can be expressed as the NOI divided by the total investment. Alternatively, you can calculate the cash-on-cash return, which divides the annual net cash flow by the total cash invested (down payment plus closing costs). For instance, if you invest $50,000 in cash and receive $5,000 in annual net cash flow, the cash-on-cash return is 10%. Real estate investors also consider appreciation and tax benefits, but these should be analyzed separately to maintain clarity. By consistently applying these formulas, you can compare different investment opportunities and make informed decisions about renovations and property acquisitions.
Accounting for hidden fees taxes and maintenance costs
A reliable ROI calculation depends on capturing every cost tied to an investment, and the costs most often missed are the quiet ones: transaction fees, taxes, insurance, and ongoing maintenance. These expenses rarely appear on the initial price tag, yet each one reduces the net gain that ROI is meant to measure. When they are left out, the formula compares a gross return against the investment and produces a figure that looks stronger than the reality of the investor’s position.
Transaction fees appear at multiple stages of ownership. Purchasing an asset may involve brokerage commissions, closing costs, title fees, or platform charges. Selling it can trigger another round of commissions and transfer fees. Each of these amounts reduces the proceeds and should be added to the total cost base. Taxes work the same way. Property taxes, sales taxes on purchases, and capital gains taxes on profits all take a share of the return. A common mistake is to calculate ROI before taxes on a profitable sale, which inflates the headline number by the full amount owed to the tax authority.
Insurance and upkeep add a recurring layer of expense that accumulates over the holding period. An investor who owns a rental property pays for property insurance, repairs, and routine maintenance throughout the years of ownership. A business owner pays for equipment servicing and replacement parts. These costs may be small in any single month, but over several years they can subtract a substantial portion of the final gain. Failing to total them overstates annualized returns and can make a mediocre investment appear attractive.
For accuracy, list every cost before running the numbers: acquisition fees, selling fees, taxes, insurance premiums, and maintenance across the full holding period. Subtract that total along with the initial investment from the final value, then divide by the total cost. This approach keeps the ROI grounded in what the investment actually returned after all obligations were met.
Why does the length of time change your real return
The length of time an investment is held changes the picture of what you actually earn, which is why any ROI figure should be read alongside the timeframe that produced it. A simple ROI compares total gain to total cost, so a $1,000 investment that grows to $1,500 over five years shows a 50% return, and the same 50% appears whether the money sat for one year or twenty. That single number hides how efficiently the capital worked, because earning 50% over twenty years is a very different outcome from earning it in one.
Annualized returns solve this by converting total performance into an average per-year rate, which lets you compare investments held for different periods on equal footing. The annualized figure is lower than the simple figure whenever the holding period is longer than a year, since the same total gain is spread across more time. Compounding adds another layer: each year’s returns can generate their own returns in later years, so growth accelerates the longer the money stays invested. An investment earning 7% annually roughly doubles in about ten years, and the gap between simple and compounded results widens with every additional year.
Inflation erodes purchasing power over time, so the nominal ROI you calculate on paper overstates what the money can actually buy. If an investment gains 6% a year while prices rise 3%, the real return is closer to 3%, and a long horizon magnifies that difference because inflation compounds just as investment gains do. Over a decade, a modest inflation rate can consume a substantial share of apparent growth.
Putting these together, the time horizon influences three things at once: whether simple and annualized figures diverge, how much compounding works in your favor, and how much inflation quietly subtracts. A short holding period keeps these effects small; a long one makes them central to evaluating whether the investment met your goals.
Annualized ROI
Annualized ROI converts total return into an average yearly rate, making it possible to compare investments held for different lengths of time. The formula is: Annualized ROI = [(1 + Total ROI)^(1 / Number of Years)] - 1, where Total ROI is expressed as a decimal. For example, a total ROI of 50% over five years becomes (1.50)^(1/5) - 1 = 0.0845, or 8.45% per year. This calculation assumes compounding, meaning each year’s return is reinvested to generate additional returns.
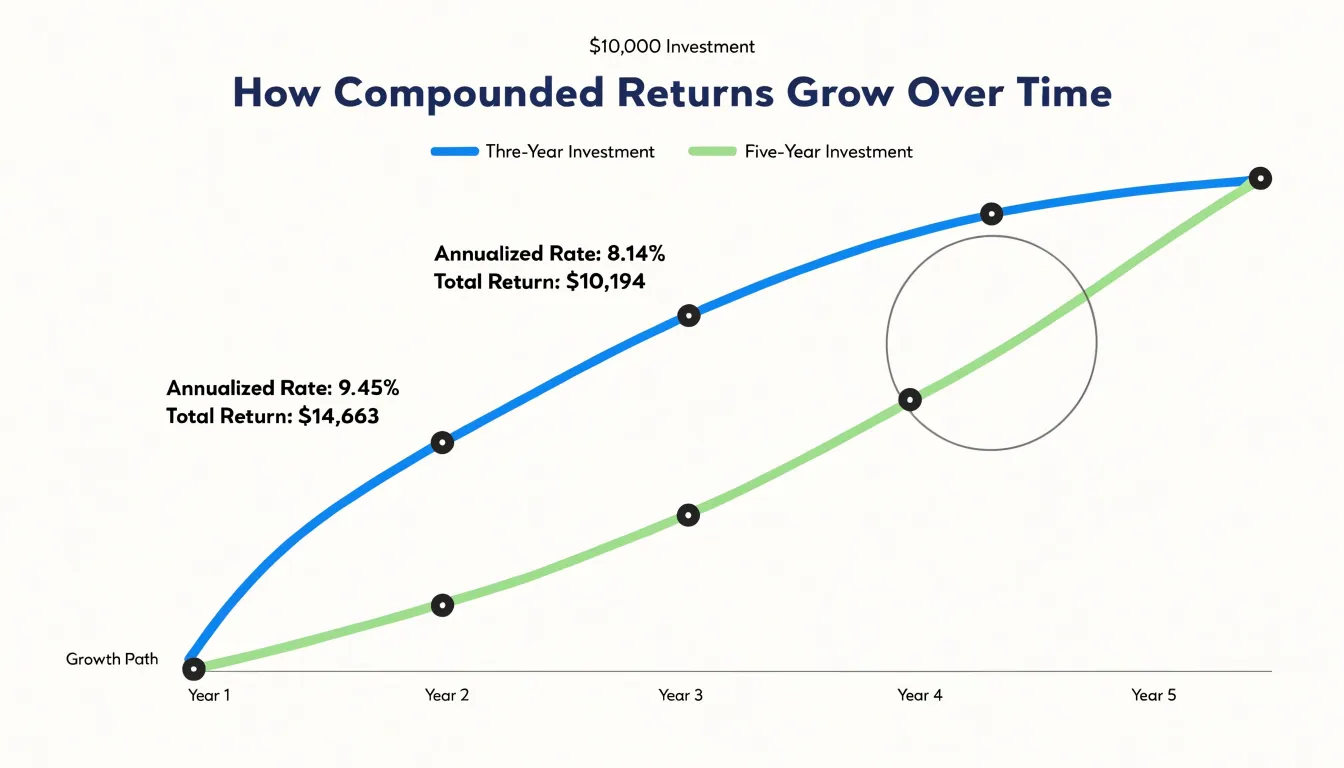
Comparing investments of different durations requires a common basis, and annualized ROI provides that basis. A three-year investment with a total ROI of 30% has an annualized ROI of (1.30)^(1/3) - 1 = 9.14%. A five-year investment with a total ROI of 50% has an annualized ROI of 8.45%. Even though the five-year investment produced a higher total return, the three-year investment performed better on an annualized basis. This insight helps investors allocate capital more effectively.
To calculate annualized ROI step by step, follow this example. Suppose you invest $10,000 in a project that returns $15,000 after four years. Step 1: Calculate total ROI as (Final Value - Initial Investment) / Initial Investment = ($15,000 - $10,000) / $10,000 = 0.50, or 50%. Step 2: Convert total ROI to a decimal: 1 + 0.50 = 1.50. Step 3: Divide 1 by the number of years: 1 / 4 = 0.25. Step 4: Raise 1.50 to the power of 0.25: 1.50^0.25 ≈ 1.1067. Step 5: Subtract 1: 1.1067 - 1 = 0.1067, or 10.67% annualized ROI. This means the investment grew at an average compound rate of 10.67% per year.
Annualized ROI is useful for comparing investments with different holding periods, but it relies on the assumption of steady compounding. Actual returns may vary year to year, and the metric does not account for risk, taxes, or fees. Use it as a starting point for analysis, and consider other factors for a complete picture.
Common mistakes that distort your calculation results
Accurate ROI calculations depend on disciplined record-keeping, yet several frequent mistakes quietly distort the final figure. One of the most common is ignoring costs. People often tally the obvious outlay, such as the purchase price of equipment or the cost of an ad campaign, while leaving out peripheral expenses like installation fees, maintenance contracts, training hours, shipping charges, or the staff time spent managing a project. Each omitted cost inflates the return and makes a modest investment look far stronger than it is. A useful tip is to list every expense category before running the numbers, then review bank statements and invoices to confirm nothing was missed.
A second frequent error involves using inconsistent time periods. ROI compares a gain against a cost, and both figures must cover the same window. Mixing a twelve-month revenue figure with a three-month cost basis, or annualizing one input while leaving the other as a monthly total, produces a meaningless ratio. The fix is straightforward: define the measurement period in advance, convert every input to that same timeframe, and document the assumption so the calculation can be checked or repeated later. When comparing investments, apply identical periods across all of them so the results remain comparable.
Confusing ROI with profit is another source of distorted results. Profit is an absolute amount, the money left after expenses, while ROI expresses that gain as a percentage of what was invested. A project earning $5,000 in profit could represent a 50% return on a $10,000 investment or a 5% return on $100,000. Reporting the dollar figure as though it were the ROI overstates performance and obscures how efficiently capital was used. Keeping profit and ROI clearly labeled in reports helps teams interpret results correctly.
Smaller habits also matter. Rounding early in a calculation compounds errors, so carry full figures until the final step. Forgetting to subtract the original investment from the total return inflates the gain, and neglecting non-financial benefits or risks can skew decisions. Reviewing each calculation against a simple checklist, ideally with a second set of eyes, keeps the numbers trustworthy.
Frequently Asked Questions
What is ROI and how is it calculated?
ROI measures how much profit an investment generates relative to the money committed to it. The standard formula is ROI = (Net Profit / Total Investment) × 100, where net profit is the gain from the investment minus its total cost.
How do you calculate ROI on a stock investment?
For stocks, net profit includes any increase in share price and any dividends received, minus the purchase price and any brokerage fees, commissions, or transaction charges. The total investment cost includes the original purchase price plus buying fees, and ROI is net profit divided by total cost, expressed as a percentage.
How is ROI calculated for a rental property?
Start by summing acquisition costs such as purchase price, closing fees, and immediate repairs, then calculate annual net operating income by subtracting operating expenses from gross rental income. ROI can be expressed as net operating income divided by total investment, or you can calculate cash-on-cash return by dividing annual net cash flow by total cash invested.
Why do hidden fees, taxes, and maintenance matter in ROI?
Transaction fees, taxes, insurance, and ongoing maintenance reduce the net gain that ROI is meant to measure, and leaving them out makes the return look stronger than it really is. For accuracy, list acquisition fees, selling fees, taxes, insurance premiums, and maintenance across the full holding period and subtract that total along with the initial investment from the final value.
Why does the length of time change your real return?
A simple ROI can look the same whether a gain was earned over one year or twenty, so annualized returns are used to compare investments held for different periods on equal footing. Compounding can accelerate growth over time, while inflation erodes purchasing power and can make the nominal ROI overstate what the money can actually buy.
What is annualized ROI and how is it calculated?
Annualized ROI converts total return into an average yearly rate using the formula Annualized ROI = [(1 + Total ROI)^(1 / Number of Years)] - 1. For example, a total ROI of 50% over five years becomes about 8.45% per year, and the calculation assumes compounding but does not account for risk, taxes, or fees.