
How to Calculate Your Break-Even Point
The break-even point is the sales volume at which total revenue equals total costs, leaving neither profit nor loss. Calculate it in units by dividing total fixed costs by the contribution margin per unit (selling price minus variable cost per unit). Calculate break-even revenue by dividing fixed costs by the contribution margin ratio.
Table of Contents
- Understanding what a break even point actually tells you about your business
- Gathering your fixed costs variable costs and unit sales price
- How to separate fixed overhead from variable production expenses
- Calculating break even units for physical products step by step
- Break even in revenue
- Adjusting your math for subscription services and recurring revenue
- What should you do if your break even volume is unrealistically high
- Key limitations of break even analysis and when to update your model
Understanding what a break even point actually tells you about your business
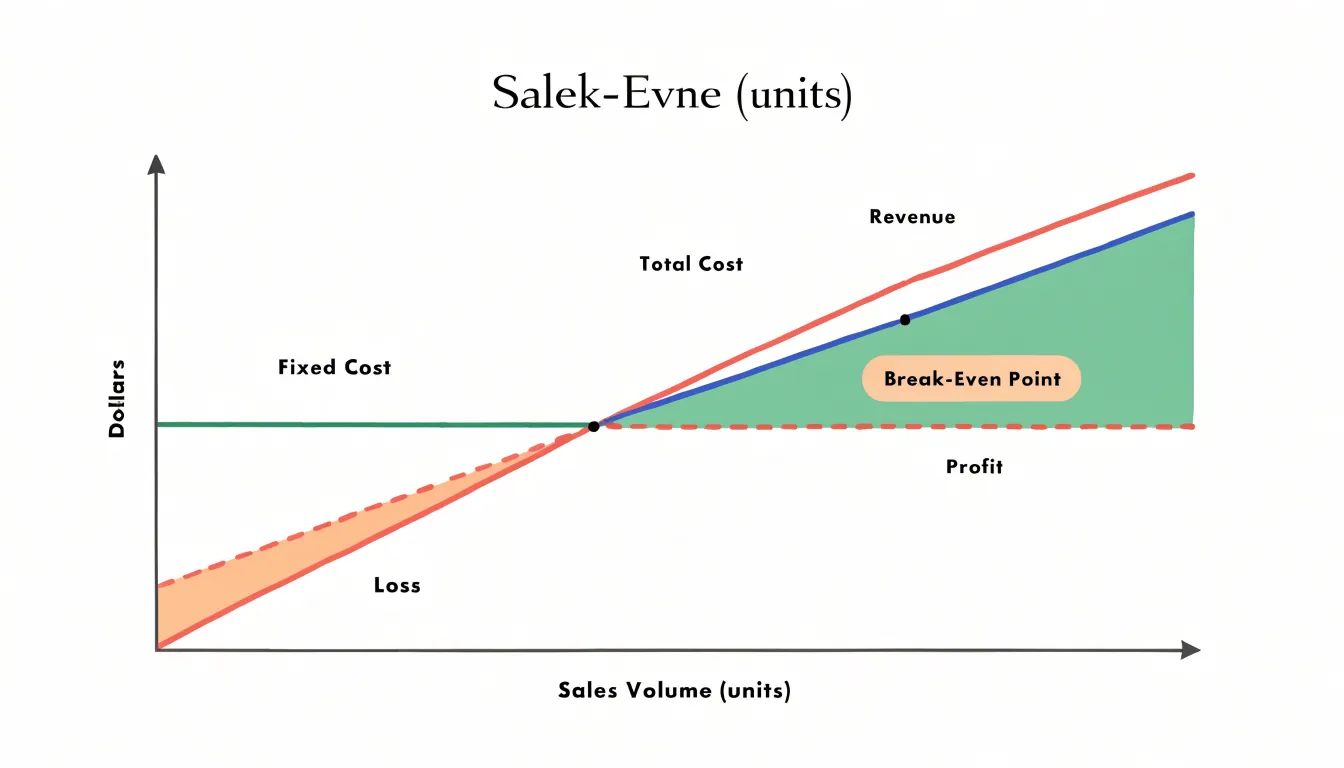
The break-even point is the sales volume at which total revenue equals total costs, leaving neither profit nor loss. That single number carries a surprising amount of information about how your business operates. At its most basic level, the break-even point tells you the minimum volume of sales your business must achieve simply to stay alive. Every unit sold below that threshold represents a loss; every unit above it begins to generate profit. Framed this way, the break-even figure becomes a survival line rather than an abstract accounting artifact, giving you a concrete daily, weekly, or monthly target to aim for and a clear way to judge whether current sales activity is sufficient.
The number also reveals something important about the structure of your costs. A business with a high break-even point relative to its capacity is carrying substantial fixed costs, such as rent, salaries, or equipment leases, that must be covered before any profit appears. That configuration creates risk: when sales dip, losses accumulate quickly because the fixed obligations remain. A lower break-even point signals a more flexible cost structure, often weighted toward variable costs that shrink when volume falls. Watching how the break-even point shifts as you add staff, sign a lease, or take on debt gives you an early warning system for how much financial cushion the business really has.
The break-even point also frames pricing decisions in practical terms. Price changes move the break-even line: raising prices lowers the volume needed to break even, while discounting pushes it higher. Seeing this relationship numerically helps you evaluate whether a price cut will realistically be offset by extra volume. In the same way, the break-even calculation grounds growth planning, since it shows how much additional sales a new hire, location, or marketing campaign must generate before it pays for itself. Used consistently, the break-even point becomes a reference marker that connects costs, prices, and sales targets into one coherent picture of what the business needs to do to remain viable and profitable.
Gathering your fixed costs variable costs and unit sales price
To calculate a break-even point, you need three categories of input: fixed costs, variable costs, and the unit sales price. Begin with fixed costs, which are the expenses that stay constant regardless of how many units you sell. Typical examples include rent or lease payments, insurance premiums, salaried staff, software subscriptions, loan repayments, and depreciation. Most of these appear in your accounting system as recurring monthly or annual entries. Pull a recent profit and loss statement and scan the operating expense section for line items that do not fluctuate with volume. Many accounting platforms let you tag or group these accounts, which makes it easy to total them in one place.

Variable costs are the expenses that rise and fall directly with each unit produced or sold. These include raw materials, packaging, shipping, transaction fees, sales commissions, and hourly labor tied to output. The most reliable source is your cost of goods sold account, supplemented by purchase records and supplier invoices. Divide the total variable cost for a period by the number of units sold in that same period to arrive at a per-unit figure, which is what the break-even formula requires.
The unit sales price is the third input. This is the average price at which you sell a single unit, net of discounts and returns. If you offer multiple products at different prices, calculate a weighted average based on sales mix, or run a separate break-even analysis for each major product line. Your sales reports and invoicing records are the best source for this figure.
Accuracy and currency matter as much as the data itself. Fixed costs shift when leases renew or headcount changes, and variable costs move with supplier price changes. Set a schedule to review these inputs quarterly, or whenever a significant cost change occurs. Reconcile your figures against your bank statements and accounting records to catch anything missed or double-counted. Keeping a simple, dated spreadsheet of the three inputs ensures your break-even calculation reflects current reality rather than stale assumptions.
How to separate fixed overhead from variable production expenses
Separating fixed overhead from variable production expenses begins with a working definition for each category. Fixed costs stay constant in total regardless of how much you produce within a relevant range: rent, insurance, salaried management, depreciation on equipment, software subscriptions. Variable costs rise and fall in direct proportion to output: raw materials, packaging, piece-rate labor, and the energy consumed by production machinery. The practical difficulty lies in applying these definitions to real expense lines, so several tests help.
An effective starting test is the activity question: if output dropped to zero for a month, which costs would disappear entirely? Those are variable. The next test is behavioral over time. Pull twelve months of expense data and compare each cost against production volume. A cost whose total tracks volume proportionally belongs on the variable side; one that stays flat through slow and busy months is fixed. Unit-level examination adds a third check: if cost per unit stays stable as volume changes, the expense is variable; if cost per unit falls as volume rises, you are looking at a fixed cost being spread thinner. Finally, contractual review confirms intent, since supplier agreements and lease terms reveal whether a payment is tied to usage or to time.
Misclassification is common with semi-variable expenses, which carry a fixed base plus a usage-driven component. A utility bill with a standing charge, a delivery driver on salary plus per-mile pay, and phone plans with data overages all fit this pattern. Treating them as purely fixed understates costs at high volume, and treating them as purely variable overstates costs at low volume. The standard fix is to isolate the fixed base and assign the remaining per-unit portion to variable costs, using a high-low method or regression on historical bills. Step costs, such as adding a second shift supervisor once volume crosses a threshold, create similar traps and should be reviewed as volume bands rather than a single line.
Getting the split right matters because the break-even calculation depends entirely on it. The contribution margin per unit is revenue minus variable cost; the fixed cost total is the numerator it must cover. Overstate fixed costs and you will believe break-even sits further out than it does, leading to unnecessary price increases or delayed expansion. Overstate variable costs and the contribution margin shrinks, making viable products look unprofitable. An accurate split also sharpens pricing decisions, capacity planning, and the operating leverage picture, showing how sensitive profit is to sales volume.
Calculating break even units for physical products step by step
To calculate your break-even point in units for a physical product, you need two key figures: your fixed costs and your contribution margin per unit. Fixed costs are expenses that do not change with production volume, such as rent, salaries, insurance, and equipment depreciation. The contribution margin per unit is the selling price minus the variable cost per unit—the amount each sale contributes toward covering fixed costs.
Let’s walk through a worked example. Suppose you run a small business making handmade candles. Your fixed costs total $10,000 per month, covering rent, utilities, and a part-time employee. Each candle sells for $20. The variable costs per candle—wax, wick, fragrance, and packaging—come to $8. Your contribution margin per unit is therefore $20 − $8 = $12. This means every candle sold contributes $12 toward paying off the $10,000 in fixed costs.
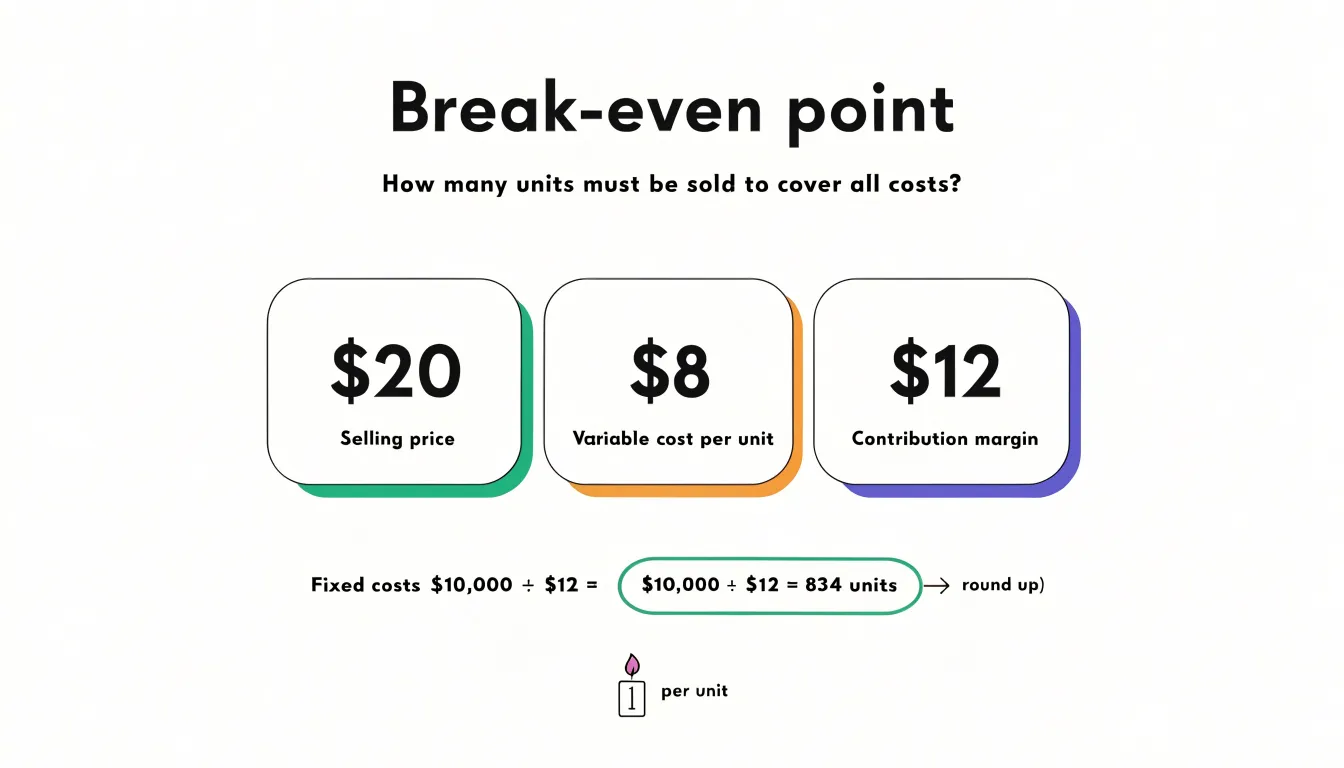
To find the break-even point in units, divide total fixed costs by the contribution margin per unit: $10,000 ÷ $12 = 833.33. Since you can’t sell a fraction of a candle, you round up to 834 units. Selling 834 candles will cover all fixed and variable costs, resulting in zero profit. At 835 units, you begin to generate profit.
This calculation gives you a clear target: you must sell at least 834 candles each month to avoid a loss. You can also express the break-even point in sales dollars by multiplying the unit break-even by the selling price: 834 × $20 = $16,680 in monthly revenue.
Understanding your break-even unit threshold helps with pricing decisions, cost control, and sales planning. For instance, if you negotiate a lower variable cost of $7 per candle, your contribution margin rises to $13, and the break-even point drops to $10,000 ÷ $13 = 769.23, or 770 units. A higher contribution margin means you need fewer sales to cover fixed costs. Regularly revisiting this calculation as costs or prices change keeps your business on solid financial footing.
Break even in revenue
Once you know how many units you need to sell to break even, the next step is expressing that figure in dollars. Revenue-based break-even gives you a single, easy-to-communicate number that tells you the sales your business must generate before it starts earning profit. To convert units into dollars, you use the contribution margin ratio, which is the percentage of each sales dollar that remains after variable costs to cover fixed costs and contribute to profit.
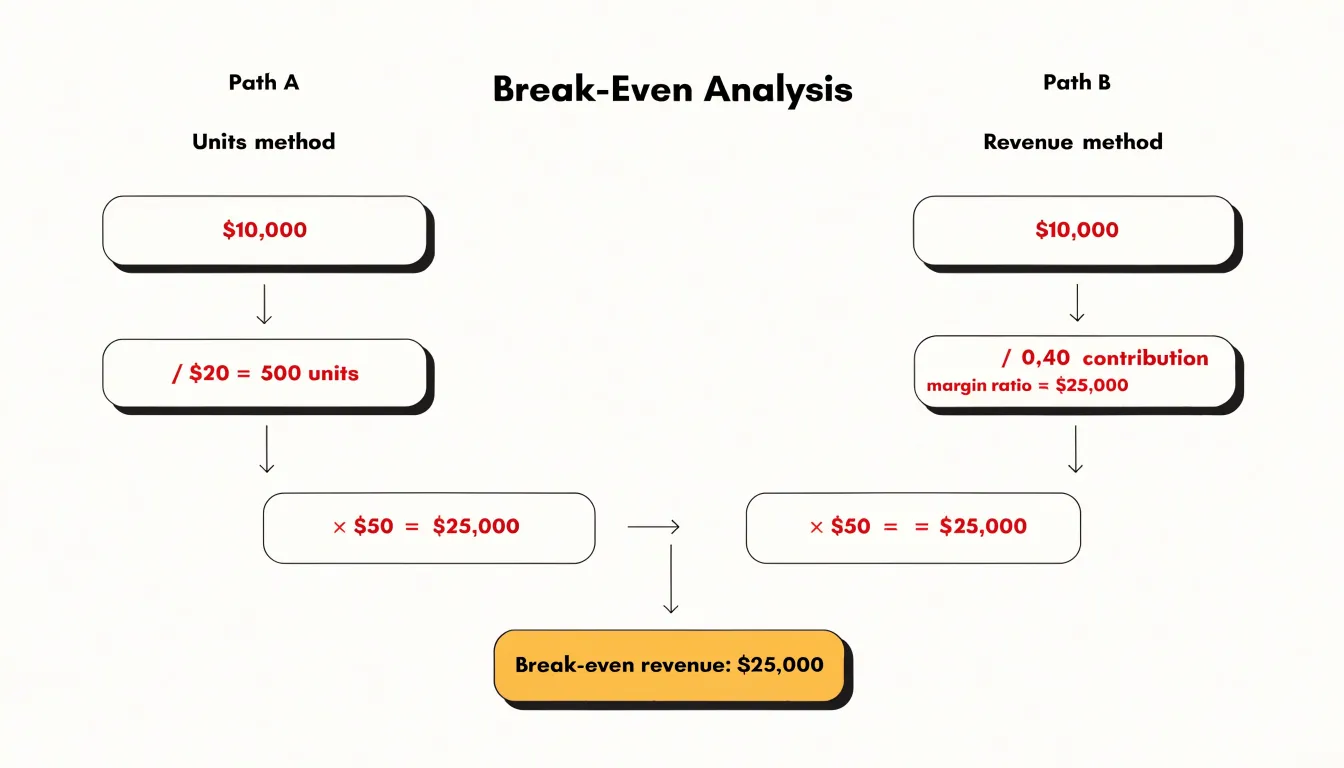
The contribution margin ratio is calculated by subtracting variable costs per unit from the selling price per unit, then dividing that result by the selling price. For example, if a product sells for $50 and has variable costs of $30 per unit, the contribution margin per unit is $20. Dividing $20 by the $50 selling price gives a contribution margin ratio of 0.40, or 40%. This means 40 cents of every sales dollar contributes toward covering fixed costs.
With the ratio in hand, you can translate break-even units into break-even revenue in two equivalent ways. You can multiply the break-even unit count by the selling price, or you can divide total fixed costs by the contribution margin ratio. Suppose the business has $10,000 in fixed costs per month. Dividing $10,000 by 0.40 gives a break-even revenue of $25,000. This matches the unit method exactly: $10,000 divided by the $20 contribution margin per unit equals 500 units, and 500 units times the $50 selling price equals $25,000.
The revenue figure offers practical benefits for planning and communication. It lets you set monthly sales targets in the same currency as your income statement, compare break-even against historical and projected revenue, and discuss goals with partners, lenders, or investors who think in dollars rather than units. Tracking actual revenue against this threshold each period shows quickly whether the business is covering its fixed costs. The contribution margin ratio also stays stable as long as pricing and variable cost structures hold, so updating the break-even revenue figure when fixed costs change is a matter of a single division.
Adjusting your math for subscription services and recurring revenue
Subscription businesses require a different approach to break-even analysis because revenue arrives in recurring increments rather than through one-time transactions. The core idea stays the same: you need enough contribution to cover fixed costs. The mechanics shift once you account for churn, customer lifetime value, and monthly recurring revenue.
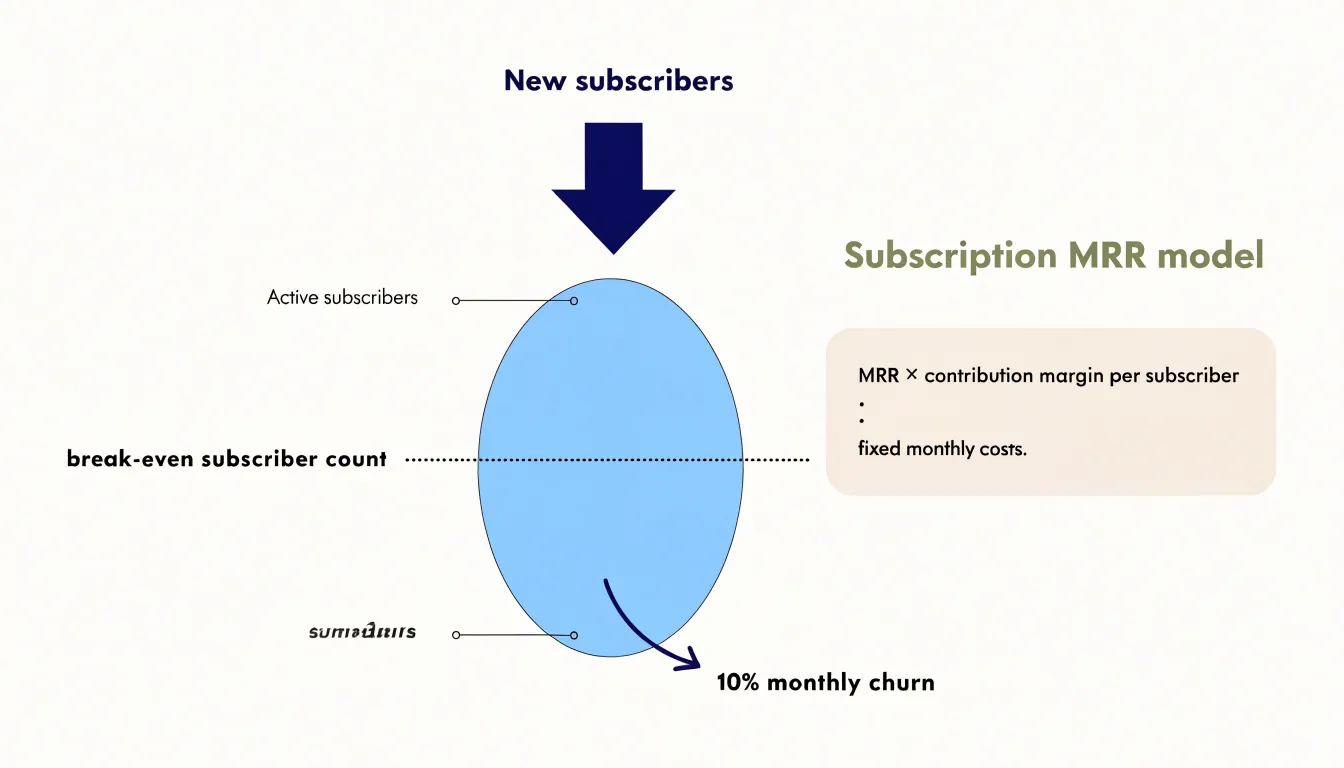
Start with monthly recurring revenue, or MRR, as your revenue unit. Instead of calculating how many units you must sell, you calculate how many active subscribers you need to sustain. Each subscriber contributes a predictable amount each month, so your contribution margin per subscriber equals the subscription price minus variable servicing costs such as payment processing, hosting, and support. Divide your fixed monthly costs by that per-subscriber margin, and you get the number of active subscribers required to break even in a given month.
Churn complicates this picture. If you lose a percentage of subscribers every month, you must replace those losses before your base grows. A ten percent monthly churn rate means one in ten subscribers disappears each month, so acquisition must outpace attrition just to hold steady. A practical break-even calculation therefore factors in replacement demand: the number of new subscribers needed to offset churn plus the number needed to reach your break-even subscriber count. Ignoring churn produces an optimistic figure that rarely holds over time.
Customer lifetime value connects acquisition spending to break-even. If a subscriber stays for an average of twelve months and pays fifty dollars monthly, lifetime value before servicing costs is six hundred dollars. Compare that figure against your customer acquisition cost to see how many months of subscription revenue are required to recover the cost of winning each customer. The break-even point in time terms becomes the month when cumulative revenue from a cohort finally covers the fixed costs and acquisition spend tied to that cohort.
These three measures work together. MRR tells you the size of each revenue increment, churn tells you how much of that revenue you must continuously replace, and lifetime value tells you whether the cost of acquiring subscribers pays back within a reasonable horizon. Run the math monthly and revisit assumptions as retention patterns become clearer.
What should you do if your break even volume is unrealistically high
When the break-even volume a calculation produces looks far beyond what the market or your operational capacity can realistically deliver, treat that number as diagnostic information rather than a verdict. The first step is to isolate which input is driving the threshold upward. In most cases the culprit sits in one of three places: price, variable cost per unit, or fixed costs. Working through each lever systematically shows where the greatest sensitivity lies and which adjustments will move the needle without requiring an unrealistic sales effort.
Pricing deserves early attention because it has an outsized effect on the break-even point. A modest price increase raises contribution margin per unit, which lowers the number of units needed to cover fixed costs. Before changing list prices, examine whether the product is underpriced relative to the value delivered, whether discounts have become routine, and whether there is room for premium tiers or bundling. Even small margin gains compound across every unit sold.
On the cost side, fixed costs are often more flexible than they appear. Lease terms, software subscriptions, salaried headcount, and equipment purchases can frequently be renegotiated, deferred, or shifted toward variable arrangements. Converting fixed obligations into usage-based costs lowers the break-even threshold and reduces risk during the ramp-up period. Variable costs merit similar scrutiny: supplier contracts, shipping, payment processing, and materials often contain negotiable terms that improve per-unit margins without touching price.
If these adjustments still leave an unattainable threshold, the business model itself may need rethinking. That could mean narrowing the customer segment to buyers with higher willingness to pay, shifting from one-time sales to recurring revenue that spreads fixed-cost recovery across a longer relationship, dropping low-margin offerings that inflate volume requirements, or testing a leaner version of the operation before committing to full scale. A break-even figure that only works under heroic assumptions signals a structural mismatch worth addressing early, while the cost of changing course remains low.
Key limitations of break even analysis and when to update your model
Break-even analysis is a useful tool, but its accuracy depends on several simplifying assumptions. One common assumption is that prices remain constant. In reality, prices can fluctuate due to market conditions, promotions, or competitive pressures. If prices change, the break-even point shifts, and the model may no longer reflect reality. Similarly, costs are often assumed to be linear: variable costs per unit stay the same, and fixed costs remain unchanged. However, economies of scale, bulk discounts, or step costs can cause costs to behave non-linearly. For example, producing more units might require additional machinery or overtime, increasing fixed costs at certain thresholds. Another limitation is the single-product assumption. Most businesses offer multiple products with different margins, and the sales mix affects the overall break-even point. A model that assumes a single product may misrepresent the true break-even when the mix changes. These assumptions can break the model when conditions deviate from the expected norms. To maintain accuracy, it’s important to update the break-even model regularly. Triggers for recalculation include significant changes in selling prices, such as a price increase or a new discount strategy; changes in cost structure, like renegotiating supplier contracts or investing in automation; shifts in product mix, such as launching a new product or discontinuing an old one; and changes in market demand or competitive landscape. Additionally, when fixed costs change—due to expansion, new hires, or rent increases—the model should be revisited. By recognizing these limitations and updating the model as conditions change, businesses can use break-even analysis as a dynamic decision-making tool rather than a static one-time calculation. This ongoing refinement helps ensure that the insights derived from the analysis remain relevant and actionable.
Frequently Asked Questions
What does a break-even point tell you about a business?
The break-even point is the sales volume at which total revenue equals total costs, leaving neither profit nor loss. It tells you the minimum sales your business must achieve to stay alive; sales below that threshold are losses, and sales above it begin to generate profit.
What three inputs do you need to calculate a break-even point?
To calculate a break-even point, you need fixed costs, variable costs, and the unit sales price. Fixed costs stay constant regardless of units sold, variable costs rise and fall with each unit, and unit sales price is the average price per unit net of discounts and returns.
How do you separate fixed overhead from variable production expenses?
Use tests such as asking which costs would disappear if output dropped to zero, comparing twelve months of expenses against production volume, and checking whether cost per unit stays stable as volume changes. Fixed costs stay constant in total, variable costs rise and fall with output, and semi-variable costs should have their fixed base isolated with the remaining per-unit portion assigned to variable costs.
How do you calculate the break-even point?
For break-even units, divide total fixed costs by the contribution margin per unit, which is selling price minus variable cost per unit, and round up fractional units. For break-even revenue, multiply the break-even unit count by the selling price, or divide total fixed costs by the contribution margin ratio.
How do you calculate break-even for a subscription business?
Use monthly recurring revenue and divide fixed monthly costs by the contribution margin per subscriber, which is subscription price minus variable servicing costs. Factor in churn by including replacement demand, and compare customer lifetime value against acquisition cost to see when the cost of winning a customer is recovered.
What are the limitations of break-even analysis?
Break-even analysis assumes prices remain constant, costs behave linearly, and often that there is a single product, so it can misstate the threshold when those conditions change. Update the model when selling prices, cost structure, product mix, market demand or competition, or fixed costs change.