
How to Read a Balance Sheet
A balance sheet is a financial statement that snapshots a company’s position on a specific date, listing what it owns (assets), what it owes (liabilities), and the owners’ residual claim (equity). It follows the accounting equation: assets equal liabilities plus equity. It reveals liquidity, solvency, and capital structure but is static and records assets at historical cost.
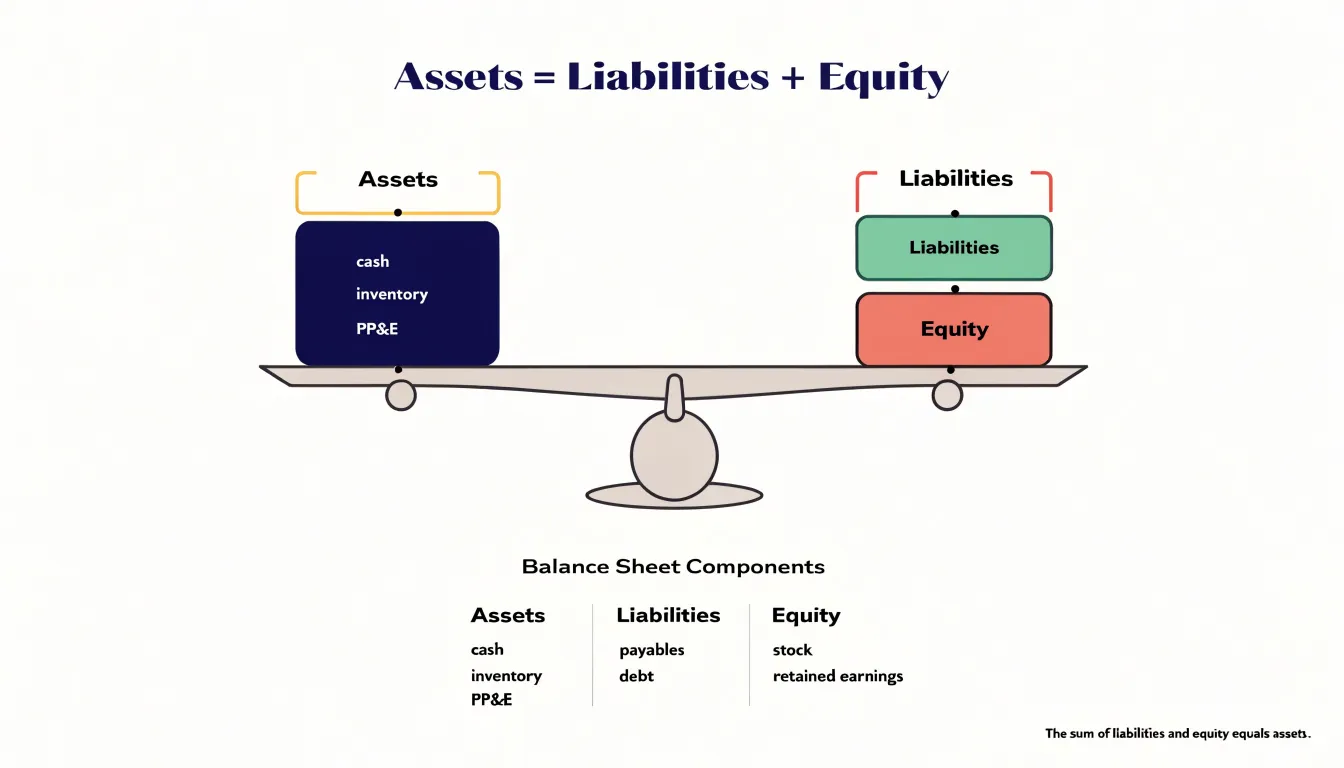
Table of Contents
- What a Balance Sheet Actually Tells You About a Company
- The Fundamental Equation
- Understanding Current Assets versus Non-Current Assets
- What Does the Company Owe Short-Term and Long-Term
- Shareholders Equity
- How to Spot Red Flags in Debt and Liquidity
- Working Through a Real World Balance Sheet Step by Step
- Simple Ratios You Can Calculate in Under Five Minutes
What a Balance Sheet Actually Tells You About a Company
A balance sheet is a snapshot of a company’s financial position on a specific date, typically the last day of a reporting period. It lists what the company owns (assets), what it owes (liabilities), and the residual interest of shareholders (equity). The fundamental accounting equation—assets equal liabilities plus equity—ensures that the statement balances. This snapshot is valuable because it shows the composition of resources and obligations at a point in time, allowing you to assess liquidity, solvency, and capital structure. For instance, you can compare current assets to current liabilities to gauge short-term liquidity, or examine the proportion of debt to equity to understand financial leverage. However, the balance sheet has limitations. It records assets at historical cost or amortized cost, which may diverge significantly from market value. Intangible assets like brand reputation, employee expertise, and customer relationships are often omitted or undervalued. Moreover, the balance sheet is static; it does not reveal the flows that occurred during the period, such as revenue generation, expense incurrence, or cash movements. That is why the income statement and cash flow statement are essential complements. The income statement shows profitability over time, while the cash flow statement tracks actual cash inflows and outflows, highlighting liquidity dynamics that the balance sheet only captures at a single moment. Together, these three statements provide a comprehensive view of a company’s financial health: the balance sheet shows what the company has and owes, the income statement shows how well it is performing, and the cash flow statement shows how it manages its cash. Relying solely on the balance sheet could lead to misleading conclusions, as a company might appear financially strong on paper but be generating insufficient cash to sustain operations. Therefore, a thorough analysis integrates all three statements to understand both the static position and the dynamic performance of the business. By recognizing what the balance sheet can and cannot reveal, you can use it more effectively in conjunction with other financial data to make informed decisions.
The Fundamental Equation
The accounting identity, Assets = Liabilities + Equity, sits at the heart of every balance sheet and gives the statement its name. Assets are the resources a company controls, from cash and inventory to buildings and patents. Liabilities are obligations owed to outside parties, such as loans, supplier invoices, and taxes payable. Equity represents the owners’ residual claim, the portion of the assets left over after all liabilities are settled. Because equity is defined as what remains once obligations are subtracted from resources, the two sides of the equation can never drift apart. The identity is that definition stated in arithmetic form, and the balance sheet is simply a snapshot of it at a single point in time.
The identity always holds because every transaction is recorded with double-entry bookkeeping. Each event is captured in at least two line items, and the combined effect on the equation nets to zero. Suppose a company borrows $50,000 from a bank. Cash, an asset, rises by $50,000, and a loan payable, a liability, rises by the same amount. Both sides of the equation grow equally. If the company then buys $20,000 of equipment in cash, one asset increases while another decreases, leaving totals unchanged. When a customer pays an outstanding invoice, cash rises and accounts receivable falls, again shifting the asset mix without disturbing the totals. Selling goods at a profit raises cash or receivables on the asset side while the equity side grows through retained earnings, so the balance is preserved.
This mechanics explains why the balance sheet always balances and why it serves as a powerful check on recordkeeping. If the two sides ever fail to agree, an error has crept into the books, whether a missed entry, a duplicated line, or a misclassified account. Reading a balance sheet with the equation in mind turns a static list of numbers into a story of connected movements. A jump in inventory, for instance, was funded by cash, a supplier payable, or new equity, and tracing the counterpart reveals how management chose to finance growth. The equation is the grammar of the statement; understanding it lets a reader follow each figure back to the decisions that produced it.
Understanding Current Assets versus Non-Current Assets
The balance sheet organizes assets into two main categories: current and non-current. The distinction hinges on the one-year rule: current assets are those expected to be converted into cash, sold, or consumed within one year (or the operating cycle, if longer). Non-current assets are all others—those with a useful life extending beyond one year. This split provides critical insight into a company’s liquidity, or its ability to meet short-term obligations.
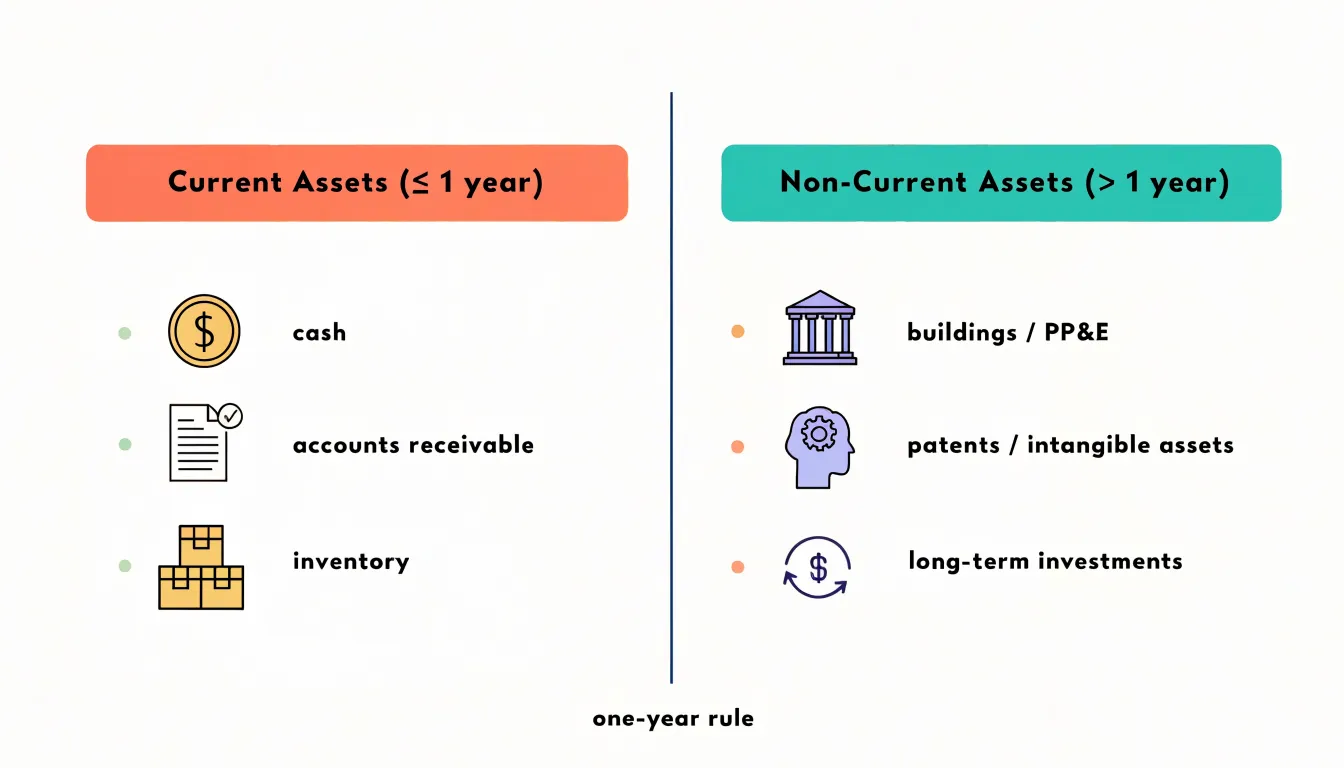
Current assets include cash and cash equivalents, which are immediately available; accounts receivable, money owed by customers for goods or services delivered; inventory, raw materials, work-in-progress, and finished goods awaiting sale; and short-term investments like marketable securities. These assets are liquid, meaning they can be quickly turned into cash to pay bills, cover payroll, or seize opportunities.
Non-current assets, by contrast, are long-term investments in the business. They include property, plant, and equipment (PP&E) such as buildings, machinery, and vehicles; intangible assets like patents, trademarks, and goodwill; and long-term investments. These assets are essential for operations but are not expected to be liquidated within a year. Their value lies in supporting ongoing revenue generation rather than meeting immediate cash needs.
The one-year rule matters because it helps analysts assess a company’s short-term financial health. By comparing current assets to current liabilities (obligations due within a year), stakeholders can compute the current ratio and quick ratio—key indicators of liquidity. A company with ample current assets relative to liabilities is better positioned to weather unexpected expenses or downturns. Conversely, a heavy reliance on non-current assets may signal long-term potential but could also indicate liquidity risk if cash is tied up in illiquid holdings. Understanding this split is foundational for reading a balance sheet and evaluating a company’s operational flexibility and financial resilience.
What Does the Company Owe Short-Term and Long-Term
Liabilities on a balance sheet are classified by when they come due, typically split into current (short-term) and non-current (long-term) obligations. Current liabilities include accounts payable, which represents money owed to suppliers for goods and services already received; short-term debt, such as bank loans or commercial paper due within a year; accrued expenses, which are costs that have been incurred but not yet paid, like wages, interest, or taxes; and the current portion of long-term debt. Long-term liabilities include bonds, mortgages, and other debt due beyond one year, along with lease obligations that extend beyond the next twelve months. The distinction matters because it shows what the company must settle in the near term versus what it can manage over a longer horizon. The mix of liabilities also reveals the nature of a company’s financial obligations. A heavy concentration of accounts payable and accrued expenses often reflects day-to-day operations, while significant short-term debt may indicate reliance on borrowing to fund working capital. Long-term debt suggests financing for capital investments or acquisitions. Lease obligations, whether short-term or long-term, represent contractual commitments for the use of assets. By examining the composition of liabilities, a reader can assess the company’s liquidity needs and its reliance on debt financing. For instance, a company with large current liabilities relative to its current assets may face pressure to meet its near-term obligations. Conversely, a high level of long-term debt might signal a capital-intensive business or a strategy of using leverage to fuel growth. Understanding how liabilities are classified and what the mix implies provides insight into a company’s financial flexibility and risk profile.
Shareholders Equity
Shareholders’ equity occupies the bottom portion of the balance sheet, and it answers a simple question: once every liability has been settled, what remains for the people who own the company? The figure is derived directly from the accounting equation, assets minus liabilities, and it represents the owners’ residual claim on the business. That residual nature matters. Creditors stand first in line for the company’s cash flows and assets, and shareholders receive what is left after those obligations are met. Equity is therefore the book value of the owners’ stake, a cumulative record of what has been contributed to the company and what the company has earned and kept over its life.
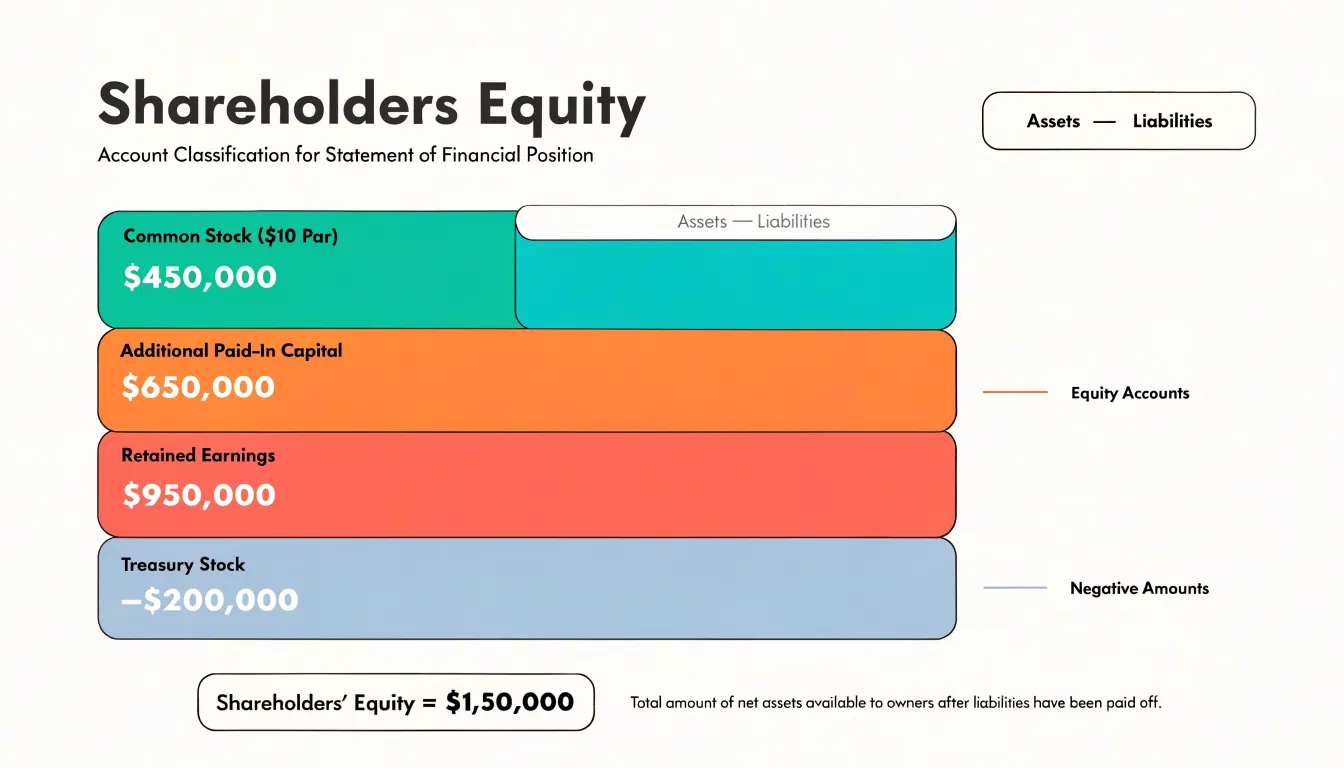
The number is assembled from several distinct components, each with its own story. Common stock records the nominal, or par, value of the shares the company has issued, a legal formality that typically bears little relation to the market price of those shares. Additional paid-in capital captures the amount investors paid above par value when the company sold shares, so together common stock and paid-in capital show what outsiders have put into the business through equity financing. Retained earnings reflect the cumulative profits the company has generated and chosen not to distribute as dividends. This is the engine of long-term equity growth, since every dollar of profit reinvested in the business adds to the figure. Treasury stock appears as a negative entry, representing shares the company has bought back from investors. A buyback reduces share count and returns capital, and the accounting records it as a reduction of equity.
For shareholders, the equity total offers a reference point for judging the company’s accumulated value and its history of reinvestment. Comparing equity with net income helps investors assess how effectively management compounds the capital entrusted to it, and watching the mix of retained earnings against paid-in capital reveals whether growth has come from profitable operations or from repeatedly issuing new shares. Equity also anchors common valuation measures such as price-to-book and return on equity. Because book value reflects historical transactions rather than current market prices, it serves best as a starting point for analysis, a window into how the company has built its capital base over time.
How to Spot Red Flags in Debt and Liquidity
Spotting red flags in debt and liquidity begins with tracking how a company’s borrowing changes relative to the capital its owners have committed. Compare total debt to shareholders’ equity over several reporting periods. A steady climb in this ratio signals that growth is increasingly funded by lenders, which raises fixed obligations and narrows the cushion available if earnings dip. Pay attention to short-term borrowings and the current portion of long-term debt, since these come due within the year and must be met from cash on hand or renewed credit.
Cash deserves the same period-by-period scrutiny. A declining cash balance alongside reported profits often points to earnings that are not converting into spendable funds, and it limits the buffer a company has for unexpected costs or a downturn in demand. Watch the cash flow statement for operating cash flow that lags behind net income over multiple quarters.
Receivables and inventory warrant attention when they grow faster than sales. If accounts receivable rise sharply while revenue holds flat, collections may be slowing, and the company may be extending easier terms to keep volume up. Days sales outstanding will drift higher in that case. Inventory climbing out of proportion to sales suggests goods are sitting longer, tying up cash and raising the risk of markdowns or write-downs. Compute inventory turnover and compare it with prior years and with peers to see whether the build is seasonal or a sign of weakening demand.
Negative working capital, where current liabilities exceed current assets, is a warning worth understanding in context. It can indicate a company is leaning on suppliers and short-term lenders to fund daily operations. Check whether payables are being stretched well beyond normal terms, which may signal that cash is tight. Taken together, these measures tell a coherent story: rising leverage, thinning cash, swelling receivables and inventory, and a working capital deficit often appear together before liquidity problems become visible in reported earnings.
Working Through a Real World Balance Sheet Step by Step
A guided walkthrough of a real company’s balance sheet transforms the fundamental equation from an abstraction into a practical reading skill. The best way to build that skill is to open an actual annual report, turn to the balance sheet, and move through it section by section in the order the statement itself is arranged, checking at each stage that assets, liabilities, and equity reconcile to the accounting identity that governs the whole document.
Begin at the top with current assets. Read the cash and cash equivalents line first, then short-term investments, accounts receivable, inventory, and prepaid expenses. For each line, pause and ask what real-world activity the number represents: receivables reflect sales already made but not yet collected, inventory reflects goods purchased or produced but not yet sold. Total the current assets and note the subtotal the company reports.
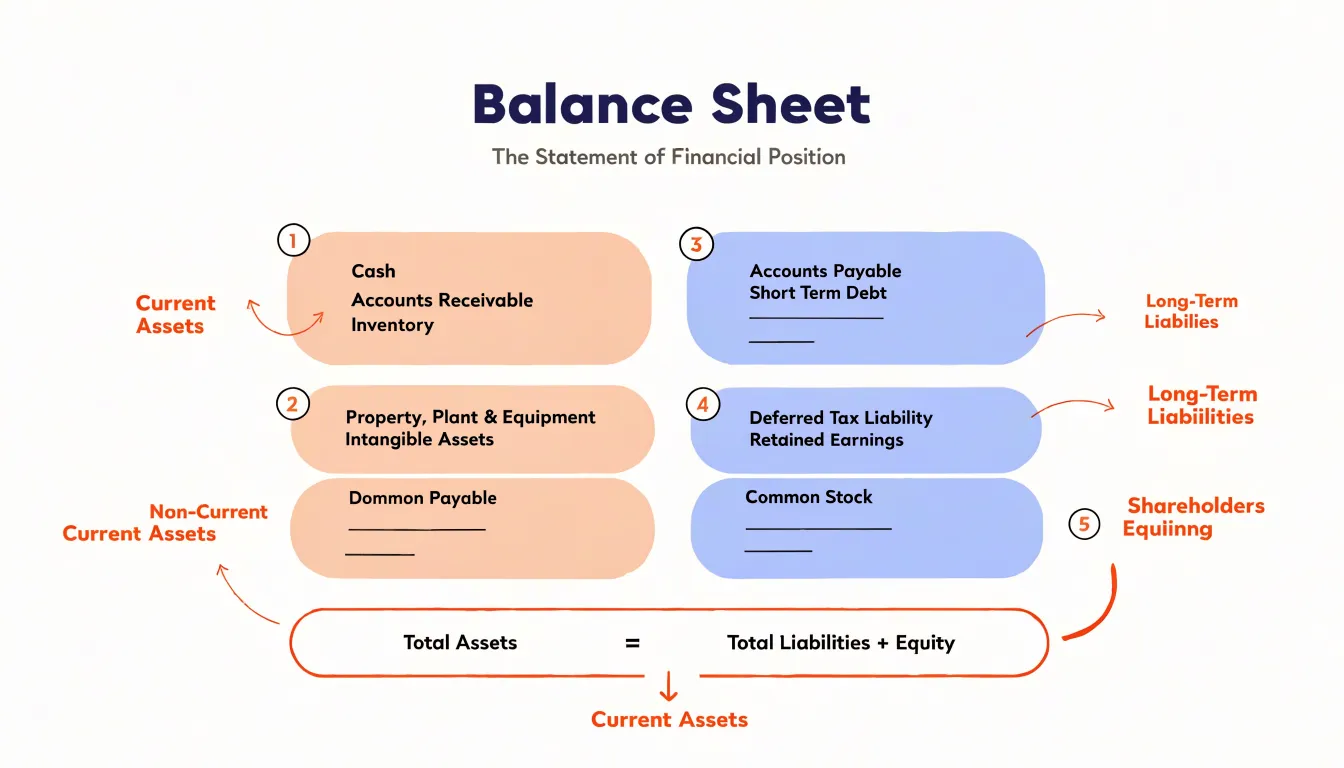
Move down to non-current assets, typically property, plant, and equipment, intangible assets such as goodwill, and long-term investments. These lines often carry the largest dollar figures, and reading them in sequence helps explain how the company funds its long-term capacity. When the asset side is complete, confirm that every category has been accounted for and that the reported total assets figure matches the sum of its parts.
Turn to liabilities, again starting with current items: accounts payable, accrued expenses, short-term debt, and the current portion of long-term debt. These represent obligations due within the year, and their size relative to current assets offers an immediate sense of near-term financial flexibility. Follow with long-term liabilities such as bonds, leases, and pension obligations, then total the liabilities.
The final section, shareholders’ equity, captures what remains for owners after all liabilities are subtracted from assets: common stock, additional paid-in capital, retained earnings, and accumulated other comprehensive income. Adding total liabilities to total equity should return the total assets figure exactly, closing the loop on the fundamental equation.
Working through a statement in this fixed order, one section at a time, teaches the reader to see the balance sheet as a connected system rather than a list of isolated numbers, and it makes the arithmetic of the accounting identity something the reader verifies rather than simply accepts.
Simple Ratios You Can Calculate in Under Five Minutes
Once you have the balance sheet in front of you, a handful of simple ratios can turn raw line items into a meaningful picture of a company’s financial position. These calculations take only a few minutes and require nothing more than the numbers already on the page. The current ratio is the most straightforward starting point. Divide total current assets by total current liabilities to see whether short-term resources cover short-term obligations. A result comfortably above one suggests the company can meet the bills coming due over the next twelve months, while a result below one points to a potential liquidity squeeze.
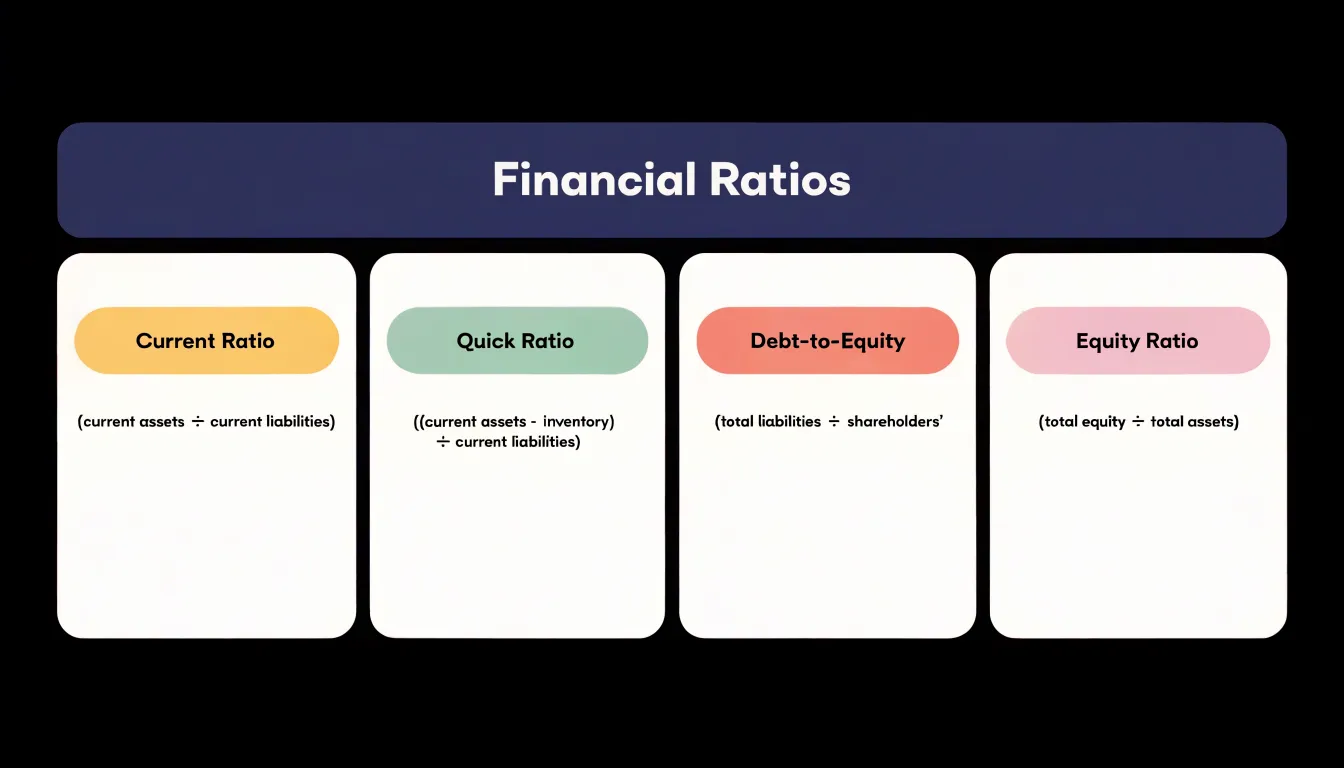
The quick ratio tightens this view by stripping inventory out of current assets before dividing by current liabilities. Inventory can take time to sell and may not convert to cash at its stated value, so the quick ratio focuses on the assets closest to cash: receivables, marketable securities, and the cash balance itself. Comparing the current and quick ratios tells you how much of a company’s short-term cushion depends on moving goods off the shelves.
Turning to the financing side, the debt-to-equity ratio divides total liabilities by shareholders’ equity. This measures how much of the business is funded by lenders versus owners. A higher figure indicates greater reliance on borrowed money, which amplifies both returns and risk; a lower figure suggests a more conservative capital structure with more room to absorb shocks. The equity ratio offers a related view by dividing total equity by total assets, showing the proportion of the asset base financed by owners. A higher equity ratio generally signals a sturdier balance sheet and greater resilience if credit markets tighten or earnings dip.
Read together, these four ratios sketch a fast profile of liquidity and leverage. None requires a spreadsheet or deep accounting knowledge. Jot them down, compare them against prior years and against close competitors, and you have a quick, practical read on whether a company looks financially sound or stretched.
Frequently Asked Questions
What does a balance sheet tell you about a company?
A balance sheet is a snapshot of a company’s financial position on a specific date, listing what it owns (assets), what it owes (liabilities), and shareholders’ equity. It helps you assess liquidity, solvency, and capital structure, but it is static and records assets at historical or amortized cost.
Why does a balance sheet always balance?
It balances because the accounting identity is Assets = Liabilities + Equity, and every transaction is recorded with double-entry bookkeeping. Each event is captured in at least two line items, and the combined effect on the equation nets to zero.
What is the difference between current and non-current assets?
Current assets are expected to be converted into cash, sold, or consumed within one year (or the operating cycle if longer), while non-current assets are all others with useful lives extending beyond one year. This split helps assess a company’s liquidity and short-term financial health.
What do current and long-term liabilities mean on a balance sheet?
Current liabilities are obligations due within a year, such as accounts payable, short-term debt, accrued expenses, and the current portion of long-term debt. Long-term liabilities are due beyond one year, including bonds, mortgages, and lease obligations extending beyond the next twelve months.
What is shareholders’ equity made up of?
Shareholders’ equity is the owners’ residual claim—assets minus liabilities—and includes common stock, additional paid-in capital, retained earnings, and treasury stock as a negative entry. It represents the book value of the owners’ stake and is built from contributions and retained profits.
How can you spot red flags in debt and liquidity on a balance sheet?
Compare total debt to shareholders’ equity over several reporting periods; a steady climb signals more lender funding and a narrower cushion if earnings dip. Also watch for declining cash alongside profits, receivables or inventory growing faster than sales, and negative working capital.