How to Read a Cash Flow Statement (and What to Look For)
A cash flow statement tracks actual money moving in and out of a business across operating, investing, and financing activities, unlike the income statement’s accrual-based profit. It reveals whether core operations generate real cash, how much is spent on assets, and reliance on debt or equity. Positive operating cash flow and free cash flow signal a self-funding, financially healthy company.
Table of Contents
- Why cash flow matters more than net profit for business health
- Operating activities
- How depreciation and working capital change your bottom line cash
- Investing activities
- Tracking debt repayments and shareholder payouts in financing activities
- Free cash flow
- How to spot red flags before a company runs out of cash
- Comparing cash flow to the income statement to catch accounting tricks
- Simple steps to evaluate a cash flow statement in under ten minutes
Why cash flow matters more than net profit for business health
Net profit occupies a privileged place on the income statement, and for good reason: it summarizes whether a company’s revenues exceed its expenses over a given period. The trouble is that profit is calculated using accrual accounting, which records revenue when it is earned and expenses when they are incurred, regardless of when money actually changes hands. A sale booked in December may not be collected until March. A supplier invoice may be recorded immediately even though payment is not due for ninety days. These timing differences are legitimate and often useful, but they mean the bottom line describes economic activity rather than liquidity. A company can report strong, growing profits while its bank account steadily empties.
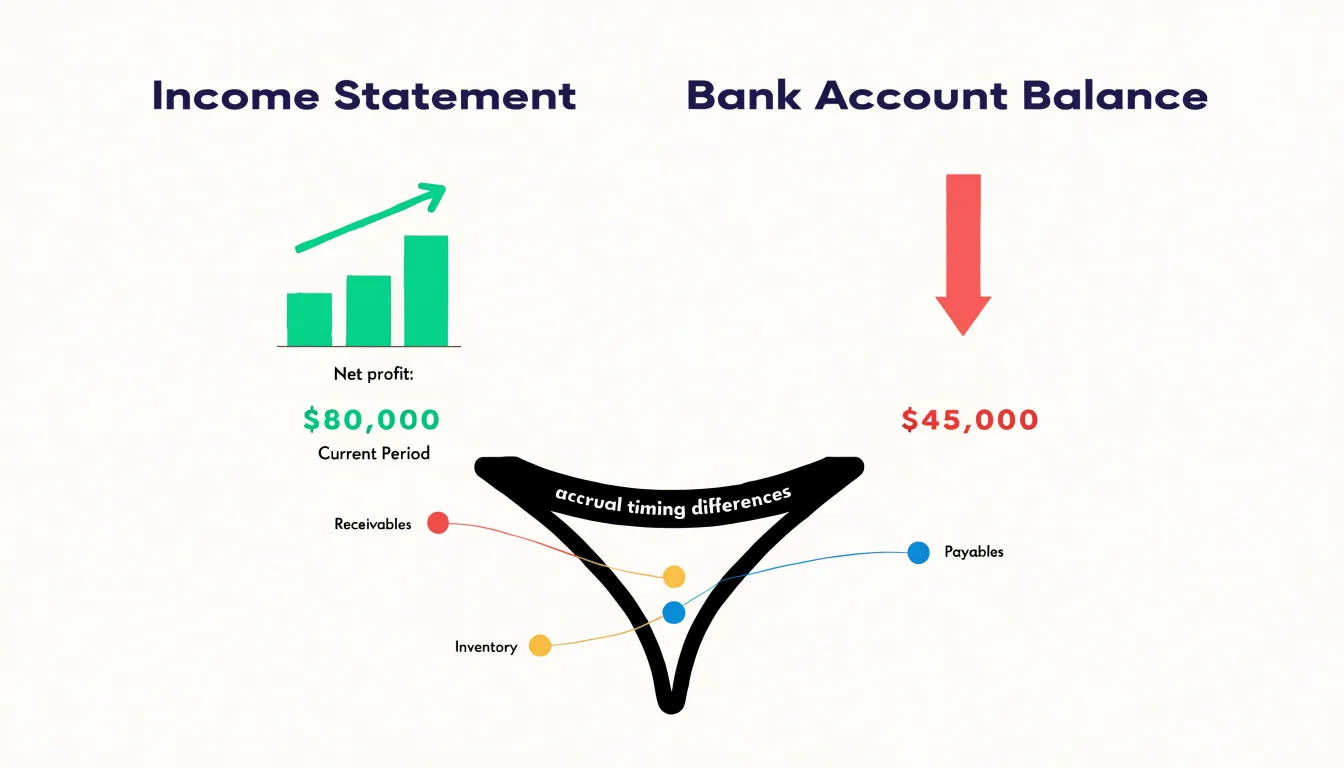
This is where cash flow becomes the more revealing measure. The cash flow statement tracks the actual movement of money into and out of the business across operating, investing, and financing activities. It shows whether the core operations are generating cash, whether the company is spending more than it brings in on capital projects, and how much it is relying on debt or equity to stay funded. For assessing short-term survival, these are the figures that matter. Payroll, rent, loan repayments, and supplier bills are settled in cash, not in accrued revenue. A business with a healthy income statement and a weak operating cash flow is living on borrowed time, and the cash flow statement is usually the first place that strain becomes visible.
The gap between profit and cash also tends to widen during rapid growth. Expanding companies often need to pay for inventory and labor before customers pay their invoices, so a surge in sales can consume cash even as reported earnings climb. Aggressive revenue recognition, slow collections, and rising receivables can all flatter profit while draining liquidity. Reading the cash flow statement alongside the income statement lets you see whether reported earnings are converting into actual money, and how much of the company’s cash generation depends on one-off items such as asset sales or new borrowing. For anyone evaluating a business’s near-term resilience, the cash flow statement is the more dependable guide.
Operating activities
The operating activities section of the cash flow statement records the cash moving in and out of a business as a direct result of its core day-to-day operations. It captures cash collected from customers for goods and services delivered, and it captures payments made to suppliers, employees, landlords, lenders for interest, and tax authorities. In effect, this section reconstructs the income statement on a cash basis, stripping away accrual accounting adjustments such as depreciation, changes in receivables, and changes in inventory, so that the reader can see how much actual money the business generated from doing what it does. It is the clearest available window onto whether a company’s ordinary operations are self-funding. Positive operating cash flow is non-negotiable because a business must ultimately pay its bills with cash rather than with accounting profit. A company can report net income while simultaneously burning cash if customers pay slowly, inventory piles up, or expenses are booked without corresponding outflows. Over time, persistent negative operating cash flow forces a company to fund itself through debt, asset sales, or fresh equity, none of which is sustainable indefinitely. Positive operating cash flow demonstrates that the core business can sustain itself, reinvest in growth, service debt, and return capital to shareholders. Interpretation requires attention to year-to-year swings. A single year of weak operating cash flow may reflect temporary working capital timing, such as a large inventory build ahead of a product launch or a delay in customer collections. A multi-year pattern of declining operating cash flow alongside stable or rising net income warrants closer scrutiny, since it can signal deteriorating collection practices, margin pressure, or aggressive revenue recognition. Conversely, a sharp jump in operating cash flow may stem from one-off factors like stretching payables to suppliers, which flatters a single period without reflecting durable improvement. Readers should compare operating cash flow across several periods, examine the working capital line items within the section, and consider the ratio of operating cash flow to net income as a quality check. Consistent, growing operating cash flow relative to reported earnings is a strong indicator of a healthy, cash-generative business, while divergence between the two is a prompt for deeper investigation.
How depreciation and working capital change your bottom line cash
Net income sits at the top of the cash flow statement, yet it rarely equals the cash a business actually generated during the period. Two forces explain most of the gap: non-cash charges such as depreciation, and movements in working capital. Understanding both is essential to reading the statement with confidence.
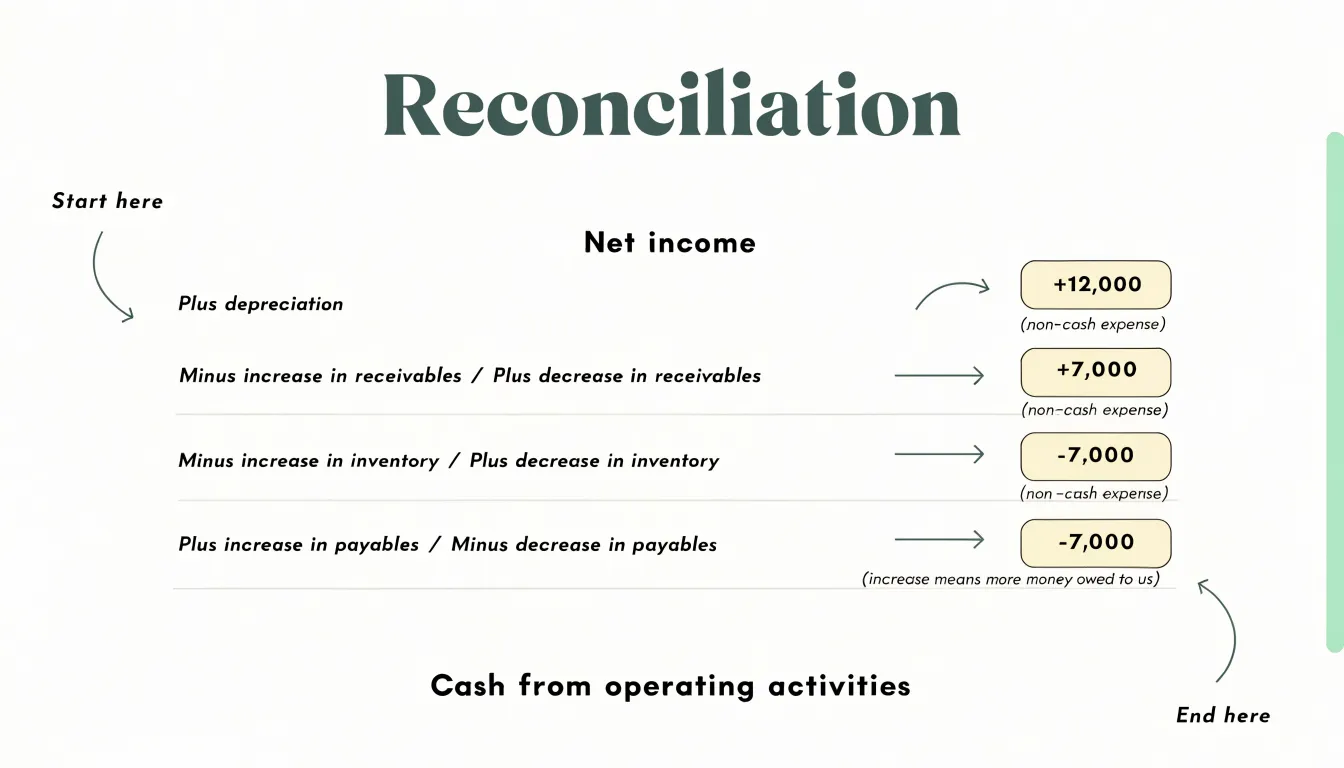
Depreciation is an accounting allocation, not a payment. When a company buys equipment, the cash leaves the bank on the purchase date. Accounting then spreads that cost across the asset’s useful life as depreciation expense, reducing reported profit year by year. By the time depreciation appears on the income statement, no money is moving. The cash flow statement therefore adds depreciation back to net income. This adjustment restores the expense that was subtracted on paper but never paid in the period, so the starting figure reflects operating cash more honestly. A capital-intensive business can show sizable depreciation add-backs, which is one reason its cash flow from operations may exceed net income substantially.
Working capital captures the everyday timing differences between earning revenue and collecting it, and between incurring costs and paying them. Consider receivables. A sale on credit boosts revenue and profit immediately, but the cash arrives later. When receivables rise, that growth absorbs cash, since the company has delivered goods or services without yet being paid. When receivables fall, collections outpace new sales and cash is released.
Inventory works the same way. Building stock consumes cash upfront, so an inventory increase drains reported cash even though the spending shows up on the balance sheet rather than the income statement. Drawing inventory down converts stock back into cash.
Payables run in the opposite direction. Stretching payment terms to suppliers keeps cash in the business longer, so an increase in payables is a source of cash. Paying suppliers faster reduces payables and uses cash up.
The net of these movements tells you whether working capital is funding growth or straining the balance sheet. A fast-growing company can post strong profits while cash dwindles because receivables and inventory are expanding faster than payables. Watching depreciation add-backs alongside working capital swings shows whether reported earnings translate into real cash.
Investing activities
The investing activities section of the cash flow statement tracks the money a company spends on long-term assets and the money it brings in from selling them. This is where you see the financial footprint of a company’s growth strategy. The largest line item here is typically capital expenditures, or capex, which covers purchases of property, plant, and equipment, spending on technology infrastructure, and other investments in the physical and operational base of the business. Capex shows up as a cash outflow, and its size relative to revenue and to depreciation tells you a great deal about management’s ambitions and the age of the company’s asset base.
Acquisitions appear in this section as well. When a company buys another business outright, the cash paid shows up as an investing outflow. Serial acquirers will show recurring lines here, and studying the pattern reveals whether growth is being purchased rather than built. Asset sales work in the opposite direction, generating cash inflows. A company selling off property, a division, or a portfolio of investments may be streamlining its focus, raising cash to pay down debt, or exiting markets where it lacks an advantage. Large or recurring inflows from asset sales deserve scrutiny, since they can flatter total cash flow while masking weakness in the core business.
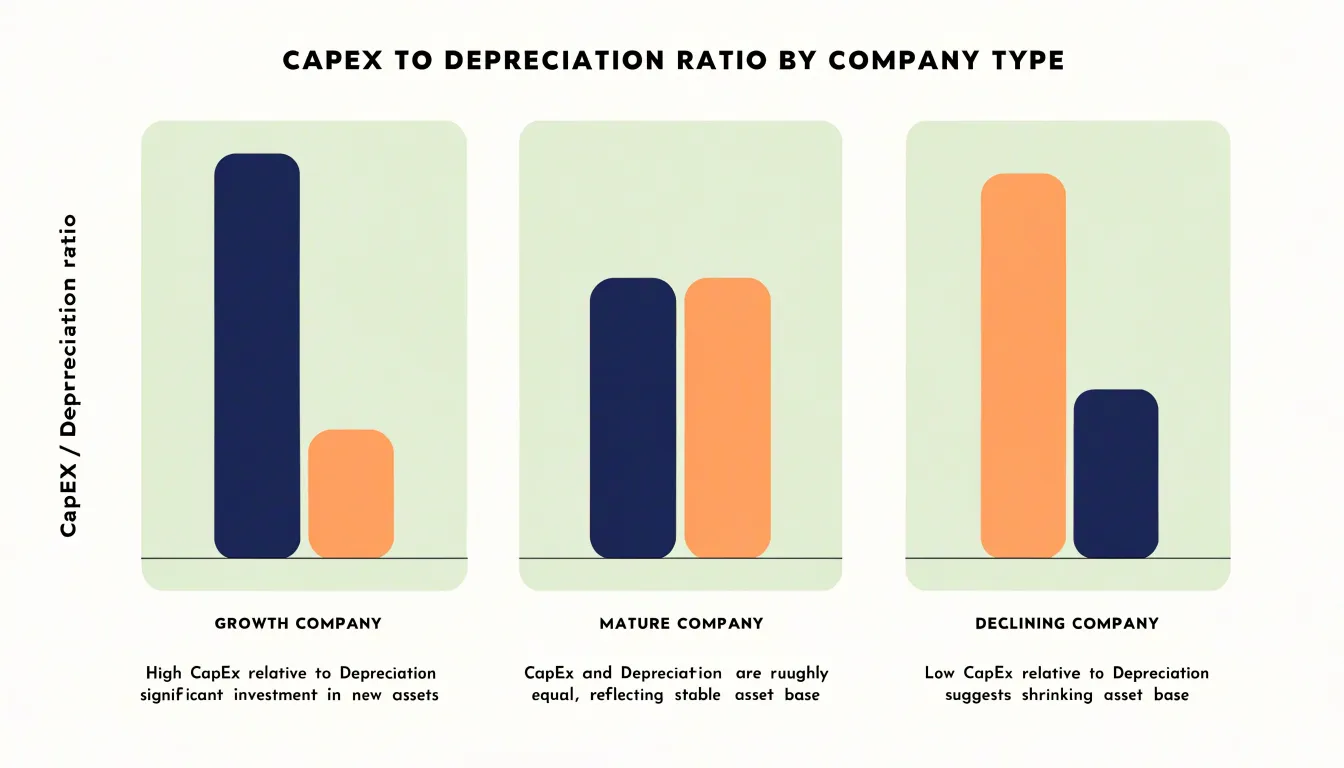
What you want to assess is whether the company is investing enough to stay competitive. Compare capex with depreciation: a business consistently spending well below its depreciation charge may be letting its asset base shrink, which can work in the short term but erodes future capacity. Growth companies often run capex well above depreciation, funding expansion. Mature businesses may sit closer to parity. Context matters, since capital intensity varies enormously by industry; a software company and a manufacturer will look nothing alike on this measure.
It also helps to compare investing outflows with operating cash flow. A company generating strong cash from operations and reinvesting a healthy share of it back into the business is generally building for the future. When operating cash flow is weak and capex is being cut to prop up free cash flow, that is a warning sign worth investigating. Reading the investing section alongside the other two sections gives you a complete picture of where the money comes from and where it goes.
Tracking debt repayments and shareholder payouts in financing activities
The financing activities section of the cash flow statement records transactions between the company and its providers of capital—lenders and shareholders. It captures money raised through borrowing or share issuance, and money returned through debt repayment, buybacks, and dividends. Because these flows reflect deliberate choices about how to fund the business and what to do with excess cash, they offer a clear window into management’s capital allocation priorities.
Borrowing appears as a cash inflow when a company takes on new loans or issues bonds. Debt repayment shows up as an outflow, typically the principal portion of loan payments. Tracking both together reveals whether a company is net borrowing or deleveraging. Persistent net borrowing can signal aggressive growth investment, but it may also indicate a company funding operations it cannot support internally. Consistent net repayment suggests a focus on strengthening the balance sheet and reducing financial risk.
Share issuance brings in cash, often to fund acquisitions, pay down debt, or bolster liquidity. Repeated share issuance dilutes existing owners, so its frequency and size merit attention. Share buybacks are outflows used to repurchase stock, which can signal management’s belief that shares are undervalued and reduce share count. Dividends are regular outflows returning cash to shareholders. A stable or growing dividend indicates confidence in sustained cash generation, while a cut often reflects financial stress or a shift toward retaining cash.
Looking at the mix of these activities reveals capital allocation strategy. A company generating strong operating cash flow that pays down debt, buys back stock, and pays dividends is returning capital and reducing risk. A company raising debt or issuing shares while paying dividends may be borrowing to fund distributions, a sustainable red flag. Frequent buybacks funded by debt can boost per-share metrics but increase leverage. The financing section also shows dependence on external capital: heavy reliance on borrowing or share issuance to cover negative operating cash flow is a warning sign. By examining the patterns in financing cash flows over several periods, readers can assess whether management is building a resilient financial structure or taking on undue risk.
Free cash flow
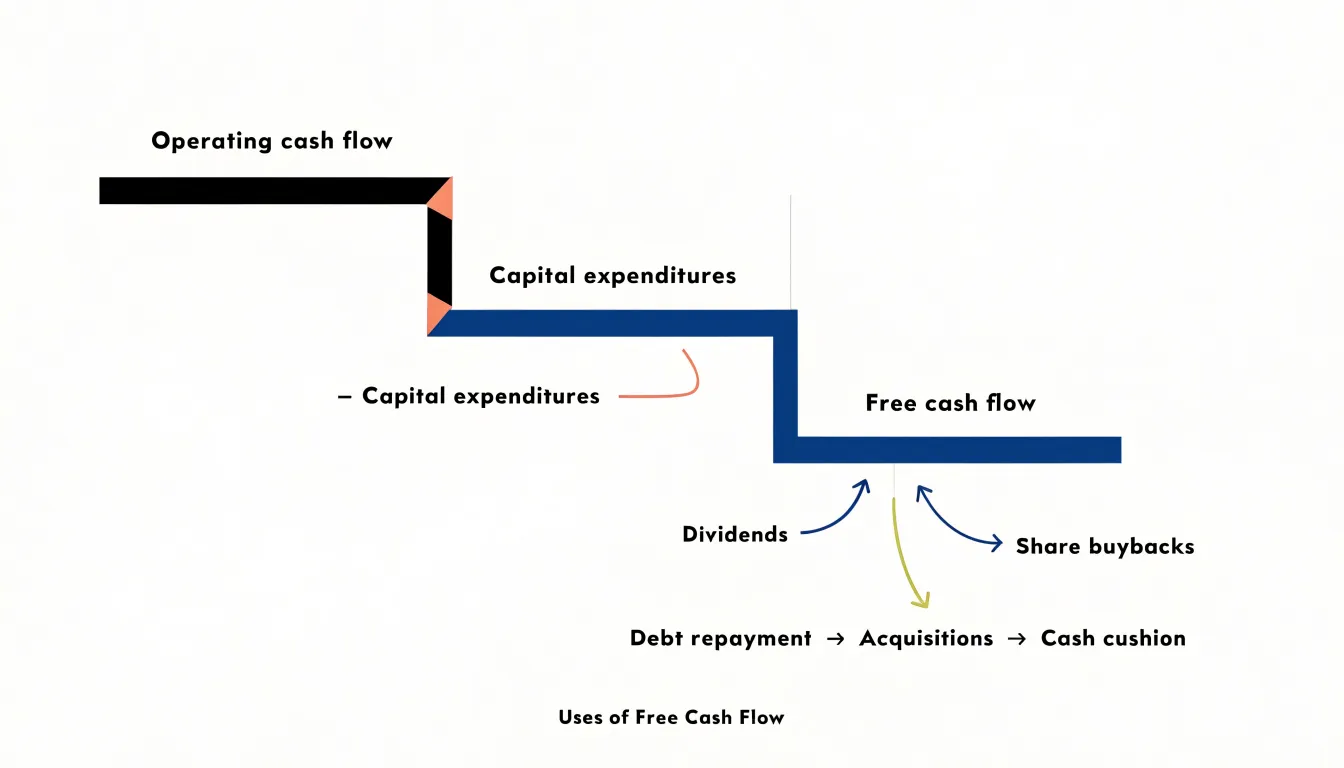
Free cash flow is the money a business has left over after paying for the day-to-day running of operations and for the investments required to keep those operations going. The standard formula is straightforward: take operating cash flow, the figure reported in the cash flow statement’s first section, and subtract capital expenditures, which appear in the investing section. What remains is the cash genuinely available to management. It can be used to pay dividends, buy back shares, reduce debt, fund an acquisition, or simply build a cash cushion. Investors rely on this measure because it cuts through accounting choices that can flatter reported earnings. Net income includes non-cash items such as depreciation and can be shaped by timing decisions on revenue recognition. Free cash flow instead tracks actual money moving in and out of the business, making it a cleaner test of whether a company generates enough cash to sustain and grow itself without constantly raising outside capital. A business that reports healthy profits but persistently weak free cash flow often has a quality problem hiding beneath the surface. When you encounter a negative free cash flow figure, context decides what it means. A young, fast-growing company may be spending heavily on new facilities, equipment, or infrastructure to capture market share, and a negative number can be a reasonable price for future earnings. The key questions are whether the capital spending is discretionary growth investment or essential maintenance, and whether the company has the balance sheet to fund the shortfall. A mature business with negative free cash flow is a different matter. If it is paying out dividends or buying back stock while burning cash, it may be borrowing to fund those distributions, a pattern that cannot persist indefinitely. Look at the trend over several years rather than a single period. A one-off spike in capital expenditures is far less concerning than a steady deterioration. Also compare free cash flow with net income over time; a persistent gap in either direction tells you something important about the economics of the business.
How to spot red flags before a company runs out of cash
A cash flow statement rewards careful reading because trouble usually announces itself well before a company runs out of money. The earliest warning sign is shrinking operating cash flow. When the cash generated by core operations declines across several periods while reported revenue or net income holds steady, the gap deserves attention. It often points to earnings that look healthy on paper yet fail to convert into actual cash, and that conversion problem tends to compound over time.
Rising receivables offer a related clue. When accounts receivable grow faster than sales, the company is booking revenue it has not yet collected, and the cash sits with customers rather than in the bank. A steady climb in days sales outstanding tells the same story: customers are taking longer to pay, collection is weakening, or the company is extending generous terms to keep sales volume up. Each of these leaves less cash on hand to meet payroll, supplier invoices, and debt service.
Repeated equity raises are another signal worth tracking. A single capital raise can fund genuine growth, yet a pattern of returning to investors every year or two suggests the business cannot fund itself. Watch how frequently shares are issued and how much dilution accumulates; each round spreads ownership across more shares and often reflects a cash shortfall the company could not close through operations.
Heavy reliance on debt to fund day-to-day operations is perhaps the most direct warning. When borrowing appears in the financing section of the cash flow statement quarter after quarter and the proceeds flow straight into working capital rather than into productive investment, the company is using credit to keep the lights on. Interest payments then consume cash that would otherwise support operations, and the cycle tightens as lenders grow cautious.
Read together, these signals form a recognizable pattern. Cash from operations weakening while receivables swell, combined with fresh equity or new borrowing to bridge the gap, describes a company spending more than it earns. Tracking the trend across several reporting periods, rather than any single quarter, gives the clearest picture of how much runway remains and how urgently the situation is developing.
Comparing cash flow to the income statement to catch accounting tricks
The income statement and the cash flow statement tell two versions of the same story, and the distance between them is often where trouble hides. Net income is built on accrual accounting: revenue is recorded when it is earned, expenses when they are incurred, regardless of whether cash has actually moved. Operating cash flow, by contrast, tracks the money that genuinely arrived in and left the business during the period. In a healthy company the two figures move roughly in tandem over time. When they diverge persistently, with net income climbing while operating cash flow stagnates or falls, that gap deserves close scrutiny.
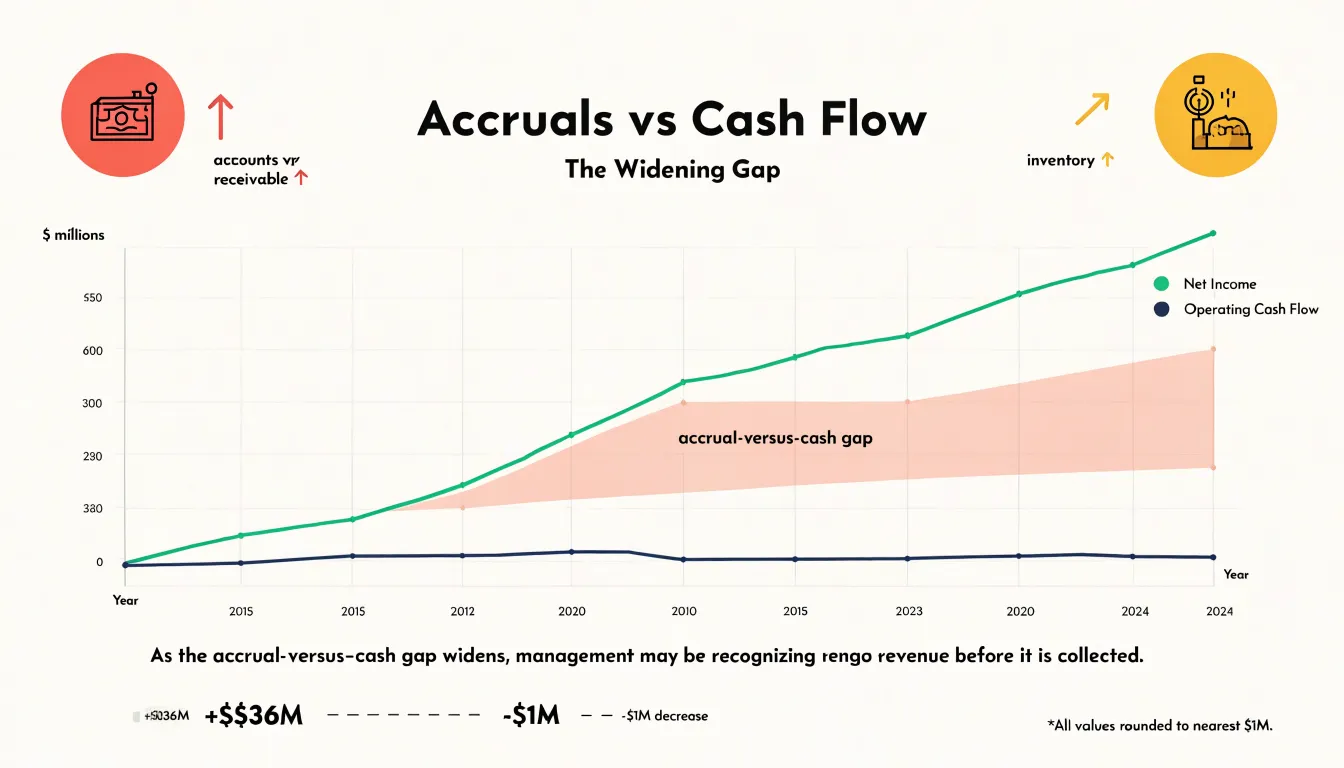
A multi-year pattern is the key signal. Any single quarter can produce a mismatch for innocent reasons such as the timing of a large customer payment or a seasonal build in inventory. The concern arises when reported profits consistently outrun the cash the business generates, year after year. That persistent spread means earnings are being booked without corresponding cash coming through the door, and there are only so many explanations for why.
One common cause is aggressive revenue recognition. A company might record sales before the customer has genuinely committed, ship product into its own distribution channel, or stretch the definition of when a contract counts as complete. Each of these practices lifts reported revenue immediately while the cash remains uncertain or, in some cases, never materializes. Another cause is the capitalization of costs that would ordinarily hit the income statement, which inflates profit today by pushing the expense into future periods on the balance sheet.
To investigate, look at receivables and inventory. If sales are rising but accounts receivable are growing faster, cash is being promised rather than collected. If inventory is building alongside rising profits, products may be sitting unsold in a warehouse while revenue is booked. Both trends push the accrual-versus-cash gap wider. The cash flow statement acts as a check on the income statement, translating reported earnings back into the actual movement of money. A durable gap between the two is one of the clearest early warnings that the profit figure cannot be taken at face value, and it is worth tracing back through several years of filings to see whether the pattern holds.
Simple steps to evaluate a cash flow statement in under ten minutes
To evaluate a cash flow statement efficiently, start with the trend in operating cash flow. This figure shows how much cash the business generates from its core operations. Look at the most recent three to five years: is operating cash flow generally rising, stable, or declining? A consistent upward trend suggests the company is converting sales into cash effectively. A declining trend, especially if revenue is growing, may indicate issues with collections, inventory management, or aggressive accounting.
Next, compare operating cash flow to net income. Over time, these two figures should roughly track each other. If operating cash flow is consistently lower than net income, it could mean earnings are being propped up by non-cash items or that working capital is absorbing cash. A simple check: divide operating cash flow by net income. A ratio persistently below 1 warrants a closer look.
Then review capital expenditures and free cash flow. Capex represents investments in long-term assets, and free cash flow is operating cash flow minus capex. This is the cash available for debt repayment, dividends, buybacks, or reinvestment. A company that consistently generates positive free cash flow has more financial flexibility. Negative free cash flow isn’t automatically bad—it may reflect growth investments—but it should be understood in context.
Finally, scan the financing section for red flags. Large or frequent debt issuances, especially to cover operating shortfalls, can signal financial stress. Conversely, consistent debt repayment and share buybacks funded by free cash flow are positive signs. Also watch for dividends paid out of borrowed money. A quick glance at the balance between debt raised and repaid, and the size of dividends relative to free cash flow, will highlight potential risks.
By following these steps—operating cash flow trend, cash flow versus net income, capex and free cash flow, and financing activities—you can assess a company’s cash flow health in under ten minutes.
Frequently Asked Questions
Why is cash flow more important than net profit for business health?
Net profit is calculated using accrual accounting, so it records revenue when earned and expenses when incurred, regardless of when cash changes hands. The cash flow statement tracks the actual movement of money and shows whether core operations are generating cash, which is more revealing for short-term survival.
What does the operating activities section of a cash flow statement show?
It records cash moving in and out from core day-to-day operations, including cash collected from customers and payments to suppliers, employees, landlords, lenders for interest, and tax authorities. Positive operating cash flow shows the core business can sustain itself, reinvest in growth, service debt, and return capital to shareholders.
Why is depreciation added back on the cash flow statement, and how do receivables and inventory affect cash?
Depreciation is an accounting allocation rather than a payment, so it is added back to net income to reflect operating cash more honestly. Rising receivables absorb cash because revenue is booked before collection, and building inventory consumes cash upfront, while drawing inventory down converts stock back into cash.
What should I look for in the investing activities section?
This section tracks money spent on long-term assets and money brought in from selling them, with capital expenditures typically the largest line item. Compare capex with depreciation and with operating cash flow to assess whether the company is investing enough to stay competitive.
What do debt repayments, share buybacks, and dividends show in financing activities?
The financing section records transactions with lenders and shareholders, including borrowing, debt repayment, share issuance, buybacks, and dividends. Tracking borrowing and repayment together shows whether a company is net borrowing or deleveraging, while buybacks and dividends reflect capital allocation choices.
What is free cash flow, and what does negative free cash flow mean?
Free cash flow is operating cash flow minus capital expenditures, representing cash genuinely available to management for dividends, buybacks, debt repayment, acquisitions, or building a cash cushion. Negative free cash flow is not automatically bad—it may reflect growth investments—but a mature business paying dividends or buying back stock while burning cash may be borrowing to fund those distributions.