
How to Read an Income Statement Line by Line
An income statement is read line by line from revenue down to net income: subtract cost of goods sold to get gross profit, deduct operating expenses (selling, general and administrative, and research and development) to get operating income, then subtract interest and taxes to reach net income. Comparing each line as a percentage of revenue over time reveals profitability, growth, and efficiency.
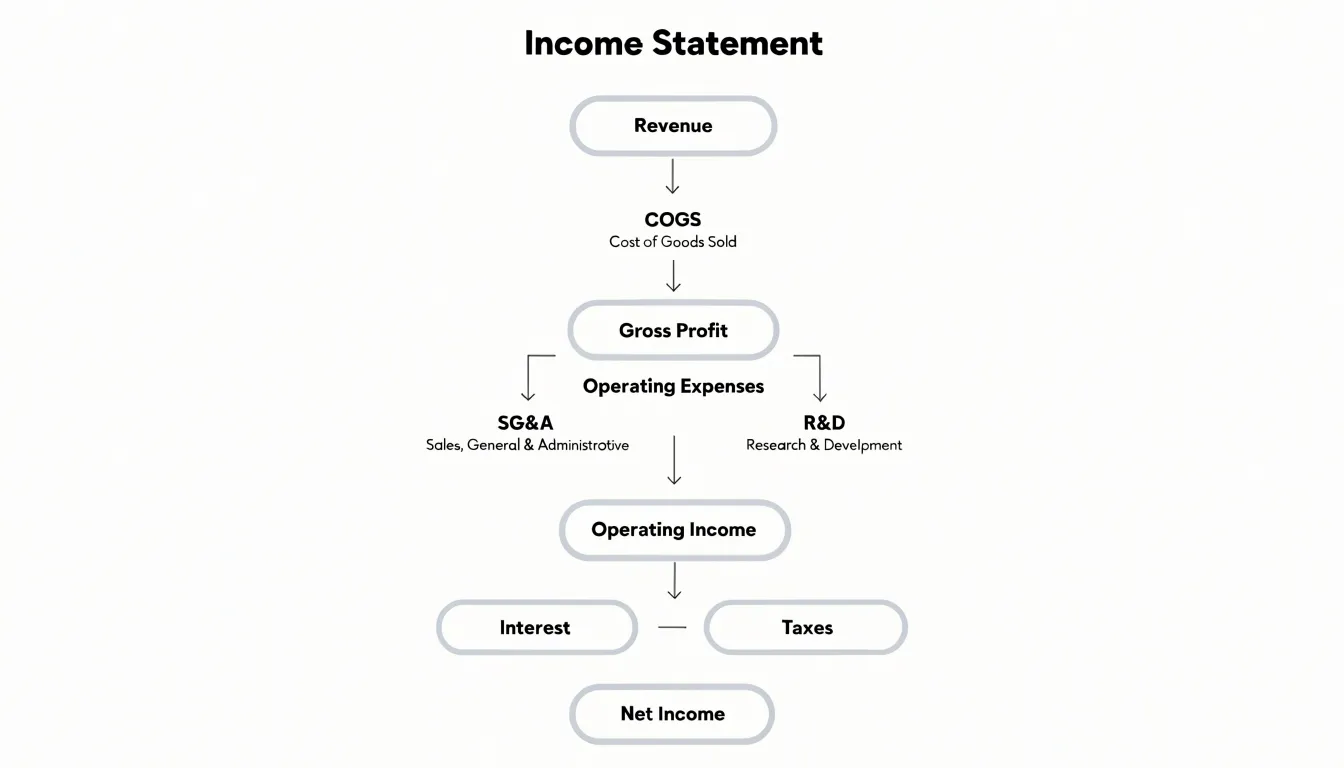
Table of Contents
- Why the income statement matters for your personal investments
- Revenue and sales
- Cost of goods sold and the direct costs of production
- How to calculate and interpret gross profit margin
- Operating expenses
- Measuring core business profitability through operating income
- Non-operating items
- Net income and how it reveals final profitability
- What red flags should you watch out for on an income statement
Why the income statement matters for your personal investments
The income statement occupies a central place in any serious investor’s toolkit because it answers the most fundamental question about a business: is it making money, and is that money growing? When you buy shares, you are buying a claim on a company’s future earnings, and the income statement is the primary document that reveals what those earnings look like today and how they have evolved over time. Reading it carefully lets you move past headlines and stock tips toward decisions grounded in the actual financial performance of the business.
Profitability is the first thing the statement illuminates. By walking from revenue down through cost of goods sold, operating expenses, interest, and taxes to net income, you can see how much of each dollar of sales the company ultimately keeps. That bottom line, along with margins at each stage, tells you whether the business has real pricing power and cost discipline or whether it is barely scraping by. A company with consistently healthy net margins has more room to weather downturns, fund growth, and reward shareholders.
Growth is the second dimension. Comparing revenue and earnings across several years, and ideally across quarters, shows you the trajectory of the business. A rising top line paired with rising profits suggests a company expanding its market and doing so efficiently. Shrinking revenue or profits that lag revenue growth can be an early warning sign of trouble ahead. The income statement gives you the trend data you need to distinguish a temporarily depressed quarter from a deteriorating business.
Efficiency ties these threads together. The relationship between revenue, expenses, and profits reveals how well management converts sales into earnings. Rising operating expenses that outpace revenue growth, for instance, may point to bloated operations or a business losing its competitive edge. Watching these ratios over time helps you judge whether the people running the company are good stewards of your capital.
Taken together, these insights let you make informed investment decisions. You can compare companies within an industry, evaluate whether a stock price reflects real earnings power, and track whether your thesis about a business is playing out. The income statement is not the only tool an investor needs, but it is the foundation on which sound analysis is built.
Revenue and sales
Revenue, often called the top line, is the total amount of money a company brings in from selling goods or services during a period before any costs are subtracted. It sits at the very top of the income statement, and every other figure below depends on it. For a retailer, revenue is the value of merchandise sold; for a software company, it may be subscription fees; for a manufacturer, it is the invoice value of products shipped. This first line answers a basic question: how much business did the company actually do?
How a company recognizes revenue matters as much as the number itself. Under accrual accounting, revenue is recorded when a product is delivered or a service is performed, regardless of when cash changes hands. A company that ships goods in December records the sale in December even if the customer pays in February. For long-term contracts, firms may recognize revenue gradually as work progresses, using percentage-of-completion methods. Subscription businesses spread revenue across the months a customer is served. These rules, governed by accounting standards, exist to tie reported revenue to the actual transfer of value rather than the timing of payments, which makes comparisons across periods more meaningful.
Reading the top line as the starting point for growth analysis follows naturally. Revenue growth tells you whether a company is expanding its customer base, raising prices, or entering new markets. Tracking that line across several years reveals the trajectory: steady gains suggest a healthy business, while sudden jumps or declines invite questions about acquisitions, divestitures, or one-time events. Comparing revenue growth with the growth of receivables or inventory can also flag whether sales are being converted into cash or merely booked. Because nearly every profitability ratio, such as gross margin or operating margin, uses revenue as its denominator, understanding the top line is a prerequisite for interpreting everything beneath it. When you know what revenue represents, how it was recognized, and how it has changed over time, the rest of the income statement becomes a story about how efficiently that money was turned into profit.
Cost of goods sold and the direct costs of production
Cost of goods sold sits directly beneath revenue on the income statement, and it represents the direct costs a company incurs to produce or acquire the goods and services it sells during a period. For a manufacturer, COGS typically includes raw materials, the labor directly involved in production, and manufacturing overhead such as factory utilities, equipment depreciation, and the cost of running production facilities. A retailer’s COGS is simpler, consisting mainly of the wholesale price paid for inventory plus freight and handling costs. A software company might record the cost of hosting infrastructure, third-party licenses embedded in its product, and the support staff dedicated to delivering the service. Service businesses often report very little in COGS, sometimes labeling the line cost of services, which covers billable labor and direct project expenses.
Because the composition of COGS varies so widely by industry, the line is best read in context. A grocery chain may report COGS at eighty percent of revenue, while a subscription software firm might show fifteen percent. Neither figure is inherently good or bad; each reflects the economics of its sector. What matters for analysis is consistency and trend. A rising COGS ratio over several periods can signal input cost inflation, pricing pressure, discounting, or a shift in product mix toward lower-margin offerings. A falling ratio may indicate improved purchasing, economies of scale, or a favorable mix shift.
The reason COGS is subtracted from revenue is to arrive at gross profit, the first meaningful measure of profitability on the statement. Gross profit shows how much money remains after covering the direct costs of the product itself, money that must then fund operating expenses such as sales, marketing, administration, and research, as well as interest and taxes. This subtraction isolates the core economics of what the company sells before the cost of running the organization is layered on. Because of this role, COGS serves as the foundation for gross margin analysis, one of the most closely watched indicators of pricing power and operational efficiency, and it anchors comparisons between companies within the same industry.
How to calculate and interpret gross profit margin
Gross profit margin is calculated by subtracting cost of goods sold from revenue to arrive at gross profit, then dividing gross profit by revenue and multiplying by 100 to express the result as a percentage. If a company reports $500,000 in revenue and $300,000 in cost of goods sold, its gross profit is $200,000 and its gross profit margin is 40 percent. This single figure captures how much of every sales dollar remains after the direct costs of producing or acquiring the goods sold, and that remaining amount is what funds operating expenses, interest, taxes, and ultimately profit.
Interpreting the result begins with understanding what the margin reveals about pricing power. A high gross margin suggests a company can charge a premium for its products, whether because of brand strength, proprietary technology, or a defensible market position. A low margin often points to a commodity business where customers can easily switch and price competition is fierce. The margin also speaks to production efficiency: a company that negotiates better terms with suppliers, controls waste, or automates manufacturing can widen its margin without raising prices. Because the margin blends pricing and cost control, watching it over several periods helps you see which lever management is actually pulling. A margin that holds steady while revenue grows suggests scaling without sacrificing economics; a shrinking margin may signal rising input costs, discounting pressure, or a shift toward lower-margin products.
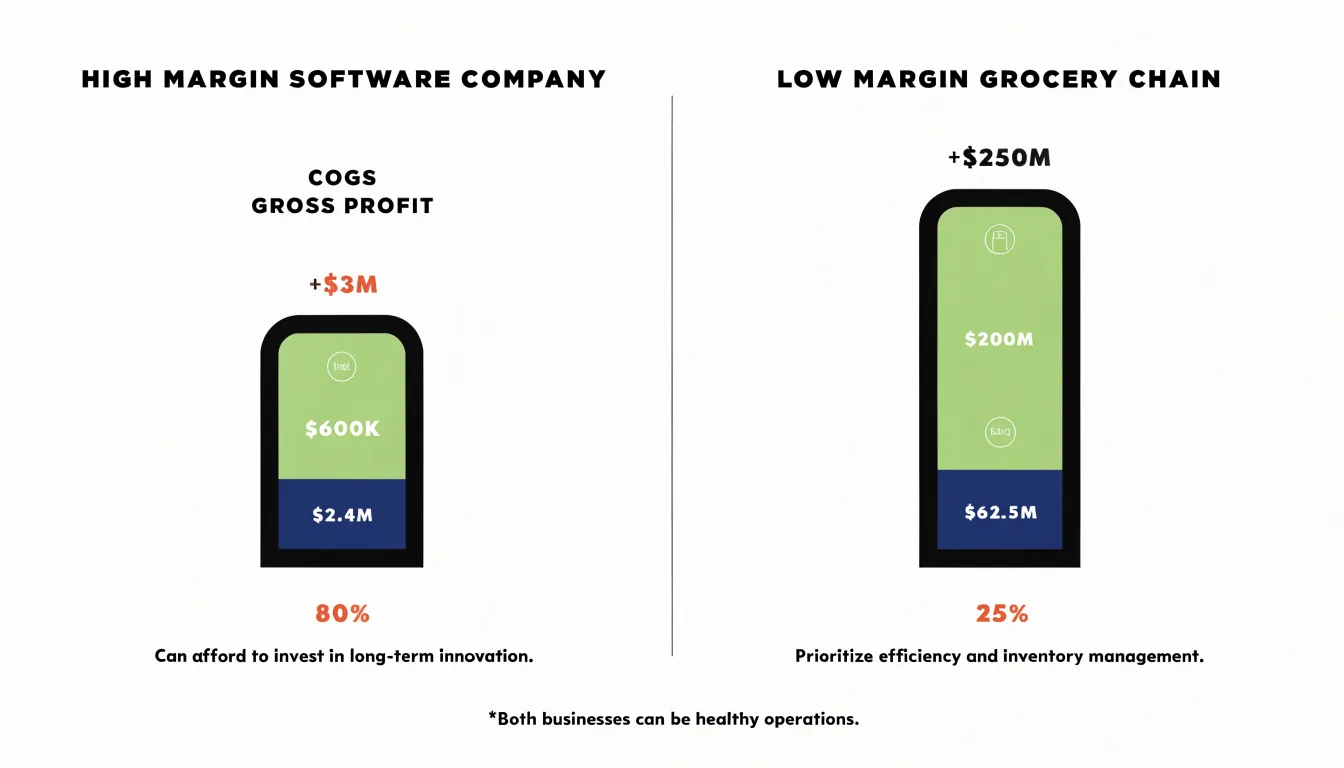
Comparisons across companies require care. Gross margins vary enormously by industry, so a software firm at 80 percent and a grocery chain at 25 percent can both be healthy operations. The meaningful comparison is against close peers and against a company’s own history. Look at the trend over several years and at how the margin behaves through economic cycles. It is also worth checking whether companies define cost of goods sold consistently; some include distribution or warehousing costs that others exclude, which distorts cross-company comparisons. Finally, use gross margin alongside operating margin and inventory turnover to build a fuller picture of how well a company converts its production economics into real profitability.
Operating expenses
Operating expenses sit below the gross profit line and capture the costs of running the business day to day, apart from the direct cost of goods sold. On most income statements these expenses are grouped into a handful of standard categories, and reading each one separately tells you a great deal about how a company spends money and where its priorities lie.
Selling expenses cover the cost of generating revenue: sales staff compensation and commissions, advertising and marketing campaigns, promotional materials, and the distribution costs tied to getting products to customers. A company with a heavy selling burden is often one that must spend aggressively to win each sale, whether because it operates in a competitive market, sells to consumers through costly channels, or is still building brand awareness. Watching this line over time shows whether growth is being purchased with ever-larger promotional outlays.
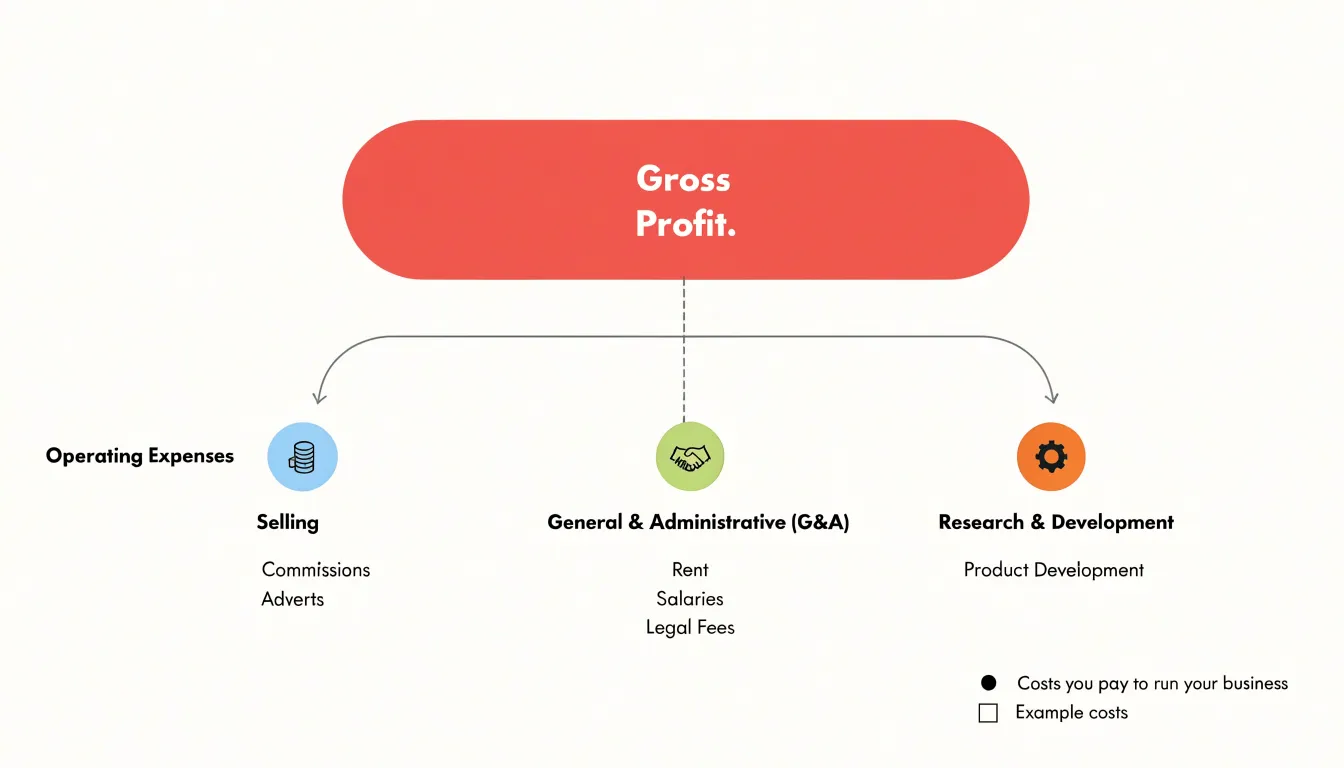
General and administrative expenses, frequently reported together with selling costs as SG&A, cover the overhead of simply existing as an organization: executive and office salaries, rent, utilities, legal and accounting fees, insurance, and IT support. These costs tend to be relatively fixed in the short run, so their proportion of revenue shrinks as sales grow and swells when revenue falls. A persistently high G&A load relative to peers can point to a bloated corporate structure or a business that has not yet achieved scale.
Research and development expenses appear on the statements of companies that invest in future products, including technology, pharmaceutical, and industrial firms. R&D is discretionary in the near term, so the size and trend of this line reveals management’s appetite for long-term bets. Rising R&D alongside stable selling costs often signals a company building for the future, while cuts to R&D can flatter current profits at the expense of the pipeline.
Taken together, these categories map a company’s cost structure. Compare each line as a percentage of revenue across several years and against competitors. Shifts in the mix show where management is investing, where it is cutting, and whether overhead is under control. The notes to the financial statements frequently break out further detail, and segment disclosures can show which parts of the business carry the heaviest burden.
Measuring core business profitability through operating income
Operating income is a critical metric that reveals the profitability of a company’s core business operations. It is calculated by subtracting operating expenses from gross profit. Gross profit, itself, is derived by deducting the cost of goods sold (COGS) from revenue. Operating expenses include selling, general, and administrative (SG&A) expenses, research and development (R&D), depreciation, and amortization. These are the costs incurred to run the day-to-day operations of the business, such as salaries, rent, marketing, and utilities. By subtracting these from gross profit, operating income isolates the profit generated from regular business activities, excluding financing and investing effects.
Operating income is a key measure of core business performance because it focuses exclusively on the profits earned from operations, before interest and taxes. This makes it particularly useful for comparing companies within the same industry, as it removes the impact of capital structure (debt vs. equity) and tax jurisdictions. It answers the question: How much profit does the business generate from its primary activities? A rising operating income indicates improving operational efficiency, pricing power, or cost control. Conversely, a declining operating income may signal eroding margins, rising costs, or competitive pressures.
Investors and analysts often refer to operating income as operating profit or EBIT (earnings before interest and taxes), though EBIT can sometimes include non-operating income. Operating income is a cleaner measure because it excludes non-operating items like interest income, gains from asset sales, or foreign exchange effects. This purity allows stakeholders to assess the health of the underlying business. For example, a company might report a net profit due to a one-time asset sale, but if operating income is negative, it indicates the core business is unprofitable.
Moreover, operating income is used in various financial ratios, such as operating margin (operating income divided by revenue), which shows how much profit is generated per dollar of sales after covering operating costs. A higher operating margin suggests better efficiency and profitability. By analyzing operating income trends over time, one can gauge management’s ability to control costs and grow profits from operations. In sum, operating income provides a clear lens into the operational engine of a company, making it an essential line item for any serious reader of financial statements.
Non-operating items
Below the operating income line, an income statement shifts from assessing core business performance to capturing financing and tax effects. Interest expenses and interest income appear here because they stem from how the company is financed, rather than from its primary operations. Interest expense reflects the cost of borrowed capital: loans, bonds, and other debt instruments. It is reported as a separate line item, often labeled “interest expense” or “finance costs,” and is subtracted from operating income. Interest income, by contrast, represents earnings on cash balances, short-term investments, or loans the company has made. It is added back to operating income. The net of these two figures—interest expense minus interest income—is frequently presented as a single line called “net interest expense” or “net financial costs.” This netting can obscure the gross amounts, so readers should check the notes if the distinction matters. For highly leveraged companies, interest expense can be substantial and may cause a positive operating income to turn into a pre-tax loss. Conversely, cash-rich firms may report net interest income that boosts pre-tax profit.
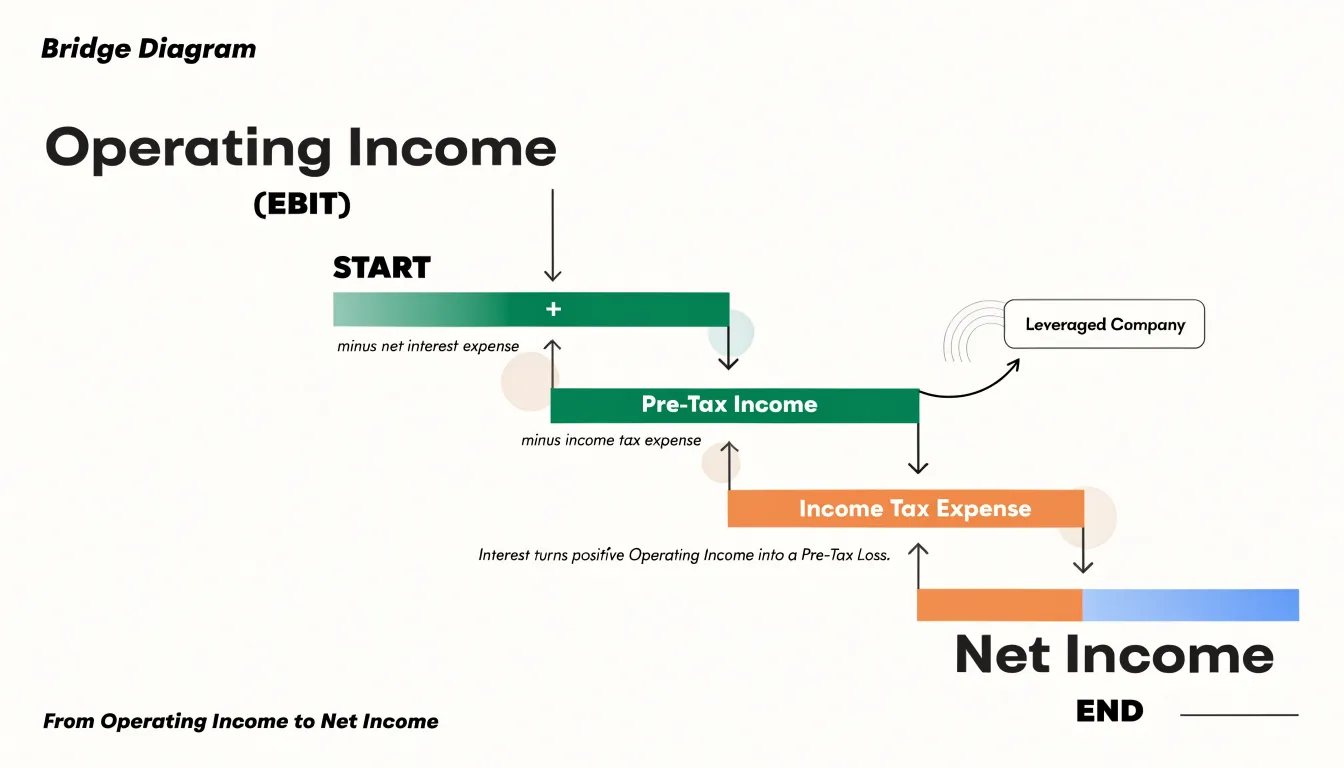
After interest, the next major non-operating item is income tax expense. This line reflects the company’s tax obligation on pre-tax income, calculated according to applicable tax laws. It is reported as a separate deduction, typically labeled “income tax expense” or “provision for income taxes.” The resulting figure after subtracting taxes is net income, the bottom line attributable to shareholders. Tax expense is not simply a fixed percentage of pre-tax income; it can vary due to deferred taxes, tax credits, and different treatment of certain items. A low effective tax rate might signal favorable tax planning or one-time benefits, while a high rate could indicate unfavorable jurisdictions or non-deductible expenses. Analysts often compare the effective tax rate (tax expense divided by pre-tax income) across periods and peers to assess sustainability. Together, interest and taxes form the bridge between operating profit and net profit, and understanding their magnitude and volatility is essential for forecasting future earnings.
Net income and how it reveals final profitability
Net income is the figure that sits at the very bottom of the income statement, which is why it is often called the bottom line. It represents what remains of a company’s revenue after every expense has been subtracted: the cost of goods sold, operating expenses such as salaries, rent, and marketing, depreciation and amortization, interest paid on debt, and income taxes. In its simplest form, the calculation runs from revenue down through gross profit and operating income, then subtracts non-operating items like interest and taxes to arrive at the final number. Because it captures every layer of cost, net income is the most complete single measure of profitability the statement offers.
What net income tells you is whether the company actually made money once everything was paid for. A business can post strong revenue and even healthy gross margins while still losing money at the bottom line if overhead, interest, or taxes consume the gains. Watching net income over several periods reveals whether profitability is improving, stagnating, or deteriorating, and comparing it against revenue shows the net profit margin, which indicates how many cents of profit the company keeps from each dollar of sales. A rising margin suggests growing efficiency or pricing power, while a falling margin can signal rising costs or discounting pressure.
Net income also feeds directly into earnings per share, or EPS. To calculate basic EPS, you divide net income available to common shareholders by the weighted average number of shares outstanding during the period. This per-share figure matters because it translates total profit into an amount attributable to each ownership unit, making it easier to compare performance across companies of different sizes and across time. Diluted EPS goes a step further by accounting for stock options, convertible securities, and other instruments that could increase the share count, giving a more conservative view of per-share earnings.
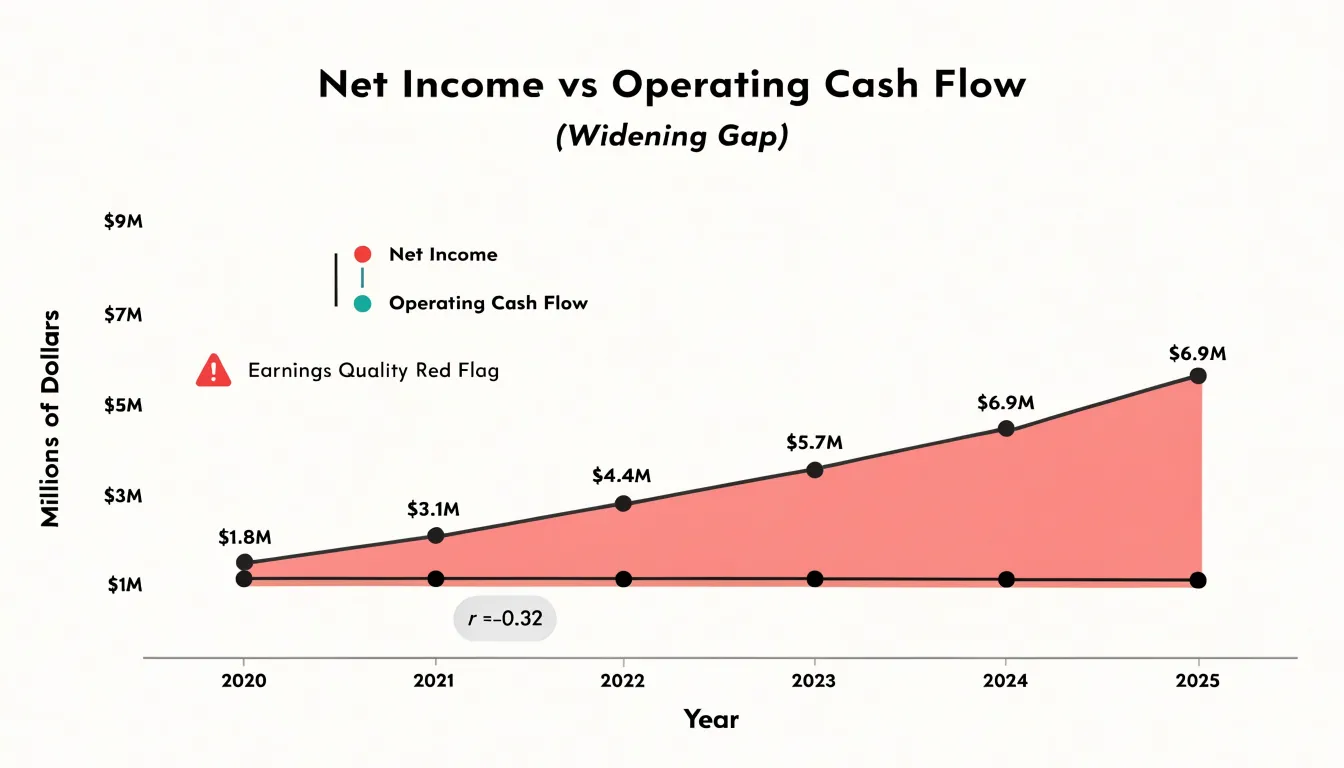
When reading this line, look beyond the headline number. Check whether net income was driven by core operations or by one-time gains such as asset sales, and compare it with cash flow from operations to see whether reported profits are being converted into actual cash. Together, these checks tell you how durable and genuine the bottom-line profitability really is.
What red flags should you watch out for on an income statement
Reading an income statement line by line gives you the raw numbers, and knowing which patterns deserve scrutiny turns those numbers into a diagnostic tool. Declining gross margin is one of the earliest warning signs. When revenue grows but the cost of goods sold grows faster, the company may be discounting heavily to win sales, facing input cost inflation it cannot pass on, or losing pricing power to competitors. A steady, multi-period slide in gross margin merits a close look at the underlying cause before accepting the headline revenue figure at face value.
Rising operating expenses relative to sales tell a related story. Sales, general, and administrative costs that climb faster than revenue suggest the company is spending more to generate each dollar of business, whether through heavier marketing, bloated headcount, or weakening operational discipline. Watch the trend across several quarters; a single spike may reflect a strategic investment, while a persistent creep points to structural cost problems.
Revenue quality issues are subtler. Look for receivables growing faster than sales, which can indicate aggressive revenue recognition or customers who are slow to pay. A rising share of revenue from channel stuffing, related-party transactions, or non-recurring sources deserves scrutiny. Sudden revenue jumps late in a reporting period, or heavy reliance on a small number of customers, can signal fragility that the top line alone conceals.
One-time items distort earnings in both directions. Restructuring charges, asset impairments, litigation settlements, and gains from asset sales can swing net income dramatically without reflecting ongoing operations. Frequent “one-time” charges across consecutive years are a particular red flag, since recurring items labeled as exceptional can mask persistent operating weakness. Compare reported earnings with adjusted figures, and examine what each adjustment excludes.
Finally, watch for earnings that diverge from cash flow. Net income rising while operating cash flow stagnates is a classic signal that profits exist mainly on paper. Together, these warning signs form a checklist for evaluating whether an income statement reflects durable performance or a flattering snapshot.
Frequently Asked Questions
Why is the income statement important for investors?
It shows whether a business is making money and whether that money is growing, and when you buy shares you are buying a claim on a company’s future earnings. Reading it carefully can help you move past headlines and stock tips toward decisions grounded in actual financial performance.
How does a company recognize revenue on the income statement?
Under accrual accounting, revenue is recorded when a product is delivered or a service is performed, regardless of when cash changes hands. Long-term contracts may use percentage-of-completion methods, and subscription businesses spread revenue across the months a customer is served.
How do you calculate gross profit margin?
Subtract cost of goods sold from revenue to get gross profit, then divide gross profit by revenue and multiply by 100. For example, $500,000 in revenue and $300,000 in cost of goods sold gives $200,000 gross profit and a 40 percent gross profit margin.
What do operating expenses include?
Operating expenses sit below the gross profit line and capture the day-to-day costs of running the business apart from the direct cost of goods sold. They are grouped into selling expenses, general and administrative expenses, and research and development expenses.
What is operating income and why does it matter?
Operating income is calculated by subtracting operating expenses from gross profit, and it isolates the profit generated from regular business activities before interest and taxes. A rising operating income indicates improving operational efficiency, pricing power, or cost control, while a declining figure may signal eroding margins or competitive pressures.
What are common red flags on an income statement?
Common red flags include declining gross margin, operating expenses rising faster than sales, receivables growing faster than revenue, frequent one-time items, and net income rising while operating cash flow stagnates. These patterns can help you judge whether an income statement reflects durable performance or a flattering snapshot.