
Income Statement
An income statement is a financial report showing a company’s revenue, expenses, and net income over a defined period, typically a quarter or year. It flows from revenue through cost of goods sold to gross profit, then deducts operating expenses to reach operating income, subtracts interest and taxes, and ends at net income, revealing profitability and cost structure.
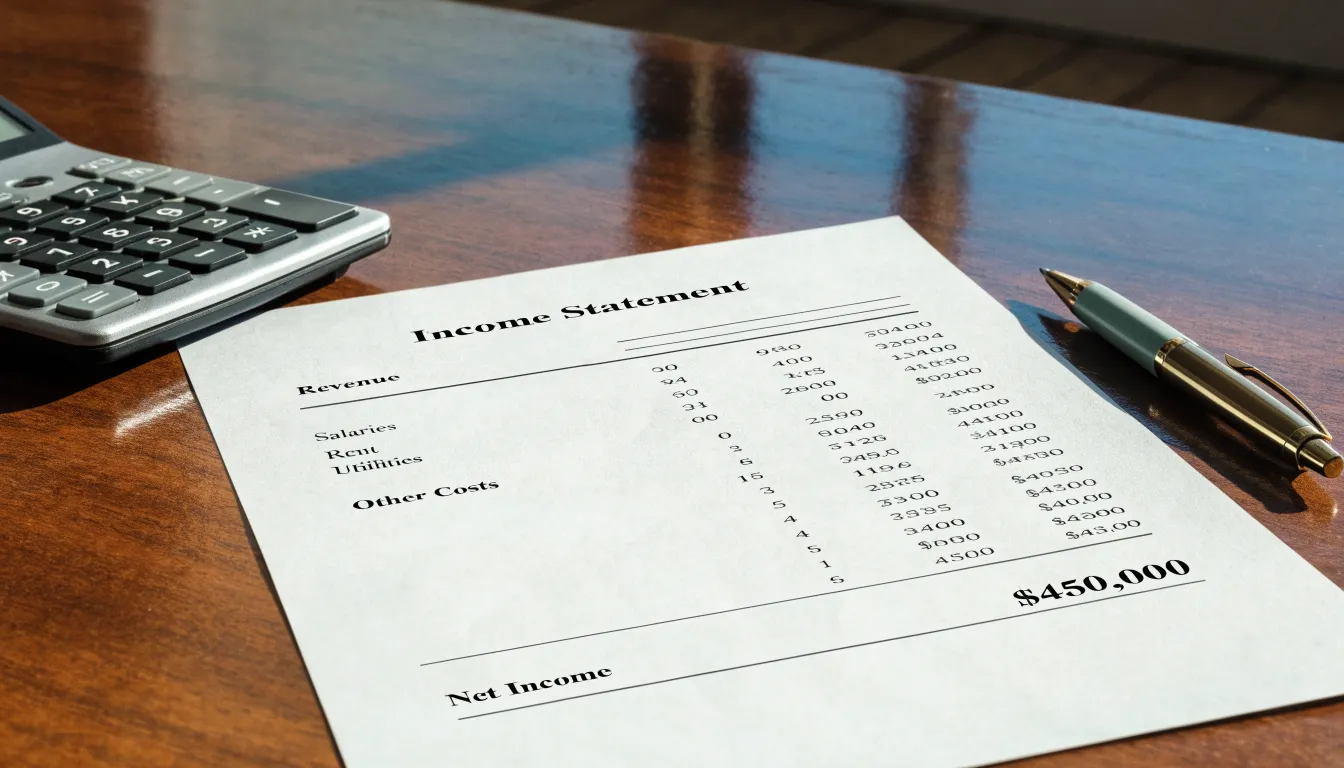
Table of Contents
- What an income statement actually tells you about business health
- Single-step versus multi-step formats explained
- The standard structure
- Understanding top line revenue and gross sales
- Cost of goods sold
- Breaking down operating expenses from rent to payroll
- How interest, taxes, and non-operating items impact your bottom line
- Walkthrough of a sample small business income statement
- Common errors to avoid when preparing your profit and loss statement
What an income statement actually tells you about business health
An income statement functions as a detailed record of how a business performed over a defined period, typically a quarter or a year. It begins with revenue, the total amount generated from selling goods or services, and then works downward through a series of deductions until it arrives at net income. Each line in that progression carries diagnostic information about the health of the enterprise. A rising revenue line signals expanding demand and market reach, while a flat or declining one invites questions about pricing, competition, or customer retention. Because the statement covers a specific window of time, comparing successive periods reveals trends that a single snapshot cannot show, such as whether growth is accelerating, plateauing, or reversing.
The expense side of the statement exposes cost structure. Separating cost of goods sold from operating expenses shows how much of each revenue dollar is consumed by direct production and how much by overhead such as salaries, rent, and marketing. A business with high fixed costs carries different risk than one with predominantly variable costs, and the income statement makes that distinction visible. Operating efficiency emerges from the relationship between these figures. When revenue grows faster than expenses, margins widen and the operation is scaling effectively; when expenses outpace revenue, the statement flags pressure that may need management attention.
Profitability sits at the heart of what the document communicates. Gross profit, operating profit, and net income each answer a different question about how well the business converts activity into earnings. Lenders examine these figures to assess whether cash flow will cover debt service. Investors look for margin trends and earnings growth as indicators of long-term value. Owners use the same numbers to judge whether pricing, procurement, and staffing decisions are producing the intended results. For all three audiences, the income statement provides a common, comparable language for evaluating whether the business is becoming stronger or weaker over time, and it supplies the evidentiary basis for decisions about lending, investment, and operational change.
Single-step versus multi-step formats explained
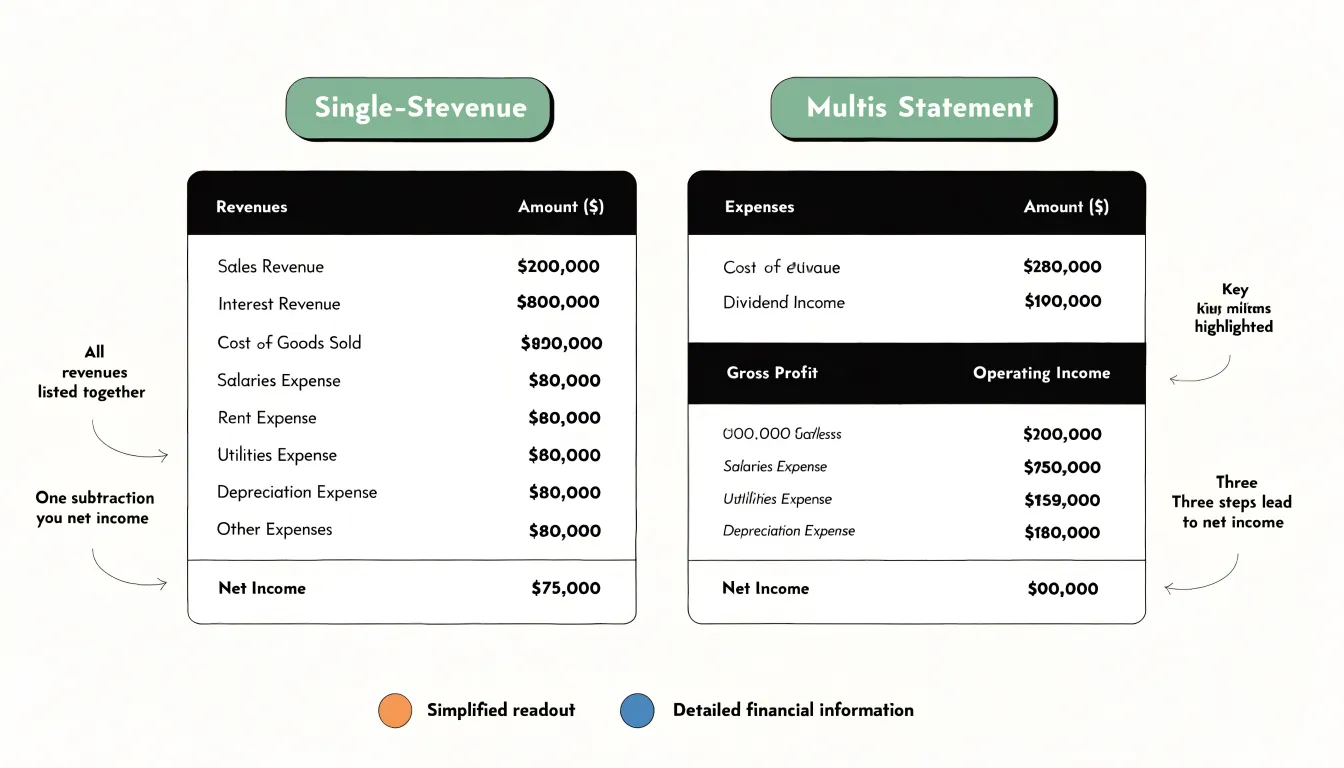
The single-step and multi-step formats represent two distinct approaches to presenting an income statement. In a single-step format, all revenues are listed together, followed by all expenses, and the difference between the two totals yields net income. This layout typically includes line items such as sales revenue, service revenue, interest income, cost of goods sold, selling expenses, administrative expenses, interest expense, and income tax expense, but it does not subtotal intermediate profit measures like gross profit or operating income. The multi-step format, by contrast, introduces a series of subtotals that separate different aspects of profitability. It begins with net sales, subtracts cost of goods sold to arrive at gross profit, then deducts operating expenses to determine operating income. From operating income, it subtracts non-operating items such as interest expense and adds non-operating revenues like interest income to arrive at income before taxes, and finally subtracts income tax expense to reach net income. This structure highlights the distinction between a company’s core operations and its financing and other activities. The choice between formats depends on the reporting context and the needs of the statement’s users. The single-step format offers simplicity and is often used by small businesses or in internal reporting where the focus is on the bottom line rather than on intermediate profit measures. It is also common in certain industries where cost of goods sold is not a meaningful concept, such as service firms. The multi-step format provides more detailed information and is preferred by publicly traded companies and larger organizations that need to comply with accounting standards and provide investors with insights into gross margin, operating performance, and the impact of non-operating items. Lenders and analysts often favor the multi-step format because it allows for ratio analysis, such as gross profit margin and operating margin, which are crucial for assessing profitability and operational efficiency. Ultimately, the selection of format should align with the purpose of the financial statements and the expectations of the audience, ensuring that the presentation enhances transparency and decision-usefulness.
The standard structure
An income statement follows a deliberate sequence that mirrors the way a business generates profit, and understanding this top-to-bottom flow makes the document far easier to read and interpret. At the very top sits the header, which identifies the business by name, states the title of the statement, and specifies the accounting period covered, whether that is a month, a quarter, or a full fiscal year. The header matters because an income statement is meaningless without knowing whose results it describes and the window of time those results reflect.
Directly below the header comes the revenue line, often labeled sales or total revenue. This figure represents the money brought in from the core activities of the business before any costs are subtracted. From revenue, the statement moves to the cost of goods sold, which captures the direct costs tied to producing or purchasing the goods and services sold during the period. Subtracting COGS from revenue produces gross profit, an intermediate subtotal that shows how much remains to cover the rest of the company’s expenses.
The next block covers operating expenses, the day-to-day costs of running the business that fall outside direct production, such as salaries, rent, marketing, insurance, and depreciation. When these are subtracted from gross profit, the statement arrives at operating income, sometimes called operating profit. This subtotal is followed by non-operating items, including interest expense and interest income, along with any gains or losses unrelated to core operations. Some statements also present a line for income tax expense at this stage.
Finally, after all revenues and expenses have been accounted for, the statement lands on net income, often labeled as the bottom line. This figure represents what the business has earned after every cost, interest payment, and tax obligation has been settled. Following this order from header to net income gives readers a logical progression from the largest top-line figure down through each layer of cost, allowing them to see exactly where money is consumed before arriving at the final profit number.
Understanding top line revenue and gross sales
The top line of an income statement begins with revenue, the total inflow of economic benefit a company generates from its primary operations during a reporting period. Revenue encompasses all sources of income from core business activities, including sales of goods, fees for services, royalties, and subscriptions. Gross sales represent the raw, aggregate dollar amount of goods or services sold before any deductions. A company that ships $2 million worth of product in a quarter records $2 million in gross sales, regardless of what happens afterward. The gap between gross sales and reported revenue emerges through three common adjustments: returns, allowances, and discounts. Sales returns occur when customers send back merchandise for a refund or credit, reducing the amount the company ultimately keeps. Allowances cover situations where goods are kept but the price is reduced, perhaps because of minor defects or shipping delays. Trade and cash discounts, such as early-payment incentives or volume pricing, further reduce the amount collected. Subtracting these three items from gross sales produces net sales, the figure most companies report as their top-line revenue. Because these deductions can be substantial in industries with high return rates, such as retail and e-commerce, analysts pay close attention to the ratio of returns and allowances to gross sales as a signal of product quality and customer satisfaction. The top line serves as the anchor for all profitability analysis because every subsequent metric flows from it. Cost of goods sold is subtracted to arrive at gross profit, operating expenses are deducted to reach operating income, and interest and taxes are removed to arrive at net income. Each of these margins is expressed as a percentage of the top line, so an error or distortion in the revenue figure cascades through every calculation. Investors compare revenue growth trends, gross margin percentages, and operating leverage against the top line to judge whether a company is scaling efficiently. A rising top line paired with stable costs suggests improving profitability, while flat revenue alongside growing expenses raises red flags. Understanding how gross sales convert into reported revenue gives readers the foundation to interpret every figure that follows on the income statement.
Cost of goods sold
Cost of goods sold represents the direct expenses tied to producing the goods a company sells or delivering the services it provides. For a product business, COGS typically includes raw materials, components, packaging, freight-in costs, and the direct labor used in manufacturing. It may also capture manufacturing overhead such as utilities for a production facility or depreciation on production equipment. For a service business, the equivalent concept centers on the direct labor and materials required to deliver the service, along with any subcontractor fees or direct supplies consumed during delivery. Costs that support the business broadly, such as marketing, administrative salaries, rent for office space, and sales commissions, generally fall outside COGS and belong in operating expenses.
The formula for gross profit is straightforward: gross profit equals revenue minus cost of goods sold. If a company generates $500,000 in revenue and carries $300,000 in COGS, its gross profit is $200,000. This figure shows how much money remains after covering the direct costs of producing what was sold, money that is available to fund operating expenses and contribute to net income.
Gross profit margin expresses that figure as a percentage of revenue. The calculation divides gross profit by revenue and multiplies by 100. Using the example above, $200,000 divided by $500,000 yields a gross profit margin of 40 percent. This means the company retains 40 cents of every revenue dollar after accounting for direct production costs.
Interpreting the margin requires context. A higher margin suggests the business can price its offerings well above direct costs, leaving room to absorb operating expenses and generate profit. A lower margin leaves less buffer and places greater pressure on volume and cost control. Margins vary widely across industries, so comparisons are most meaningful against prior periods, competitor benchmarks, or industry averages. Tracking the margin over time reveals whether production costs are rising faster than prices, whether pricing power is eroding, or whether efficiency gains are taking hold. Used consistently, gross profit margin gives managers and investors a clear window into the core economics of what a company sells.
Breaking down operating expenses from rent to payroll
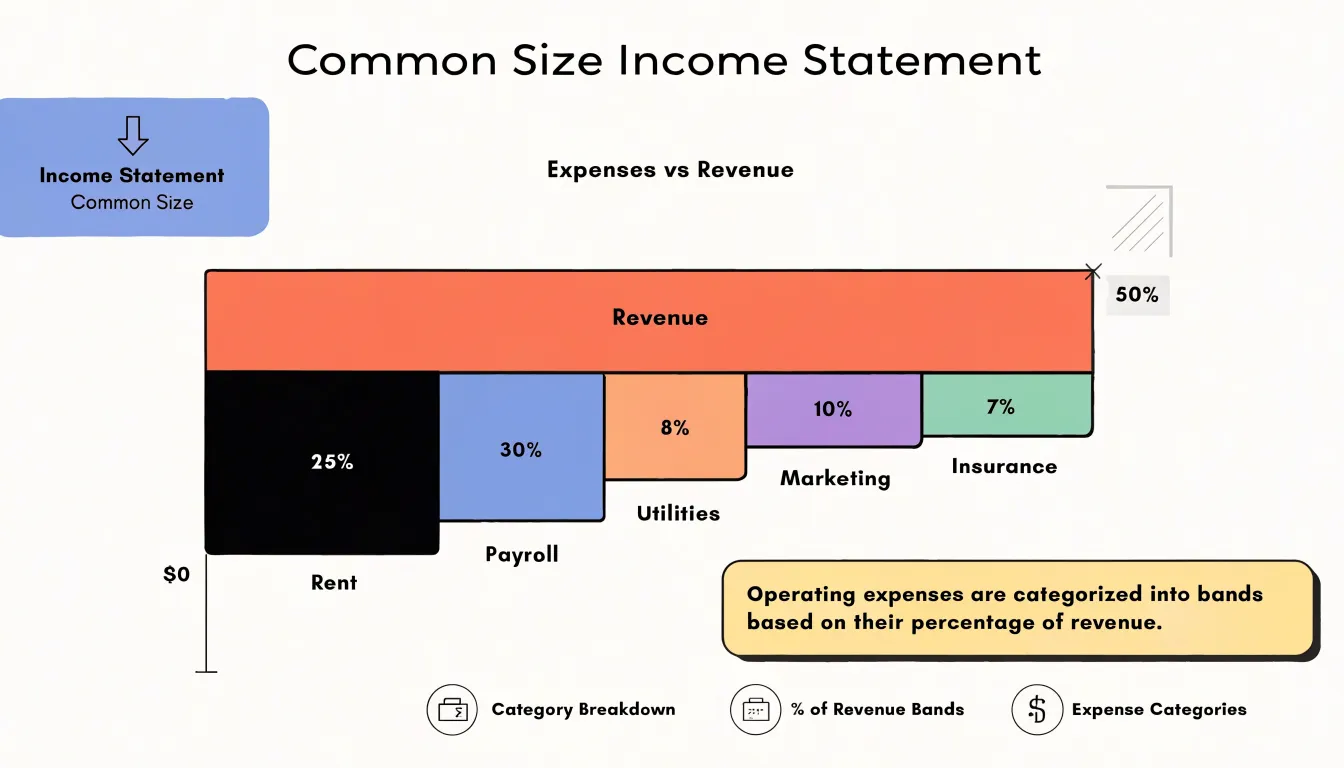
Operating expenses represent the ongoing costs a business incurs to keep its doors open and its operations running day to day. Breaking these costs into recognizable categories gives owners and analysts a clearer picture of where money actually goes. Rent or lease payments typically form one of the largest fixed obligations, particularly for retail, restaurant, and service businesses that depend on physical space. Payroll follows close behind, covering wages, salaries, overtime, and often benefits and payroll taxes; for many companies it is the single biggest line item on the income statement. Utilities capture electricity, water, heating, internet, and phone service, and they tend to fluctuate with season and production volume. Marketing expenses include advertising spend, digital campaigns, promotional events, and agency fees, and they are often treated as discretionary costs that can be scaled up or down. Insurance rounds out the core group, spanning general liability, property, workers’ compensation, and sometimes business interruption coverage.
Grouping these expenses serves more than bookkeeping convenience. Categorizing costs consistently allows a company to compare its own performance across months and years, and to benchmark against industry peers. A common analytical technique is to express each category as a percentage of revenue, often called a common-size income statement. If rent equals 8 percent of revenue this year versus 6 percent last year, the shift signals either rising lease costs or falling sales, and the percentage framing makes that visible in a way raw dollar figures can obscure. Payroll at 30 percent of revenue tells a very different story from payroll at 45 percent, and analysts use these ratios to judge whether a company is lean or top-heavy relative to competitors.
This percentage-of-revenue view also supports planning and decision-making. Owners can set targets for each category, monitor variances, and identify which costs are scaling proportionally with growth and which are outpacing it. Fixed costs like rent and insurance behave differently from variable costs like marketing, and separating them helps forecast how profit will respond to changes in sales volume. Over time, a disciplined breakdown of operating expenses turns the income statement into a practical management tool rather than a historical record.
How interest, taxes, and non-operating items impact your bottom line
The section of the income statement that follows operating income explains how a company’s core operating profit is transformed into net income, the well-known bottom line. This bridge is built from several distinct categories of items, each with its own placement and meaning. Interest expense typically appears as its own line immediately below operating income, labeled something like interest expense or interest and other financing costs. Its placement reflects that interest arises from how the business is financed rather than how it operates. Analysts often look at operating income before interest because it isolates the profitability of core operations from capital structure decisions. For a company carrying significant debt, interest expense can consume a substantial share of operating profit, so tracking its trend over time reveals how much earnings power is being directed toward lenders rather than shareholders. Some statements also show interest income on the same line, netting the two together.
Below interest comes income tax expense, usually presented as a single line computed on pre-tax income. The tax line warrants attention because the effective tax rate, the reported tax expense divided by pre-tax income, can differ meaningfully from the statutory rate due to credits, deductions, prior-year adjustments, or one-time settlements. A sudden swing in the effective rate can distort year-over-year comparisons of net income, so readers benefit from reviewing footnotes that explain unusual movements.
Non-operating items occupy their own space in this lower section as well. Gains or losses from the sale of assets or a business unit, litigation settlements, restructuring charges, write-downs of impaired assets, and gains or losses on investments all land between operating income and net income. Their placement signals that they fall outside the ordinary course of business. Because these items can be large and irregular, many readers study both net income and a version of earnings that excludes them to gauge sustainable profitability. A company might report a strong bottom line in a year when an operating loss was offset by a one-time asset sale gain. Reading the bridge line by line, from operating income through interest, taxes, and non-operating entries, gives a clearer picture of what actually drove the final result and which components are likely to recur.
Walkthrough of a sample small business income statement
A line-by-line walkthrough of a sample income statement brings the structure of the report into concrete focus. Consider a small bakery with annual figures. The statement opens with revenue, often labeled gross sales or total revenue, which for this bakery is $480,000. This figure represents all money collected from selling bread, pastries, and coffee before any costs are subtracted. Some statements then show sales returns and allowances as a deduction, arriving at net revenue, but for a simple example the gross figure serves as the starting line.
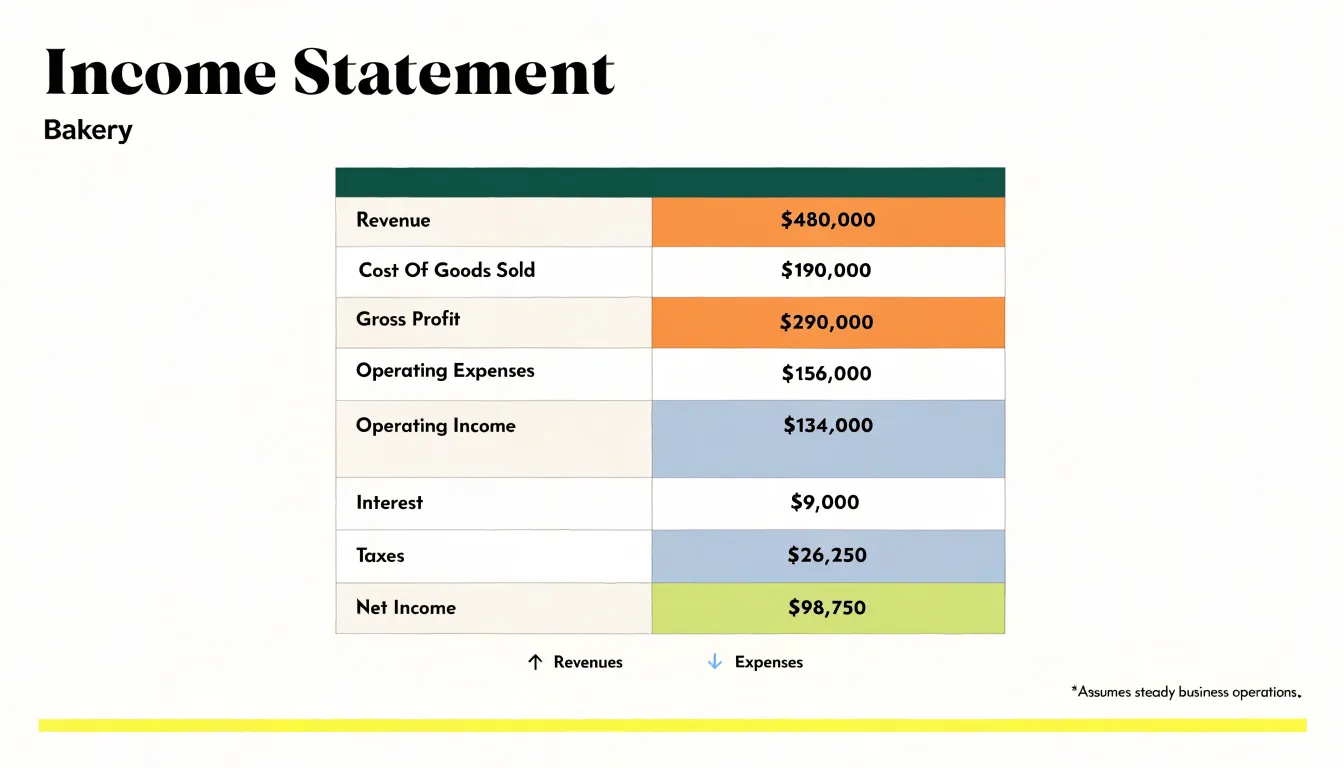
Directly beneath revenue sits cost of goods sold, or COGS. For the bakery this totals $190,000 and includes flour, butter, eggs, packaging, and the wages of the bakers who produce the goods. Subtracting COGS from revenue yields gross profit, here $290,000. Gross profit measures how much the core product contributes after its direct costs, and it is the first meaningful checkpoint in the statement.
Next comes the operating expense section, where costs are grouped by function. Selling expenses might include $18,000 for marketing and delivery. General and administrative expenses capture rent of $60,000, utilities of $14,000, insurance of $6,000, office salaries of $45,000, and professional fees of $5,000. Depreciation on the ovens and delivery van adds $8,000. Summing these gives total operating expenses of $156,000. Subtracting them from gross profit produces operating income, or EBIT, of $134,000.
Below operating income, the statement accounts for non-operating items. Interest expense on a small business loan is $9,000, leaving pre-tax income of $125,000. Income tax at an assumed 21 percent rate comes to $26,250, and the final line, net income, lands at $98,750.
Each figure tells part of the story. Revenue sets the scale, COGS reveals product-level efficiency, operating expenses show the cost of running the business, and net income captures what remains for the owner. Reading the statement top to bottom shows how a single sales dollar is consumed by costs at each stage before the residual profit emerges at the bottom.
Common errors to avoid when preparing your profit and loss statement
Preparing a profit and loss statement rewards care and consistency, and many of the problems that surface during review trace back to a handful of recurring mistakes. One of the most common is mixing cash and accrual accounting within the same statement. If revenue is recorded when invoices are issued but expenses are logged only when payments leave the bank, the resulting profit figure reflects neither method faithfully. Choose one basis, apply it to every line, and document that choice so that anyone reading the statement understands what it represents.
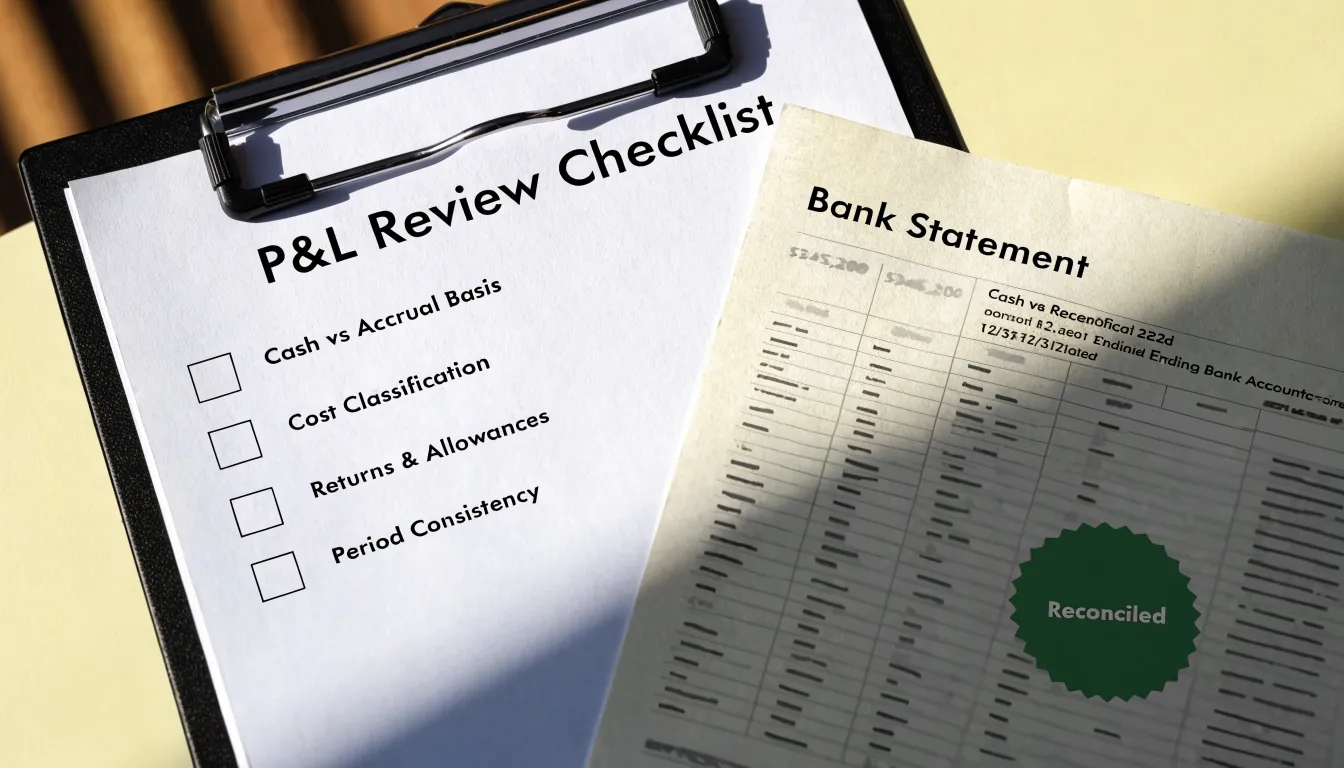
Misclassifying costs is another frequent source of distortion. Operating expenses placed in cost of goods sold will inflate gross margin while understating overhead, and the reverse error hides true direct costs. Capital purchases recorded as expenses, or payroll costs split inconsistently between categories, create the same effect. A chart of accounts with clear definitions, applied the same way each period, prevents most of this drift.
Returns, allowances, and discounts deserve explicit treatment. Omitting customer returns overstates revenue, and failing to account for supplier credits overstates expenses. Record these items in the period they occur and show them as separate lines where material, so that gross revenue and net revenue are both visible.
Inconsistent period comparisons undermine the usefulness of any statement. Comparing a five-week month to a four-week month, or a partial period to a full one, produces misleading trends. Keep period lengths uniform, align cutoff dates, and ensure that adjusting entries such as accruals and prepayments are posted before the period closes.
Accuracy improves with a short review routine. Reconcile bank and credit card accounts before finalizing the statement, tie revenue to invoicing records, and scan for unusual balances or sign errors. Compare the current statement against the prior period and investigate large variances. A checklist covering cutoffs, classifications, and reconciliations turns the profit and loss statement into a reliable document that stands up to scrutiny from managers, lenders, and auditors.
Frequently Asked Questions
What does an income statement tell you about a business?
An income statement records how a business performed over a defined period, starting with revenue and working down through deductions to net income. Comparing successive periods reveals trends such as whether growth is accelerating, plateauing, or reversing, and the statement exposes cost structure and profitability.
What is the difference between single-step and multi-step income statements?
A single-step income statement lists all revenues together, followed by all expenses, with the difference producing net income and no intermediate profit subtotals. A multi-step income statement uses subtotals such as gross profit, operating income, income before taxes, and net income, separating core operations from financing and non-operating activities.
What is included in cost of goods sold?
Cost of goods sold represents direct expenses tied to producing goods or delivering services, such as raw materials, components, packaging, freight-in costs, direct labor, and certain manufacturing overhead. Costs like marketing, administrative salaries, office rent, and sales commissions generally fall outside COGS and belong in operating expenses.
How do you calculate gross profit and gross profit margin?
Gross profit equals revenue minus cost of goods sold. Gross profit margin divides gross profit by revenue and multiplies by 100; for example, $200,000 gross profit divided by $500,000 revenue yields a 40 percent gross profit margin.
Where do interest, taxes, and non-operating items appear on an income statement?
Interest expense typically appears below operating income, followed by income tax expense computed on pre-tax income. Non-operating items such as gains or losses from asset sales, litigation settlements, restructuring charges, write-downs, and investment gains or losses also land between operating income and net income.
What common mistakes should you avoid when preparing a profit and loss statement?
Common mistakes include mixing cash and accrual accounting, misclassifying costs between operating expenses and cost of goods sold, omitting returns, allowances, and discounts, and making inconsistent period comparisons. Accuracy improves by reconciling accounts, tying revenue to invoicing records, scanning for unusual balances, and investigating large variances.