
Inventory Turnover
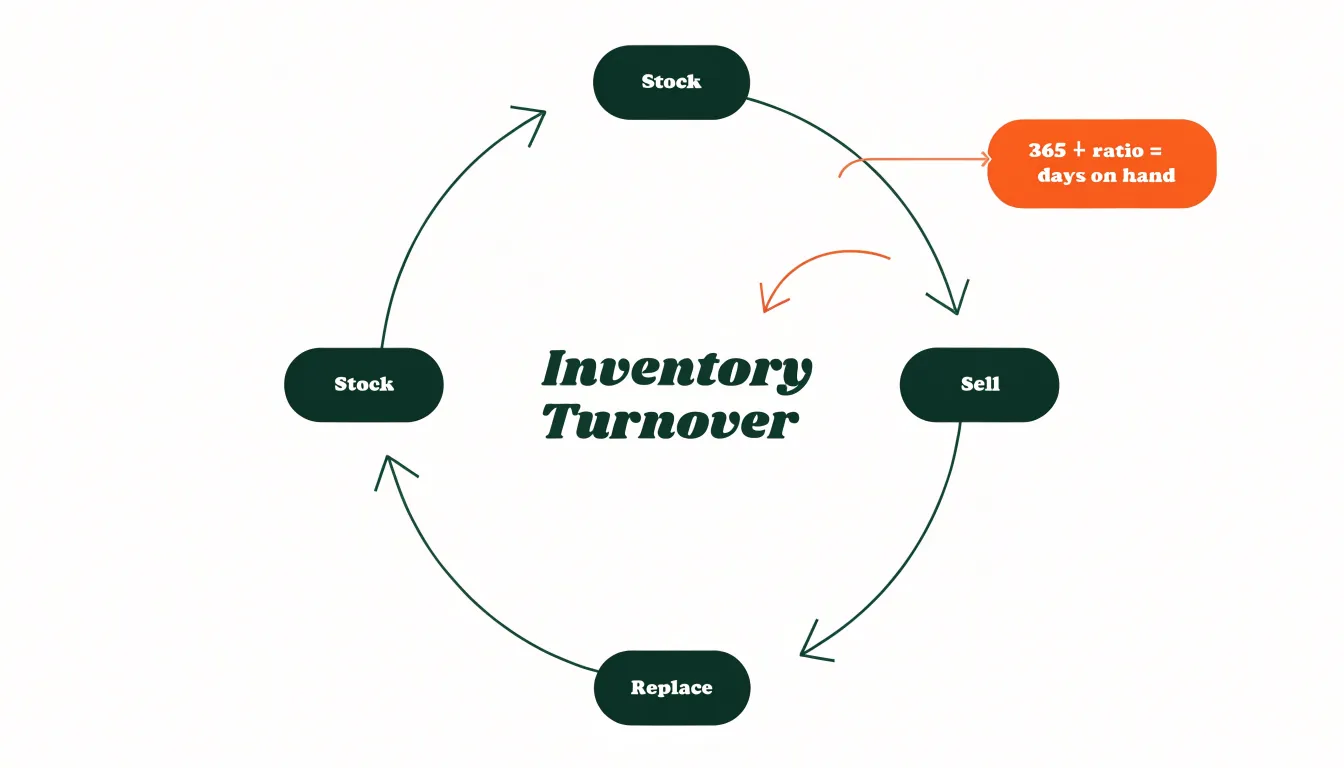
Inventory turnover is a financial ratio calculated by dividing cost of goods sold by average inventory for the same period. It shows how many times a company sells and replaces its stock, indicating operational efficiency, cash flow health, and demand alignment. Dividing 365 by the ratio converts it into days of inventory on hand.
Table of Contents
- Understanding what inventory turnover reveals about business health
- The core formula and how to measure cost of goods sold correctly
- Average inventory versus ending balance
- Step by step walkthrough of a real inventory turnover calculation
- What is a good inventory turnover ratio for your business model?
- Industry benchmarks
- The hidden cash flow danger of an inventory turnover ratio that is too high
- Practical ways to safely boost your ratio when inventory moves too slowly
Understanding what inventory turnover reveals about business health
Inventory turnover measures how many times a company sells and replaces its stock over a period. This ratio offers a window into operational efficiency by showing how quickly goods move from shelf to sale. A high turnover often suggests streamlined processes, effective marketing, and strong demand, while a low turnover can point to overstocking, weak sales, or poor inventory management. The ratio also sheds light on liquidity: inventory is a current asset, and faster turnover means cash is tied up for shorter periods, improving cash flow and reducing holding costs such as storage, insurance, and obsolescence. Demand alignment is another key signal. When turnover matches expectations, it indicates that purchasing and production plans are in sync with customer preferences. However, both high and low turnover require context. A very high turnover might indicate insufficient stock levels, leading to lost sales and dissatisfied customers, or it could reflect efficient just-in-time practices. Conversely, a low turnover may be intentional, such as stocking up for seasonal demand or taking advantage of bulk discounts, but it can also signal obsolete products or poor forecasting. Comparing turnover across periods and against industry benchmarks helps distinguish healthy efficiency from potential trouble. For instance, a retailer with turnover of 6 might be performing well in its sector, while a manufacturer with turnover of 3 could be normal given longer production cycles. Businesses should also examine turnover by product category to identify slow-moving items and adjust strategies accordingly. Ultimately, inventory turnover is a versatile metric that, when analyzed thoughtfully, reveals much about a company’s operational agility, financial health, and responsiveness to market demand.
The core formula and how to measure cost of goods sold correctly
Inventory turnover is calculated by dividing cost of goods sold by average inventory for the same period. Cost of goods sold represents the direct costs attributable to the production or acquisition of the goods a business sells, while average inventory is typically the sum of beginning and ending inventory divided by two. The result tells you how many times a company cycles through its stock during the period, and dividing 365 by that figure converts it into days of inventory on hand. The formula itself is simple; the difficulty lies in sourcing clean, consistent inputs, and COGS is where most measurement errors creep in.
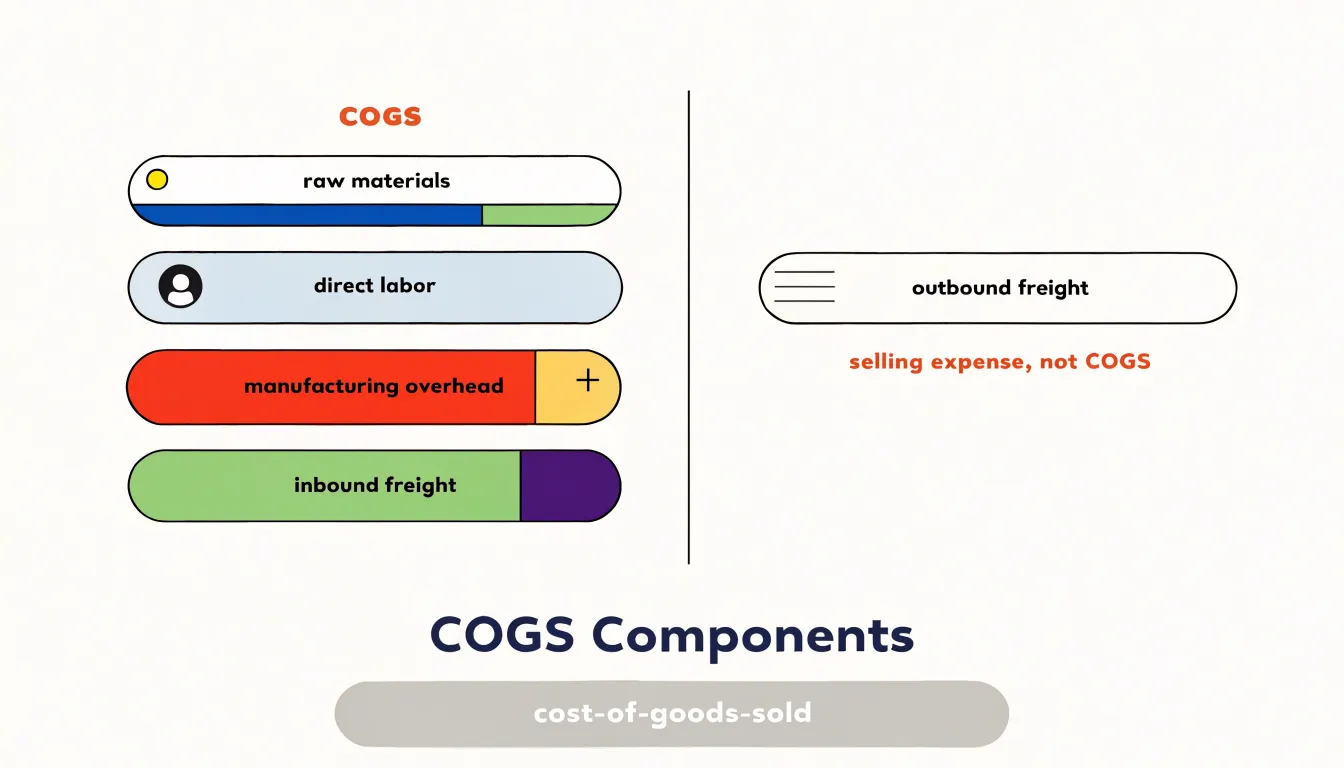
COGS should capture every cost directly tied to bringing goods to a saleable state. That includes the purchase price of raw materials and finished goods, direct labor used in production, and manufacturing overhead such as factory utilities, depreciation on production equipment, and indirect production labor. A common pitfall is leaving overhead out entirely, which understates COGS, inflates gross margin, and makes turnover appear healthier than it is. Freight is another frequent point of confusion. Inbound freight on purchased goods is a legitimate component of COGS because it is part of getting inventory ready for sale, while outbound freight to customers is a selling expense and belongs elsewhere. Mixing the two distorts both the cost base and the turnover ratio.
Consistency across periods matters as much as completeness within a single period. If one year’s COGS includes inbound freight and the next year’s does not, the turnover comparison becomes meaningless. The same applies to overhead allocations: changing how fixed costs are spread across products shifts the ratio without any real change in operational efficiency. Businesses using standard costing should also account for variances, since unreconciled standards can drift from actual costs.
Finally, COGS and inventory must cover the same accounting period and the same scope of products. Averaging inventory over more frequent snapshots, such as monthly balances, produces a more representative figure than a simple two-point average when stock levels swing seasonally. Getting these details right turns a straightforward ratio into a reliable signal of how efficiently capital tied up in stock is being converted into sales.
Average inventory versus ending balance
Inventory turnover measures how many times a company sells and replaces its stock over a period, and the result depends entirely on the denominator chosen. The formula divides cost of goods sold by an inventory figure, and that inventory figure can be captured in more than one way. Using average inventory, calculated as beginning inventory plus ending inventory divided by two, smooths out the fluctuations that occur as stock rises and falls across the period. A retailer that builds up stock ahead of a holiday season and then draws it down afterward may show a very low ending balance in January, which inflates turnover when used alone. Averaging the beginning and ending points captures both the buildup and the sell-through, producing a ratio that reflects the actual rhythm of buying and selling during the year. This approach is especially valuable for businesses with seasonal demand, lumpy purchasing cycles, or rapid growth, where a single point-in-time figure can distort the picture in either direction.
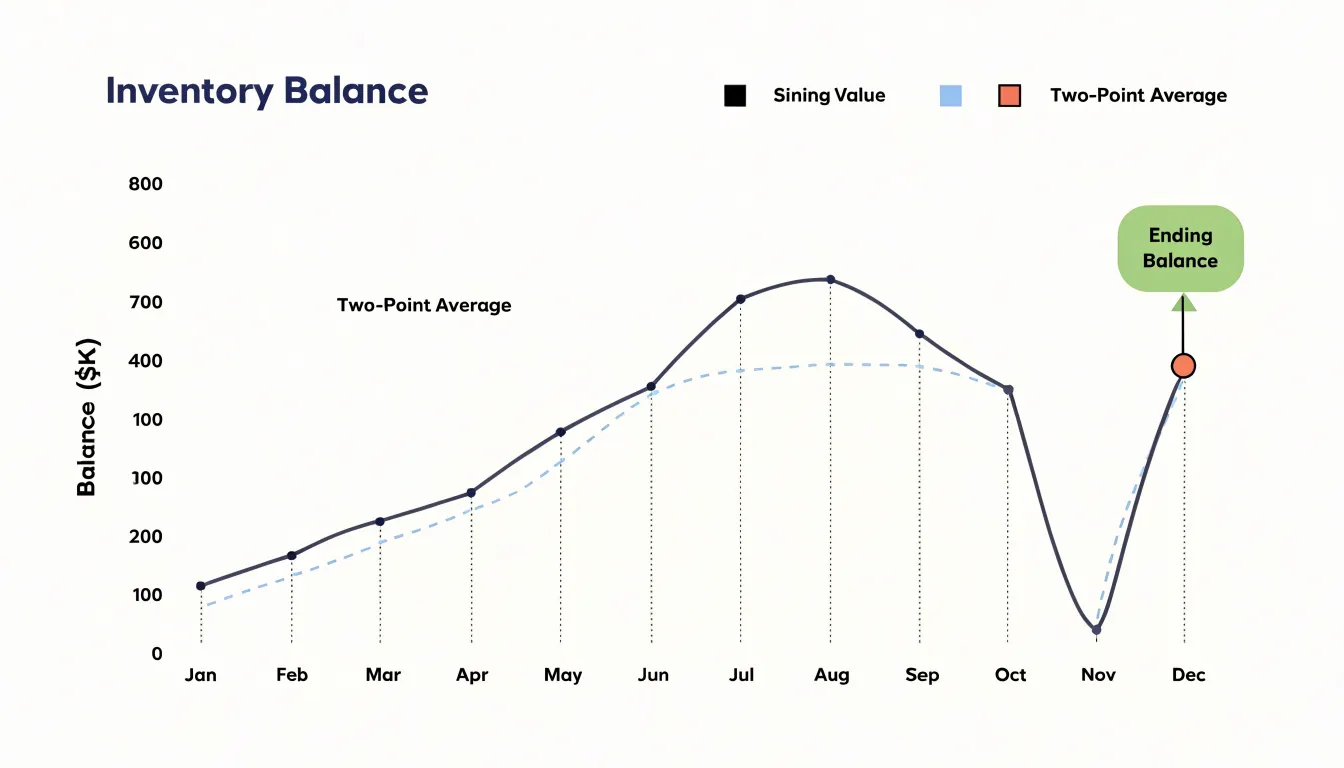
Ending inventory still has legitimate uses. It is simple to obtain, it aligns with the balance sheet date that investors and lenders review, and it can be appropriate for companies with stable inventory levels where beginning and ending balances differ only slightly. In those cases, the averaging step changes the result little, and the ending balance offers a quick, transparent snapshot. Ending inventory also suits internal comparisons across periods when the same convention is applied consistently, since the distortion, if any, is consistent.
For external analysis and benchmarking, average inventory generally provides the fairer comparison. A company whose fiscal year ends just after a major clearance sale will look far more efficient than an identical competitor whose year ends mid-season. Averaging reduces this timing effect and lets analysts compare turnover across firms with different fiscal calendars. Where more granular data exists, such as monthly or quarterly balances, a more refined average using all interim points gives an even better denominator. Whichever convention is chosen, the key discipline is consistency and disclosure, so that readers understand which inventory base produced the ratio and can adjust when comparing across companies.
Step by step walkthrough of a real inventory turnover calculation
To make the inventory turnover formula concrete, consider a fictional outdoor equipment retailer called Trailhead Supply. Suppose the company’s annual income statement reports a cost of goods sold of $1,200,000 for the most recent fiscal year. On the balance sheet, inventory at the start of the year was $180,000 and inventory at the end of the year was $220,000. These three figures are everything needed for the calculation.
The first step is to compute average inventory, since the turnover ratio compares a flow (COGS over the year) against a stock (inventory at a point in time). Adding the beginning and ending balances gives $400,000, and dividing by two yields an average inventory of $200,000. Using the average smooths out seasonal swings, which matters for a retailer that may stock up heavily before spring and summer camping season.
The second step is to divide COGS by average inventory. Here, $1,200,000 divided by $200,000 equals 6.0. Trailhead Supply turned over its inventory six times during the year. In other words, the company sold and replaced its entire stock of goods roughly six times over twelve months.
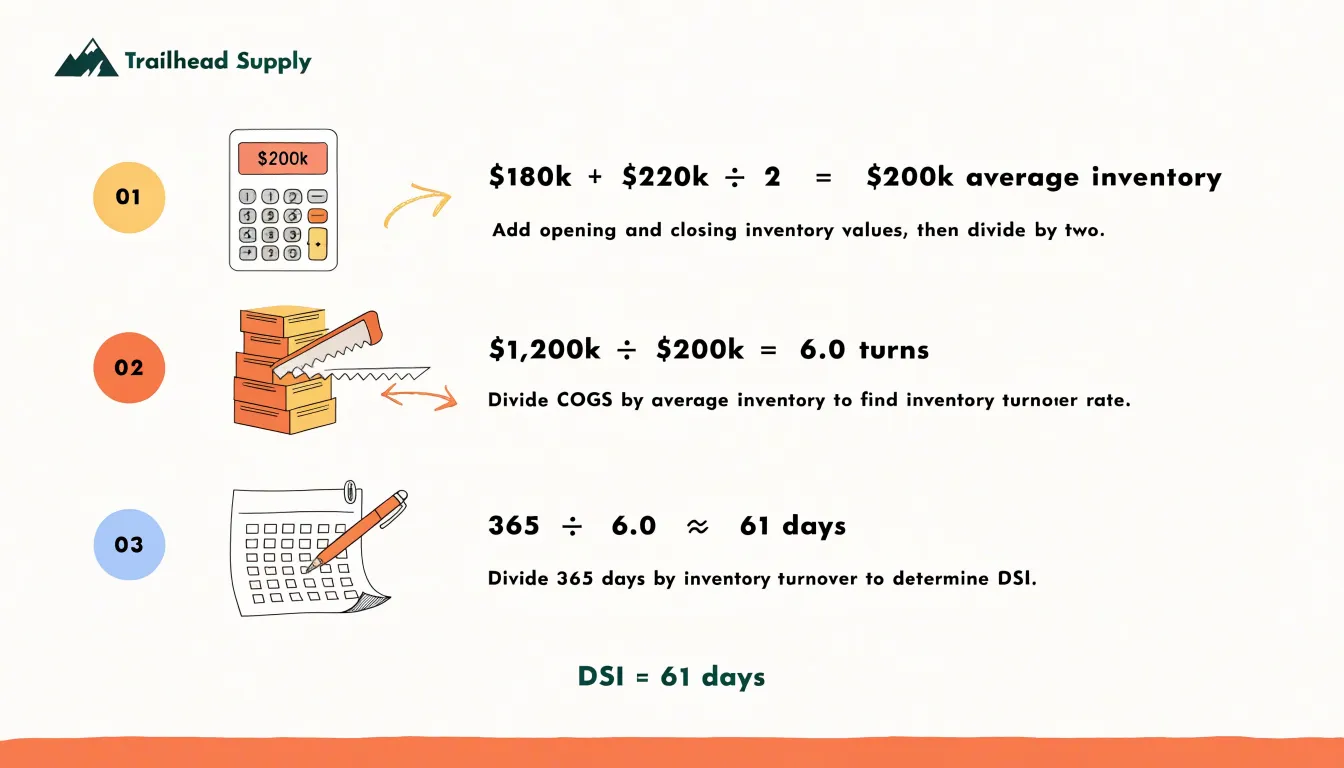
The third step converts that ratio into a more intuitive measure: days in inventory, also called days sales of inventory. Dividing 365 by 6.0 gives approximately 60.8 days. On average, merchandise sat on Trailhead’s shelves for about 61 days before being sold. This figure is often easier for managers to act on, because it maps directly onto purchasing and replenishment cycles.
Interpreting the result requires context. A turnover of 6.0 means the company is not sitting on stale stock for months, but it also suggests room to improve if competitors turn eight or nine times per year. A very high ratio could signal lean stocking that risks stockouts during peak demand, while a very low ratio could point to overbuying, weak sales, or obsolete items accumulating in the warehouse. Comparing the ratio across several years, against industry benchmarks, and alongside gross margin trends gives a fuller picture. If margins are holding steady while turnover rises, the company is likely becoming more efficient; if turnover rises while margins fall, deep discounting may be masking slower-moving inventory. Running this calculation quarterly helps managers spot deterioration early, before excess stock ties up too much working capital.
What is a good inventory turnover ratio for your business model?
A good inventory turnover ratio depends heavily on the business model, so the most useful starting point is the range that companies in your specific industry typically achieve. Grocery retailers, for example, often turn inventory 10 to 15 times per year or more, because food spoils quickly and customers expect fresh stock on every visit. Apparel retailers tend to land somewhere between 4 and 6 turns annually, balancing seasonal collections against markdown risk. Manufacturers of durable industrial equipment may see ratios closer to 2 or 3, since large, expensive items sit in inventory longer while awaiting orders or assembly. High-end jewelry or luxury goods sellers might see ratios below 2, reflecting long holding periods and high per-unit value. Comparing your ratio against these industry benchmarks tells you whether your operation is broadly in line with peers or whether something in purchasing, production, or sales needs attention.
Product perishability shapes the target further within any industry. Perishable goods demand a high turnover target because unsold inventory becomes worthless quickly, and spoilage costs compound with every day of delay. A bakery or fresh-produce distributor should aim for faster turns than a seller of canned goods operating in the same broad retail category. Shelf life effectively sets a floor: if a product expires in two weeks, the target ratio should ensure inventory clears well before that window closes.
The sales cycle also plays a role. Businesses with short, repeat purchase cycles, such as convenience stores, can sustain higher targets because cash converts back into inventory rapidly. Businesses with long sales cycles, such as custom furniture makers or industrial parts suppliers, reasonably carry lower targets because each sale involves negotiation, production lead time, or project-based purchasing. In those cases, a low ratio reflects the nature of the transactions rather than poor management.
To set a target, combine these inputs: start with the industry benchmark, adjust downward for long sales cycles or high-value items, and adjust upward for perishability or thin margins. Review the target quarterly against actual performance, and treat significant deviations in either direction as a signal to investigate demand forecasting, supplier terms, or obsolescence risk.
Industry benchmarks
Inventory turnover benchmarks vary dramatically from one sector to the next, and understanding why helps businesses set realistic targets. Grocery stores routinely post turnover ratios of 12 to 15 or higher, because perishable goods must move quickly and margins are thin. A supermarket selling milk, produce, and bread cannot afford to sit on stock; spoilage erodes profit directly, so the entire operating model is built around rapid replenishment. Apparel retailers typically land somewhere between 4 and 6 turns per year. Fashion cycles, seasonal collections, and the need to hold a range of sizes and colors mean boutiques naturally carry stock longer, and markdown strategies absorb the slower movement. Electronics retailers often fall in the 5 to 8 range, shaped by product lifecycles, launch windows, and the risk of obsolescence when newer models arrive. These differences reflect structural realities rather than differences in management skill.
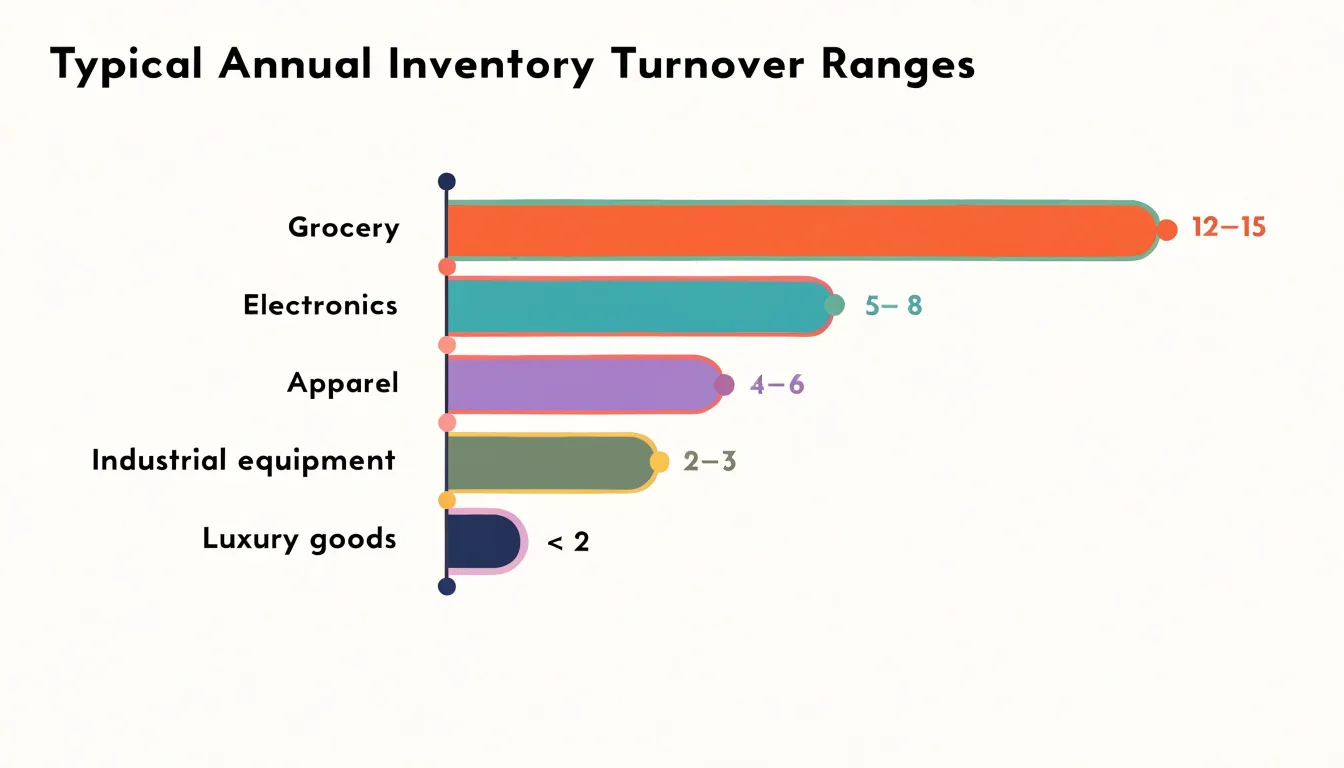
Several forces explain the gap between sectors. Product perishability is the most obvious: goods with short shelf lives demand fast turnover by necessity. Margin structure matters too, since low-margin grocery operations depend on volume and rapid cash conversion, while higher-margin apparel can absorb slower cycles. Assortment breadth also plays a role, because stores offering wide size and color ranges must hold more stock per item to satisfy customer choice. Supply chain lead times, seasonality, and the cost of holding inventory relative to its value all push benchmarks in different directions.
For a business setting turnover goals, sector benchmarks offer a useful reference point rather than a rigid rule. Comparing performance to peers in the same category reveals whether operations are lagging, while internal comparisons across periods show whether improvements are taking hold. A boutique judging itself against grocery numbers would set an impossible target, just as a grocer benchmarking against fashion retail would miss the urgency of fast-moving stock. The sensible approach combines sector context with the company’s own margin profile, product characteristics, and customer expectations, using benchmarks as a compass rather than a cage.
The hidden cash flow danger of an inventory turnover ratio that is too high
A very high inventory turnover ratio is often celebrated as a sign of operational efficiency, but it can conceal serious cash flow risks. When turnover becomes excessively high, it frequently indicates that inventory levels are too lean, leaving little buffer against demand fluctuations. This can lead to stockouts, where popular items are unavailable just as customers want them. The immediate consequence is lost sales revenue, but the damage extends further: customers may turn to competitors and, if stockouts recur, may permanently change their buying habits. The resulting decline in future sales can erode cash inflows for months or years, undermining the very cash flow that high turnover was supposed to support.
Beyond lost sales, excessively high turnover can strain supplier relationships. To maintain such high turnover, a company may place frequent, small orders or demand rapid replenishment. Suppliers facing volatile order patterns may struggle to plan production efficiently, leading to higher costs that are passed back to the buyer. In some cases, suppliers may deprioritize the company’s orders or demand less favorable payment terms, such as cash on delivery. These changes tie up cash sooner and reduce the flexibility a business needs to manage its working capital.
Operationally, high turnover often forces rushed ordering and expedited shipping. Emergency purchases typically come at a premium, and expedited freight adds direct costs that drain cash. Additionally, the constant scramble to replenish stock can lead to errors in order quantities and mix, resulting in overstock of some items and understock of others. The overstock then ties up cash in slow-moving inventory, while the understock contributes to further stockouts. This cycle can create a paradox: high turnover on average masks pockets of excess inventory that quietly consume cash.
Finally, an excessively high turnover ratio may signal that a company is relying on just-in-time inventory without adequate safety stock. In stable environments this can work, but when disruptions occur—such as supplier delays, transportation issues, or sudden demand spikes—the lack of buffer becomes critical. The company may be forced to buy inventory at spot prices or lose sales entirely, both of which harm cash flow. Thus, while a high turnover ratio appears efficient on paper, it can hide vulnerabilities that threaten both operational stability and financial health.
Practical ways to safely boost your ratio when inventory moves too slowly
A sluggish inventory turnover ratio ties up cash and signals inefficiency. To improve it without risking stockouts, focus on these practical strategies. Demand forecasting uses historical sales data and market trends to predict future demand, enabling you to adjust order quantities and timing. By investing in forecasting tools or software, you can reduce excess inventory and avoid overstocking slow-moving items. SKU rationalization involves analyzing your product portfolio to identify underperforming SKUs. Discontinue or reduce stock of items with low turnover, and reallocate resources to high-demand products. This simplifies inventory management and frees up capital. Just-in-time (JIT) ordering minimizes inventory holding costs by ordering goods only as needed. This approach requires reliable supplier relationships and accurate demand forecasting to prevent stockouts. Implementing JIT can significantly boost turnover by reducing average inventory levels. Clearance tactics such as discounts, bundling, or promotions help move obsolete or slow-selling stock quickly. These methods generate immediate cash flow and clear space for faster-moving items. When applying these strategies, monitor inventory levels closely to avoid stockouts. Set safety stock levels for critical items and use real-time tracking systems. Regularly review turnover ratios to assess the impact of your efforts. By combining these approaches, you can safely increase inventory turnover, improve cash flow, and maintain customer satisfaction.
Frequently Asked Questions
How do you calculate inventory turnover?
Inventory turnover is calculated by dividing cost of goods sold by average inventory for the same period. Average inventory is typically beginning inventory plus ending inventory divided by two, and dividing 365 by the turnover ratio converts it into days of inventory on hand.
What is considered a good inventory turnover ratio?
A good inventory turnover ratio depends heavily on the business model and industry. The article gives examples such as grocery retailers often turning inventory 10 to 15 times per year or more, apparel retailers around 4 to 6 turns annually, durable industrial equipment manufacturers closer to 2 or 3, and high-end jewelry or luxury goods sellers below 2. Sector benchmarks are a useful reference point rather than a rigid rule.
Should I use average inventory or ending inventory to calculate inventory turnover?
Average inventory smooths out fluctuations across the period and is generally fairer for external analysis and benchmarking. Ending inventory is simple to obtain, aligns with the balance sheet date, and can be appropriate for companies with stable inventory levels. Whichever convention is chosen, the key discipline is consistency and disclosure.
What should be included in cost of goods sold for inventory turnover?
COGS should include every cost directly tied to bringing goods to a saleable state, such as the purchase price of raw materials and finished goods, direct labor, and manufacturing overhead. Inbound freight on purchased goods is a legitimate component of COGS, while outbound freight to customers is a selling expense and belongs elsewhere. COGS should also be consistent across periods.
Can a high inventory turnover ratio ever be a problem?
Yes. A very high turnover ratio can indicate inventory levels are too lean, leading to stockouts, lost sales, and customers turning to competitors. It can also strain supplier relationships, force rushed ordering and expedited shipping, and signal reliance on just-in-time inventory without adequate safety stock.
How can I improve a low inventory turnover ratio?
Practical strategies include demand forecasting, SKU rationalization, just-in-time ordering, and clearance tactics such as discounts, bundling, or promotions. When applying these strategies, monitor inventory levels closely, set safety stock levels for critical items, use real-time tracking systems, and regularly review turnover ratios.