
Net Profit Margin
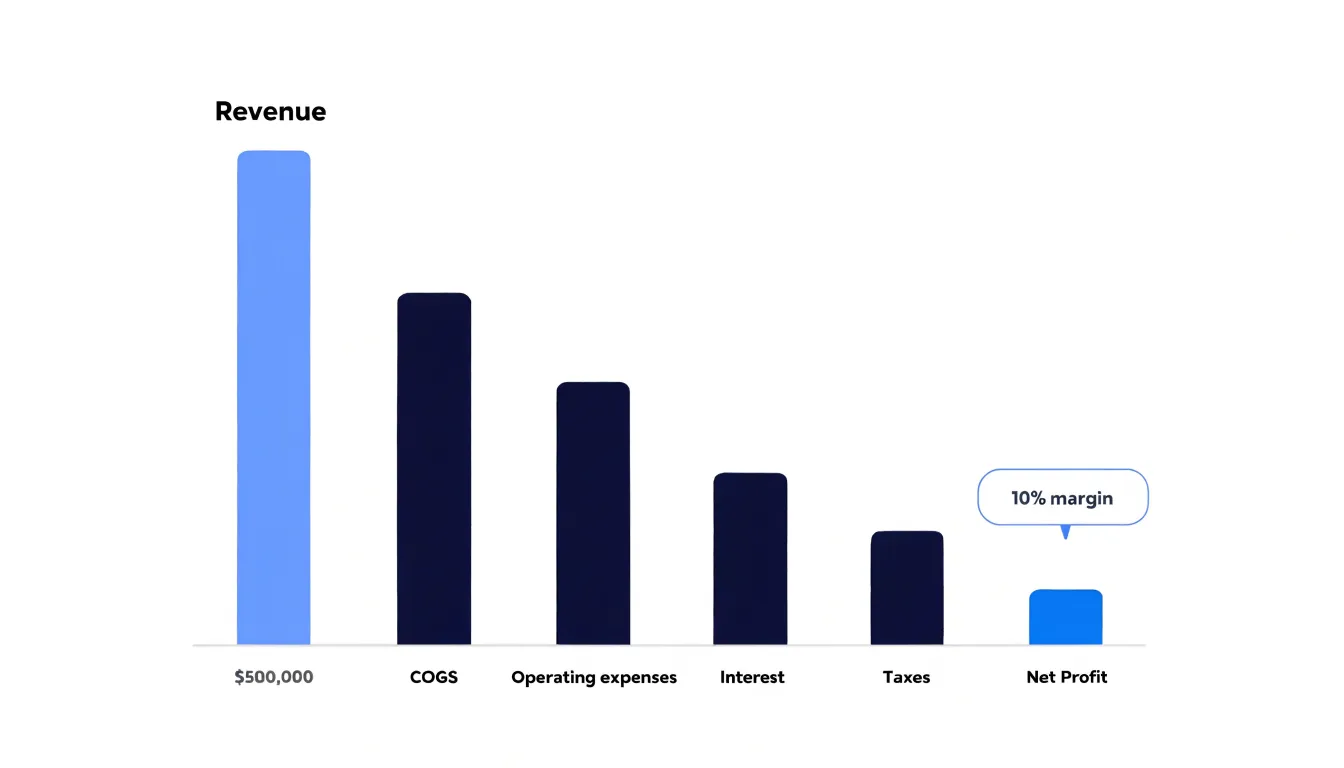
Net profit margin is the percentage of revenue a business keeps after all expenses—cost of goods sold, operating costs, interest, and taxes—are subtracted. It is calculated as (Net Profit ÷ Revenue) × 100, so a company earning $50,000 on $500,000 in revenue has a 10% net profit margin.
Table of Contents
- What Net Profit Margin Measures in Your Business
- The Basic Net Profit Margin Formula Explained
- Step by Step
- Gross Margin versus Net Margin
- Average Net Profit Margins Across Major Industries
- Why Retail and Restaurant Margins Are Naturally Low
- High Margin Sectors
- How to Tell If Your Net Profit Margin Is Healthy
- Practical Strategies to Expand Your Bottom Line Margins
What Net Profit Margin Measures in Your Business
Net profit margin measures the percentage of revenue that remains after every expense has been accounted for, including the cost of goods sold, operating expenses, interest, taxes, and any other charges the business incurs. To calculate it, you divide net profit by total revenue and multiply by one hundred. If a company earns $500,000 in revenue and retains $50,000 after all costs, its net profit margin is 10 percent. That single figure captures the cumulative effect of every pricing decision, cost control effort, and financing choice made during the period. It answers a direct question: for every dollar of sales brought in, how much actually stays with the business? The answer reflects overall profitability in the clearest terms available, since it sits at the very bottom of the income statement and incorporates all the layers of expense above it. A business can post strong gross margins and still show a thin net margin if operating costs, debt servicing, or taxes consume the difference. Watching this metric over time reveals whether profitability is improving or eroding, and comparing it against industry benchmarks shows how well the company converts sales into retained earnings relative to peers. The metric also speaks to operational efficiency. A rising net profit margin suggests the business is managing its cost structure effectively, negotiating better terms with suppliers, or achieving economies of scale as revenue grows. A declining margin, even amid rising sales, can signal that expenses are outpacing growth or that pricing power is weakening. Because it accounts for interest and taxes, net profit margin gives lenders and investors a realistic view of what the business actually keeps. It serves as a foundation for evaluating whether current operations generate enough surplus to fund reinvestment, repay debt, or distribute returns to owners, making it one of the most telling indicators of a company’s financial health.
The Basic Net Profit Margin Formula Explained
Net profit margin expresses a company’s bottom-line profitability as a percentage of its revenue, and the formula for calculating it is straightforward: (Net Profit ÷ Revenue) × 100. Each element of this formula carries specific meaning. Revenue, often called the top line or net sales, is the total amount a business brings in from selling goods or services during a given period, after deducting returns, allowances, and discounts. It represents the starting point of the income statement. Net profit, sometimes called net income or the bottom line, is what remains after every expense has been subtracted from revenue, including the cost of goods sold, operating expenses such as salaries and rent, interest on debt, depreciation, and taxes. Dividing net profit by revenue produces a decimal ratio showing how many cents of profit the company keeps for each dollar of sales, and multiplying by 100 converts that ratio into a percentage that is easy to interpret and compare.
A simple example illustrates how the formula works in practice. Suppose a company reports revenue of $500,000 for the year. After accounting for all costs, expenses, interest, and taxes, its net profit comes to $50,000. Plugging these figures into the formula gives ($50,000 ÷ $500,000) × 100, which equals 0.10 × 100, or 10%. This result means the company retains ten cents of net profit for every dollar of revenue it generates. The remaining ninety cents covers the various costs and obligations incurred in producing and selling its goods or services.
The percentage format makes the metric especially useful because it normalizes profitability across companies of different sizes and across different periods for the same company. A firm with $5 million in revenue and $500,000 in net profit also has a 10% net profit margin, just like the smaller example above, allowing for a meaningful comparison of profitability regardless of scale. Presenting the result as a percentage also makes it easy to track trends over time, since an increase from 8% to 10% signals improving bottom-line efficiency in a way that raw dollar figures alone might obscure. Understanding each component of the formula provides the foundation for interpreting what the resulting percentage reveals about a company’s overall financial health.
Step by Step
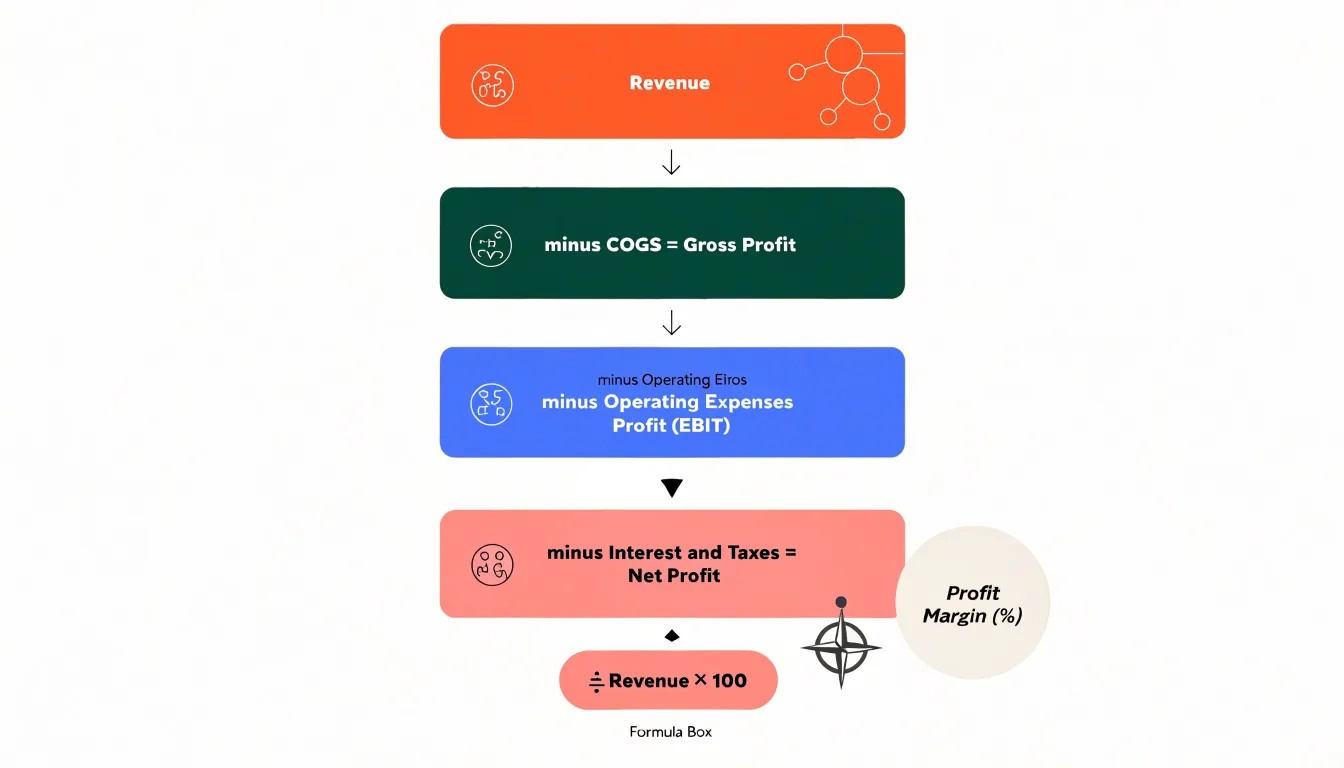
Calculating net profit margin begins with a clear, step-by-step process. Start by determining your total revenue for a specific period, such as a month, quarter, or year. This figure represents all income generated from sales of goods or services before any deductions. Next, subtract the cost of goods sold (COGS), which includes direct costs like materials and labor used to produce your products. The result is your gross profit. From gross profit, deduct operating expenses—these are the ongoing costs of running the business, such as rent, utilities, salaries, and marketing. What remains is your operating profit (EBIT). Then, subtract interest expenses on debt and any taxes owed. The final number is your net profit, also known as net income. To find the net profit margin, divide net profit by total revenue and multiply by 100 to express it as a percentage. For example, if revenue is $500,000 and net profit is $50,000, the net margin is 10%.
Accuracy hinges on consistency. A common pitfall is using mismatched time periods: revenue recorded for a full year while expenses reflect only nine months, or including a one-time tax refund in a quarter that doesn’t correspond to the revenue. Always align the time frame for all components—revenue, COGS, operating expenses, interest, and taxes—to the same period. Another pitfall is misclassifying costs: for instance, treating a capital expenditure as an operating expense, which understates net profit in the current period. Similarly, failing to account for accrued expenses or deferred revenue can distort the ratio. Double-check that all relevant costs are included; omitting interest or taxes yields a misleadingly high margin. Finally, be cautious with negative net profit: the formula still applies, but the result will be a negative percentage, indicating a loss. By following these steps carefully and avoiding these common errors, you can trust your net margin calculation as a reliable measure of profitability.
Gross Margin versus Net Margin
Gross margin and net margin measure profitability at two distinct stages of the income statement, and understanding what each one captures is essential for reading a company’s financial health accurately. Gross margin is calculated by subtracting cost of goods sold from revenue and dividing the result by revenue. COGS covers the direct costs tied to producing or acquiring what a company sells: raw materials, manufacturing labor, freight, and similar line items. Because it stops at that point, gross margin isolates the efficiency of the core production or purchasing process. A company with a strong gross margin is generating a healthy spread between what it charges customers and what it pays to deliver the product itself.
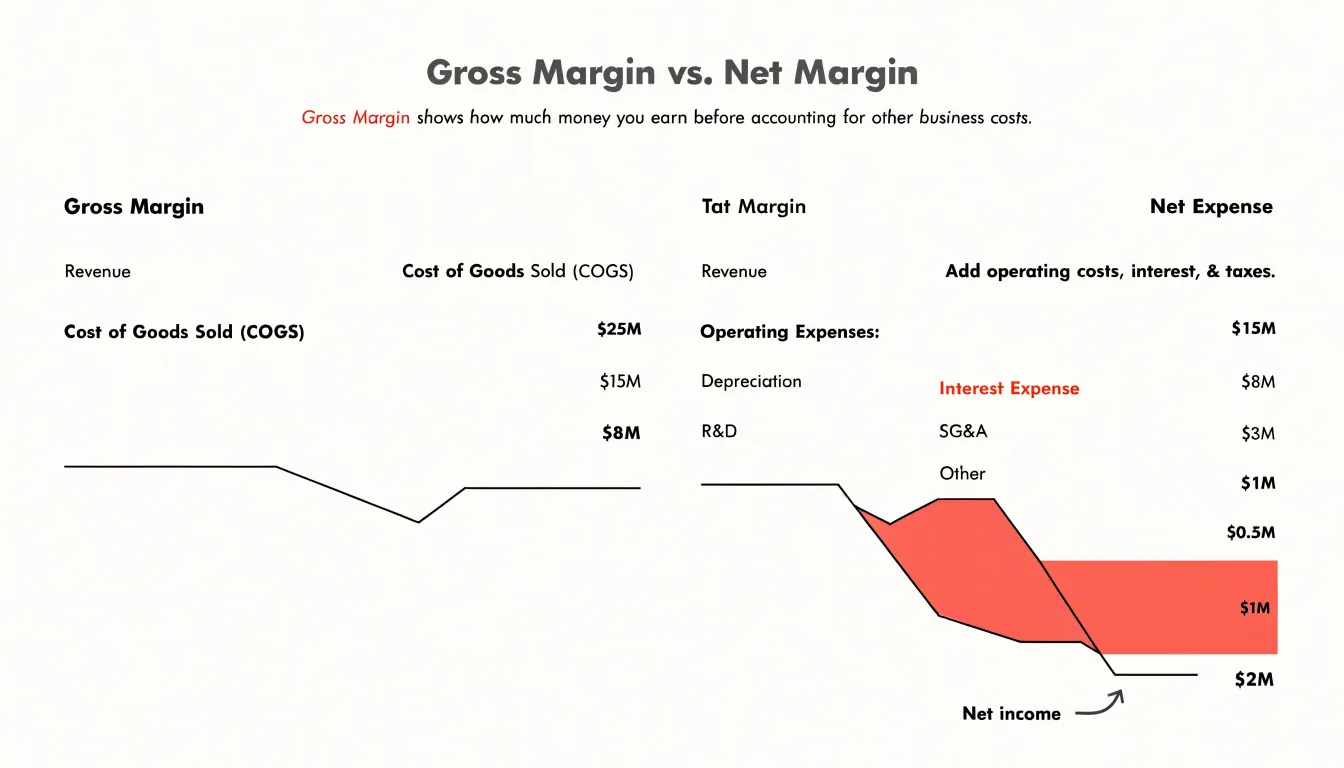
Net margin goes considerably further down the statement. Starting from the same revenue figure, it accounts for every expense the business incurs: operating costs such as sales and marketing, research and development, and administrative overhead; interest on debt; taxes; and any one-time charges or gains. The result is the percentage of each revenue dollar that survives all the way to the bottom line as net income. Net margin therefore reflects the combined effect of pricing, production efficiency, operating discipline, financing decisions, and tax management.
The diagnostic value comes from comparing the two figures side by side. A wide gap between gross and net margin points to heavy burdens below the gross profit line, whether that means bloated operating expenses, costly debt servicing, or an unfavorable tax position. A narrow gap suggests the company runs lean once production costs are covered. Tracking both margins over several periods reveals where erosion is occurring: if gross margin holds steady while net margin slips, the pressure is coming from operating or financing costs rather than from production. If gross margin itself is falling, the problem sits in COGS, pricing power, or input costs. Used together, the two metrics give analysts and managers a clear map of exactly which layer of the business is consuming profitability and where corrective attention should be directed.
Average Net Profit Margins Across Major Industries
Net profit margins differ substantially from one industry to the next, and understanding these typical ranges gives analysts and business owners a useful frame of reference when evaluating financial performance. In retail, margins tend to be thin because the business model depends on high transaction volumes and price competition. Grocery and discount retailers often operate in the low single digits, commonly between 1% and 4%, while specialty retailers with stronger brand positioning or higher-margin merchandise may reach the mid to high single digits. Department stores and general merchandise chains typically fall somewhere in the 2% to 6% range.
Manufacturing companies generally sit in a middle band. Capital-intensive producers carrying significant equipment, inventory, and labor costs often land between 5% and 10%, with variation driven by input costs, automation levels, and pricing power. Producers of specialized or technically complex goods frequently outperform commodity manufacturers, sometimes reaching the low to mid teens.
Software and other technology businesses represent the high end of the spectrum. Once development costs are absorbed, the marginal cost of delivering a digital product is small, which allows established software firms to achieve net margins of 15% to 25% or more. Subscription-based models with recurring revenue and strong customer retention can push margins toward the upper end of that range, though younger or fast-growing software companies may report lower margins as they reinvest in sales and product development.
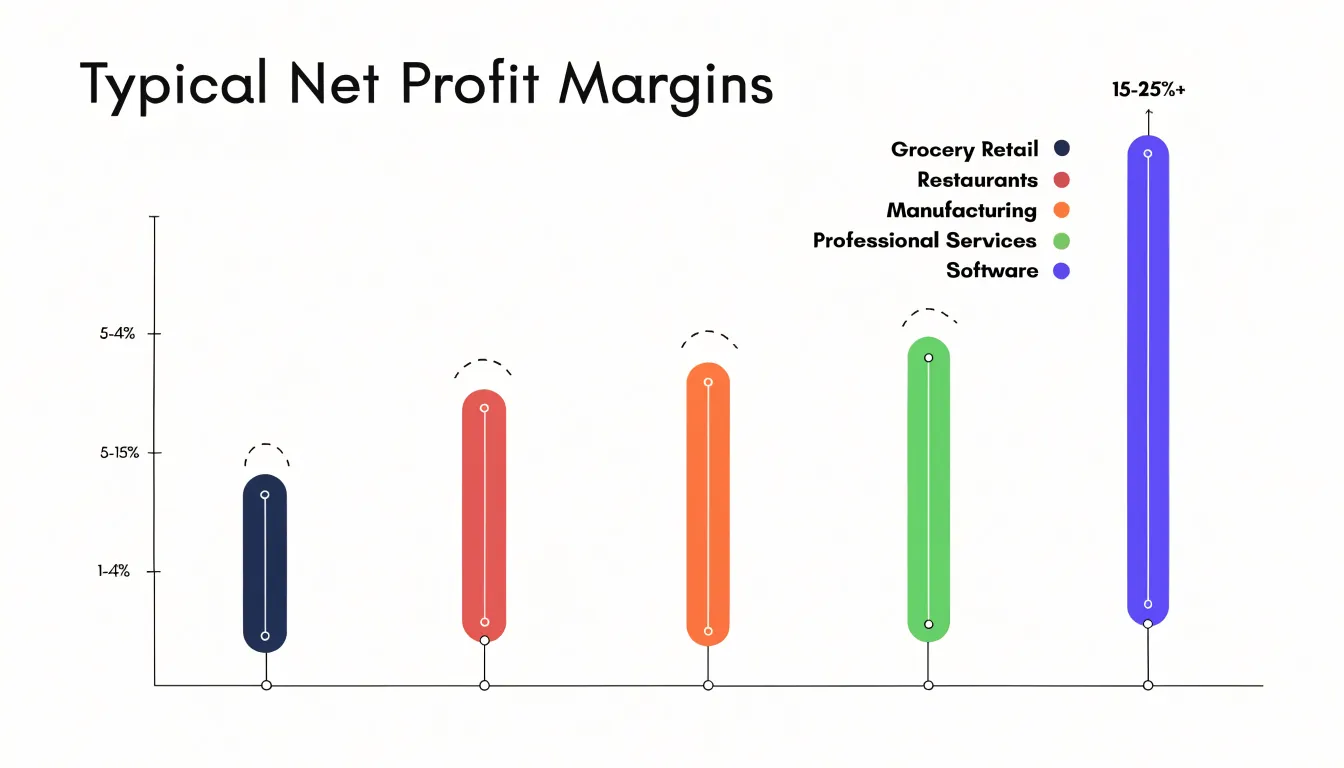
Service businesses show wide dispersion. Professional services such as consulting, accounting, and legal advice often operate in the 8% to 15% range, reflecting the value of specialized expertise against relatively modest capital requirements. Staffing, facilities management, and other labor-intensive services tend to be lower, frequently in the 3% to 7% range, because payroll costs scale directly with revenue.
These benchmarks are starting points rather than fixed rules. Company size influences margins through economies of scale, purchasing power, and overhead absorption. Business model matters as well: an asset-light licensing operation and a vertically integrated producer can share an industry code while posting very different margins. Analysts should compare a company against close peers of similar scale and structure, and treat broad sector averages as context rather than a definitive standard.
Why Retail and Restaurant Margins Are Naturally Low
Retail and restaurant businesses operate with structural cost profiles that keep net margins low across nearly every operator in the sector. The starting point is cost of goods sold. For retailers, the wholesale price of inventory consumes the majority of each sales dollar, and for restaurants, food and beverage costs typically absorb a substantial share of revenue before any other expense is counted. Because these inputs scale directly with sales volume, there is little room to spread them across a larger revenue base the way a software company might spread development costs.
Markups compound the problem. Retail pricing is constrained by what customers will pay relative to competitors, so operators often work with thin percentage markups on each item. A modest gross margin means that even small increases in operating costs can erase the net result. Restaurants face similar pressure: menu prices are bounded by local dining expectations, and raising them risks losing price-sensitive diners.
Rent adds a fixed burden that does not shrink when sales decline. Storefronts and restaurant spaces in desirable locations command significant lease payments, and those obligations persist through slow seasons and economic downturns. Labor is the other major fixed-to-semi-fixed cost. Retailers need floor staff, cashiers, and managers during operating hours, while restaurants require kitchen crews, servers, and hosts. Wages, payroll taxes, and benefits consume a large slice of revenue, and staffing levels cannot easily be cut below the minimum needed to serve customers.
Inventory costs round out the squeeze. Retailers carry stock that ties up cash, risks obsolescence, and requires storage and shrinkage management. Restaurants deal with perishable ingredients, which means spoilage and waste directly reduce margins. Together, these forces mean that a retail or restaurant business can be well run and still post single-digit net margins, with net profit representing a small residual after high COGS, thin markups, rent, labor, and inventory expenses are all accounted for.
High Margin Sectors
Software and financial services consistently rank among the most profitable sectors in the economy, and the reasons trace back to a handful of structural advantages. The first is scalability. Once a software product is built, distributing it to ten customers costs almost nothing more than distributing it to a thousand. The development work is a fixed cost, but the delivery mechanism—servers, app stores, download links—scales almost effortlessly. Financial services share a similar dynamic: a bank’s core infrastructure, compliance systems, and brand can support millions of customers with incremental additions far cheaper than the initial buildout.
This connects directly to low marginal costs. In traditional manufacturing, each additional unit requires raw materials, labor, and shipping. In software, the marginal cost of serving one more user is often measured in fractions of a cent. Financial products like index funds or insurance policies carry modest incremental costs as well, since the operational framework is already in place. When revenue grows while per-customer costs stay flat or decline, net margins expand naturally.
Recurring revenue reinforces this advantage. Subscription licenses, maintenance contracts, and asset-management fees produce predictable income streams that smooth out the volatility seen in project-based or transaction-based businesses. Financial services are particularly strong here, with fee structures built around ongoing relationships—account fees, advisory fees, premium payments—that generate steady cash flow without repeated sales efforts. Predictability lowers customer acquisition costs over time and improves operating leverage.
Finally, high barriers to entry protect these margins from being competed away. Building enterprise-grade software requires substantial upfront investment and deep technical expertise. Entering financial services requires regulatory approval, capital reserves, and established trust. These obstacles limit the number of competitors, allowing incumbents to maintain pricing power. Combined with the other factors, this creates a self-reinforcing cycle where scale advantages, recurring revenue, and limited competition sustain double-digit net margins year after year.
How to Tell If Your Net Profit Margin Is Healthy
Determining whether your net profit margin is healthy requires context. A single percentage tells you little on its own; you need to compare it against relevant benchmarks and consider the circumstances of your business. One of the most reliable ways to assess health is to benchmark against industry peers. Different sectors have vastly different typical margins due to variations in cost structures, competition, and capital intensity. For example, software companies often enjoy high net margins because their products scale with low marginal costs, while grocery retailers operate on thin margins due to high volume and low pricing power. By researching industry averages—available through trade associations, financial databases, or competitor analysis—you can see whether your margin is in line with or lagging the pack. Keep in mind that peers should be similar in size, business model, and target market for a fair comparison.
Equally important is tracking your margin trends over time. A healthy margin is not just a snapshot; it is a trajectory. Look at your net profit margin over several periods—monthly, quarterly, or annually—to identify patterns. A stable or rising margin suggests effective cost control and pricing strategies, while a declining margin may signal rising expenses, pricing pressure, or operational inefficiencies. Seasonal fluctuations are normal in some industries, so compare the same period year over year to account for cyclicality. Trend analysis also helps you spot early warning signs before they become critical.
Beyond external benchmarks and trends, consider internal factors such as business age and growth stage. Startups and early-stage companies often have lower or negative margins as they invest heavily in customer acquisition, product development, and market expansion. A young company with a negative margin may still be healthy if it is growing rapidly and has a clear path to profitability. Conversely, mature companies are expected to have stable, positive margins. Growth stage also matters: a company in a high-growth phase may prioritize market share over immediate profitability, while a mature company may focus on efficiency and margin expansion.
Finally, economic conditions play a significant role. During recessions, consumers tighten spending and costs may rise, putting pressure on margins across the board. A margin that dips during an economic downturn might still be healthy if it outperforms peers or recovers quickly. Conversely, a margin that looks strong during boom times may be unsustainable if it relies on temporary factors like favorable pricing or low input costs. By evaluating your margin in the context of the broader economic environment, you can distinguish between structural strength and cyclical luck. Combining these perspectives gives you a well-rounded view of whether your net profit margin is truly healthy.
Practical Strategies to Expand Your Bottom Line Margins
Expanding bottom line margins begins with a clear-eyed review of where money enters and exits the business. Pricing is often the fastest lever. Even modest price increases, applied thoughtfully to products or services with demonstrated customer demand, flow almost entirely to net profit because the underlying costs do not change. Businesses can test increases on select offerings, communicate value clearly to customers, and monitor volume responses before rolling changes out more broadly. Segmenting customers by price sensitivity allows a company to raise rates where the market will bear it while preserving relationships in more competitive segments.
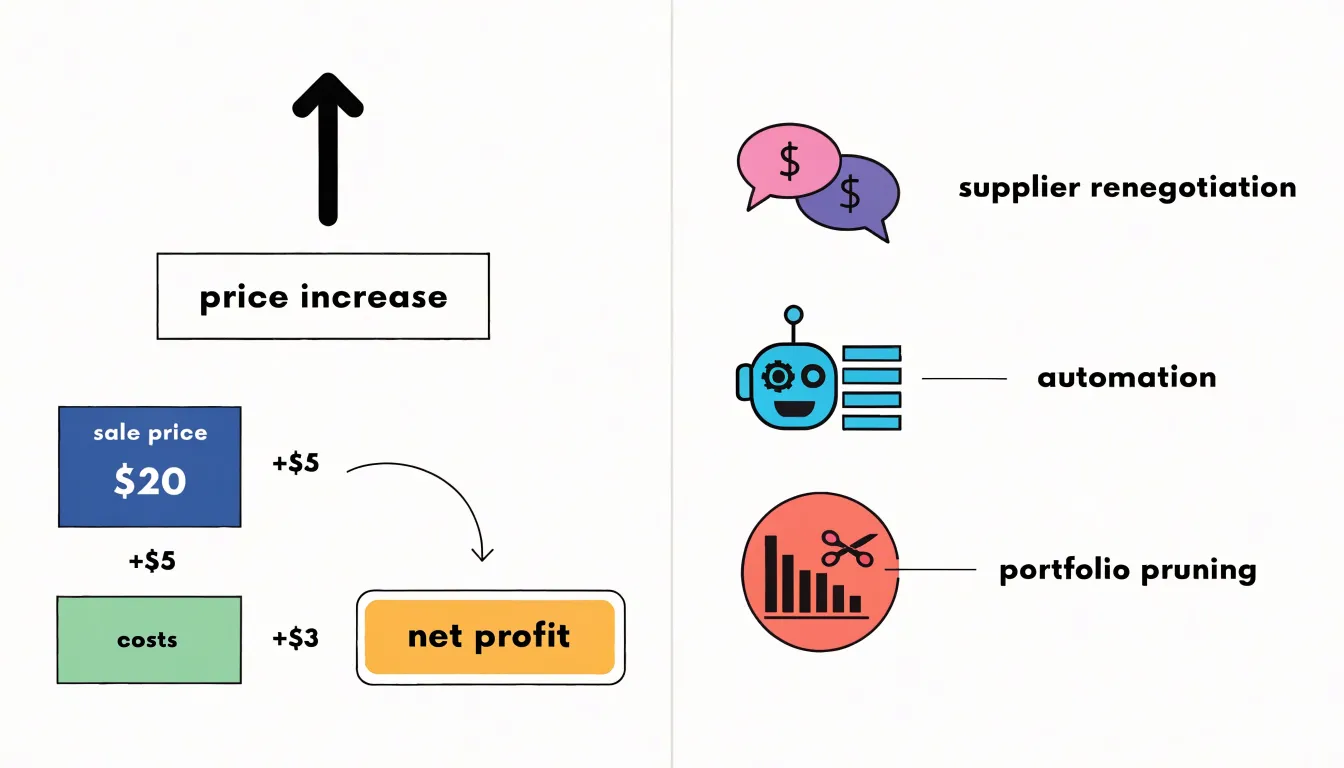
On the cost side, supplier contracts deserve regular scrutiny. Renegotiating terms, consolidating purchases with fewer vendors to gain volume discounts, and exploring alternative suppliers can reduce the cost of goods sold without touching revenue. Long-standing agreements often contain outdated pricing that no one has revisited in years. Scheduling a periodic contract review, benchmarking against market rates, and negotiating payment terms alongside unit prices can free up both margin and cash flow.
Automation offers another durable path to healthier margins. Repetitive administrative tasks such as invoicing, data entry, scheduling, and reporting consume labor hours that erode profit. Investing in software or workflow tools that handle these tasks reduces error rates and lets staff focus on higher-value work. The savings compound over time, and automated processes scale without proportional increases in headcount.
Finally, a disciplined product portfolio review can reveal offerings that quietly drag down overall profitability. Some products or services may sell well but carry thin margins after accounting for production, support, and marketing costs. Pruning or repositioning these items frees resources for higher-margin lines and simplifies operations. Together, these tactics form a practical playbook: price with intention, negotiate costs deliberately, automate where repetition dominates, and keep the portfolio focused on what actually contributes to the bottom line.
Frequently Asked Questions
What does net profit margin tell you about a business?
It measures the percentage of revenue that remains after all expenses are accounted for, including cost of goods sold, operating expenses, interest, and taxes. It shows how much of each sales dollar actually stays with the business and can be tracked over time or compared with industry benchmarks.
How do you calculate net profit margin?
Use the formula (Net Profit ÷ Revenue) × 100. For example, $50,000 in net profit on $500,000 in revenue equals a 10% net profit margin.
What common mistakes can distort a net profit margin calculation?
A common pitfall is using mismatched time periods for revenue and expenses. Misclassifying costs, failing to account for accrued expenses or deferred revenue, or omitting interest and taxes can also distort the ratio.
What is the difference between gross margin and net margin?
Gross margin subtracts only cost of goods sold from revenue, isolating the efficiency of production or purchasing. Net margin goes further down the income statement and accounts for all expenses, including operating costs, interest, taxes, and one-time charges or gains.
Why do retail and restaurant businesses have low net profit margins?
Their cost of goods sold consumes a large share of each sales dollar, and thin markups leave little room when operating costs rise. Rent, labor, and inventory costs—plus perishable ingredients for restaurants—also keep net profit as a small residual.
How can a company improve its net profit margin?
It can raise prices thoughtfully where demand allows, renegotiate supplier contracts, consolidate purchases, and review outdated agreements. Automating repetitive tasks and pruning or repositioning low-margin products can also help expand the bottom line.