
Operating Cash Flow
Operating cash flow is the cash a company generates from its core business operations during a period, calculated as net income plus non-cash expenses plus changes in working capital. It appears in the cash flow statement, excludes investing and financing activities, and shows whether day-to-day operations generate enough cash to fund the business without outside financing.
Table of Contents
- What operating cash flow measures on a financial statement
- Why is operating cash flow more reliable than net income?
- The standard operating cash flow formula explained
- The indirect method
- The direct method
- Step by step guide to calculating operating cash flow from balance sheets
- How to interpret positive versus negative operating cash flow
- Red flags and common errors when analyzing cash from operations
What operating cash flow measures on a financial statement
Operating cash flow measures the cash a company generates from its core business operations during a given period. It appears in the cash flow statement, one of the three primary financial statements, where it is typically presented as the first of three sections alongside investing activities and financing activities. The figure captures the actual money moving into and out of the business as a result of producing and selling goods or providing services, collecting payments from customers, paying suppliers, covering wages, and handling other day-to-day expenses. Because it is built from real cash movements rather than accrual-based accounting entries, operating cash flow offers a direct view of the liquidity that the core business produces.
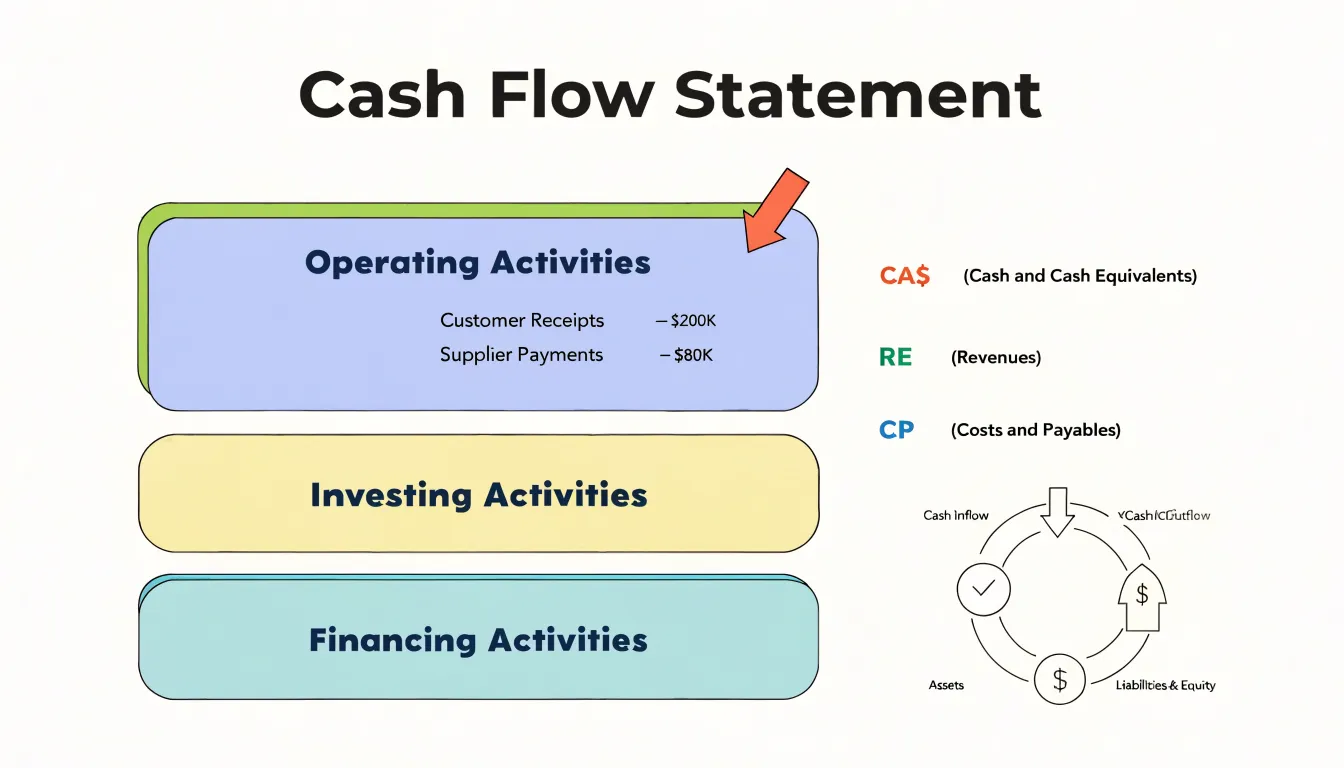
The calculation usually begins with net income and then adjusts for non-cash items such as depreciation, amortization, and stock-based compensation, followed by changes in working capital accounts like receivables, inventory, and payables. This reconciliation shows how accounting profit translates into cash. A company can report strong net income while its operating cash flow lags, for example when customers are slow to pay or inventory builds up. Conversely, operating cash flow can exceed net income when non-cash charges are large or when working capital releases cash.
The measure deliberately excludes several categories of cash movement. Cash spent on or received from long-term investments, such as purchasing property, plant, and equipment, acquiring another business, or selling securities, belongs in the investing activities section. Cash raised from issuing debt or equity, repayments of principal, dividend payments, and share repurchases fall under financing activities. By setting these aside, the operating cash flow line isolates the cash consequences of the everyday business model, giving readers a cleaner sense of whether routine operations fund themselves.
Analysts use operating cash flow to assess earnings quality, dividend sustainability, and the capacity to reinvest or repay debt without external funding. The figure is also a key input to free cash flow, which subtracts capital expenditures from operating cash flow. Understanding what the measure includes and what it omits helps readers interpret the cash flow statement accurately and compare cash generation across companies and periods with greater confidence.
Why is operating cash flow more reliable than net income?
Net income is one of the most closely watched figures in financial reporting, yet it rests on a set of accounting estimates and timing conventions that can obscure the actual movement of money through a business. Accrual accounting, the framework underpinning net income, records revenue when it is earned and expenses when they are incurred, regardless of when cash changes hands. A company can book a large sale in the current quarter while the customer pays months later, and it can record an expense today for a bill that will not be settled until the following year. These choices are legitimate and often required under accounting standards, but they mean that net income reflects economic activity filtered through judgments about timing, collectability, and valuation.
Non-cash items widen the gap further. Depreciation and amortization allocate the cost of long-lived assets over many years, reducing reported profit without consuming a single dollar of cash in the period. Stock-based compensation is recorded as an expense even though no cash leaves the company. Impairments, provisions, and gains or losses on asset sales introduce further adjustments tied to estimates of future value. Management also exercises discretion over inventory methods, revenue recognition timing, and the recognition of reserves, all of which influence the bottom line without directly changing the bank balance.
Operating cash flow sidesteps much of this ambiguity by tracking cash received from customers and cash paid to suppliers and employees in the ordinary course of business. It answers a concrete question: how much money did the core operations generate during the period? That figure is grounded in verifiable bank transactions rather than allocations and estimates. For a lender, investor, or analyst, operating cash flow shows whether a company can fund its day-to-day needs, service debt, reinvest in the business, and return capital to shareholders without relying on外部 financing.
Persistent divergence between net income and operating cash flow is a useful warning signal. A company reporting strong profits alongside weak or negative operating cash flow may be struggling to collect receivables, building unsold inventory, or relying on aggressive accounting choices. Because operating cash flow is harder to manipulate through accrual adjustments, it offers a more dependable measure of a company’s underlying ability to turn its operations into cash.
The standard operating cash flow formula explained
Operating cash flow measures the cash a business generates from its core operations during a given period, and the standard formula brings together three components that each capture a different dimension of that activity. The formula reads: Operating Cash Flow = Net Income + Non-Cash Expenses + Changes in Working Capital. Each piece adjusts the accounting profit figure so that it reflects actual cash movement.
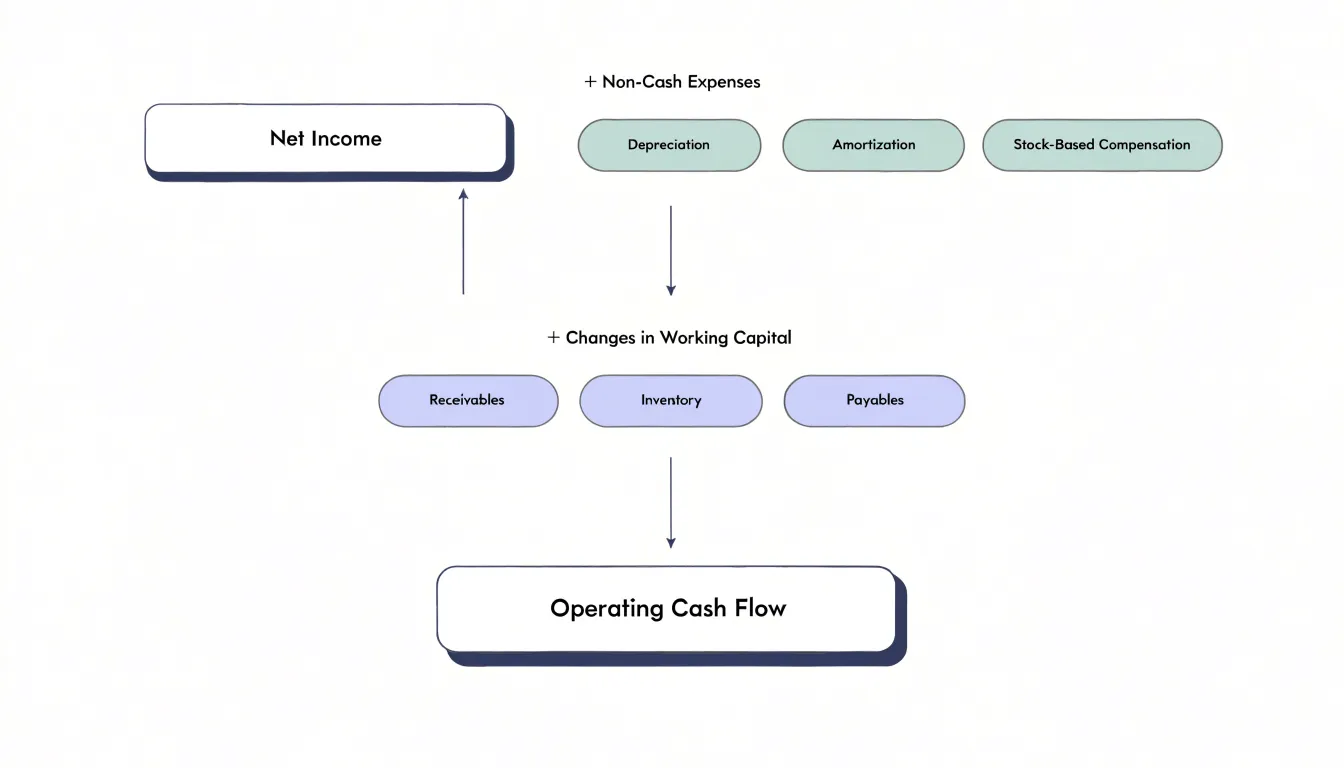
Net Income is the starting point. It is the bottom-line profit reported on the income statement after all revenues and expenses have been recognized under accrual accounting. Because accrual accounting records revenue when earned and expenses when incurred rather than when cash changes hands, net income alone does not tell you how much cash the business actually collected or paid out. It serves as the anchor from which the other adjustments are made.
Non-Cash Expenses are added back because they reduced net income on paper without consuming any cash. Depreciation and amortization are the most common examples: a company spreads the cost of equipment or intangible assets across their useful lives, creating an expense each period even though no money leaves the business at that time. Other items such as stock-based compensation, impairment charges, and provisions for doubtful accounts work the same way. Adding these back reverses their effect on net income and moves the figure closer to real cash flow.
Changes in Working Capital capture the timing differences between when transactions are recorded and when cash actually moves. Working capital items include accounts receivable, inventory, accounts payable, and other short-term operating balances. When receivables rise, customers owe more than was collected, which ties up cash, so the change is subtracted. When payables rise, the company has delayed payment to suppliers, preserving cash, so the change is added. An increase in inventory consumes cash and is likewise subtracted. In practice, analysts often compute this component as the change in non-cash current assets minus the change in non-debt current liabilities.
Taken together, the three components translate an accrual-based profit number into a cash-based one. Net income provides the starting reference, non-cash expenses strip out paper charges, and working capital changes account for the timing of cash receipts and payments. The result gives managers, investors, and lenders a clearer picture of the cash the business actually produces from its day-to-day operations.
The indirect method
The indirect method of presenting operating cash flow begins with net income, the figure reported at the bottom of the income statement, and then works backward through a series of adjustments to arrive at the actual cash generated or consumed by operations during the period. The starting point is net income because it captures the overall profitability of the business, but it is prepared on an accrual basis, meaning revenues are recorded when earned and expenses when incurred rather than when cash actually changes hands. The adjustments reconcile that accrual figure to a cash figure.
The first category of adjustments involves non-cash expenses, with depreciation and amortization being the most common examples. When a company purchases equipment, the cash outflow occurs at the time of purchase, but the expense is spread across the asset’s useful life through depreciation. Because depreciation reduces net income without any corresponding cash outflow in the current period, it is added back to net income in the operating cash flow calculation. The same logic applies to amortization of intangible assets and to other non-cash charges such as stock-based compensation or impairment write-downs. These items lowered reported profit, yet no cash left the business, so adding them back restores the cash perspective.
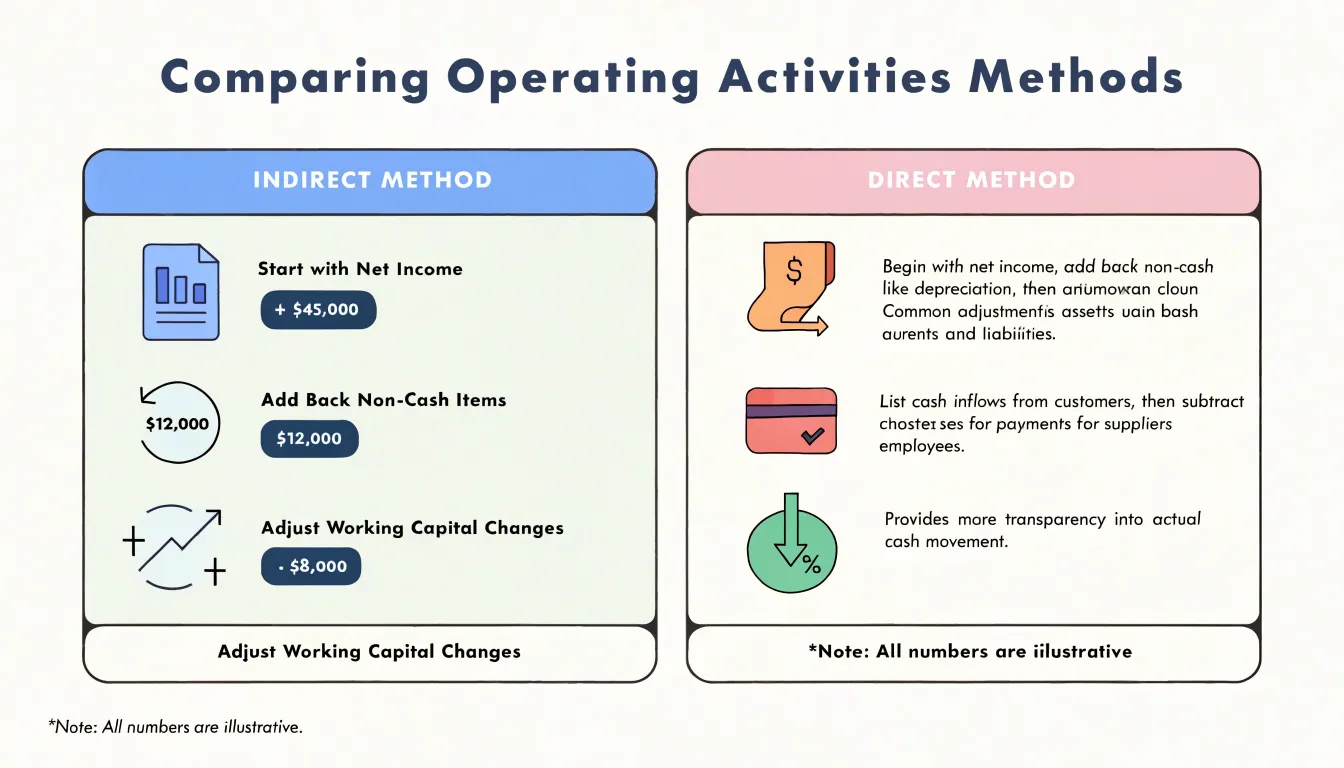
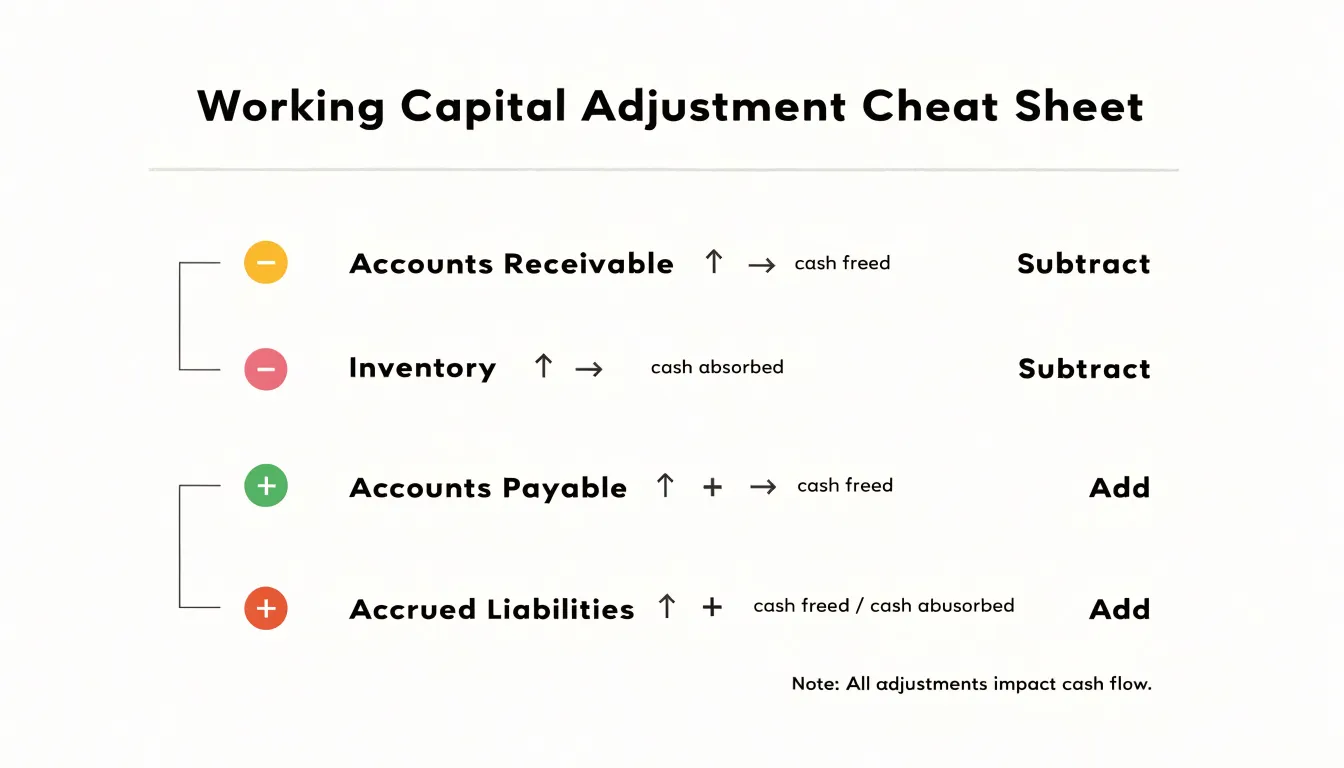
The second category involves changes in working capital accounts, which are the short-term operating assets and liabilities on the balance sheet. An increase in accounts receivable means the company recognized revenue without yet collecting the cash, so the increase is subtracted from net income. An increase in inventory reflects cash tied up in goods not yet sold, so it is also subtracted. Conversely, an increase in accounts payable means the company received goods or services without yet paying for them, which preserves cash, so the increase is added. The same treatment applies to accrued liabilities and deferred revenue. Each change is measured as the difference between the beginning and ending balance for the period, and the direction of the adjustment follows whether the change freed up or absorbed cash.
By combining net income, the add-back of non-cash items, and the working capital adjustments, the indirect method arrives at the net cash provided by operating activities. This approach is popular in practice because it links directly to the income statement and balance sheet that companies already prepare, and it highlights the differences between accounting profit and cash generation.
The direct method
The direct method of preparing the operating cash flow section begins with a simple premise: record the actual cash that moved into and out of the business during the period. Rather than starting with net income and working backward through a series of adjustments, the direct method lists the major categories of cash receipts and cash payments that arose from operating activities. The result is a statement that reads much like a cash-based income summary, showing where operating cash came from and where it went.
On the receipts side, the most prominent line is typically cash collected from customers. This figure reflects the actual payments received for goods sold or services rendered during the period, which may differ from reported revenue because of changes in receivables, advance payments, and sales returns. Other operating receipts can include cash received from interest and dividends on investments, refunds from suppliers, and insurance proceeds related to operations.
On the payments side, the direct method itemizes the principal outflows. Cash paid to suppliers covers purchases of inventory and raw materials, adjusted for changes in payables and inventory levels. Cash paid to employees includes wages, salaries, bonuses, and payroll-related costs actually disbursed during the period. Additional lines commonly appear for cash paid for rent, utilities, taxes, interest, and other operating expenses, each showing the amount of cash that left the company rather than the amount of expense recognized under accrual accounting.
The difference between total operating receipts and total operating payments produces net cash provided by operating activities. Because every line in the statement represents real cash movement, the direct method gives readers a transparent view of liquidity. A lender or investor can see exactly how much cash the customer base generated and how much was consumed by suppliers and staff, without needing to interpret accrual adjustments. This clarity makes it easier to assess a company’s ability to fund its obligations and reinvest in the business from its own operations.
The direct method does require access to detailed cash records, since the figures must be drawn from the accounting system’s cash journals rather than derived from accrual balances. Companies that maintain well-organized cash accounting can prepare the statement directly; others often assemble it by converting accrual figures using balance sheet changes, which involves additional work but yields the same transparent presentation.
Step by step guide to calculating operating cash flow from balance sheets
Calculating operating cash flow from the balance sheet and income statement follows a logical sequence that begins with net income and adjusts for items that do not involve actual cash movement. Start by locating net income at the bottom of the income statement. This figure serves as the foundation because it captures the company’s earnings after all expenses, taxes, and interest have been accounted for.
The next step involves adding back non-cash expenses. Depreciation and amortization appear as line items on both the income statement and the balance sheet, and they reduce reported profit without consuming cash. Add these amounts back to net income. Other non-cash charges, such as stock-based compensation, impairment losses, or provisions for doubtful accounts, should also be added back if they appear in the financial statements. These adjustments convert accrual-based earnings into a closer approximation of cash generated.
Working capital changes form the third stage of the calculation. Compare current asset and current liability balances between the beginning and end of the period using the balance sheet. An increase in accounts receivable means the company collected less cash than it recorded as revenue, so subtract the increase. An increase in inventory represents cash tied up in goods, so subtract that change as well. On the liability side, an increase in accounts payable means the company delayed payments to suppliers, preserving cash, so add the increase. The same logic applies to accrued expenses and other current liabilities. Decreases in current assets are added and decreases in current liabilities are subtracted, following the principle that cash conserved increases operating cash flow.
After completing these adjustments, sum the figures to arrive at operating cash flow. As a verification step, compare the result against the cash flow statement’s reported figure for the same period. Differences may arise from classification choices or items placed in investing or financing sections. Reconciling the calculated number with the reported one builds confidence in the analysis and highlights any adjustments that warrant closer examination.
How to interpret positive versus negative operating cash flow
Operating cash flow is the cash a company generates from its core business activities, and the direction of that figure offers one of the clearest signals of financial health available to an analyst. A positive operating cash flow indicates that the company’s day-to-day operations are self-funding. Cash is coming in from customers faster than it is going out to suppliers, employees, and tax authorities, which means the business can cover its own expenses without relying on external financing. Consistently positive operating cash flow gives a company the flexibility to invest in new equipment, reduce debt, pay dividends, or build a cash cushion for downturns. When positive operating cash flow also grows over time, it suggests the underlying business is strengthening and that reported profits are being converted into real cash rather than sitting in receivables or inventory.
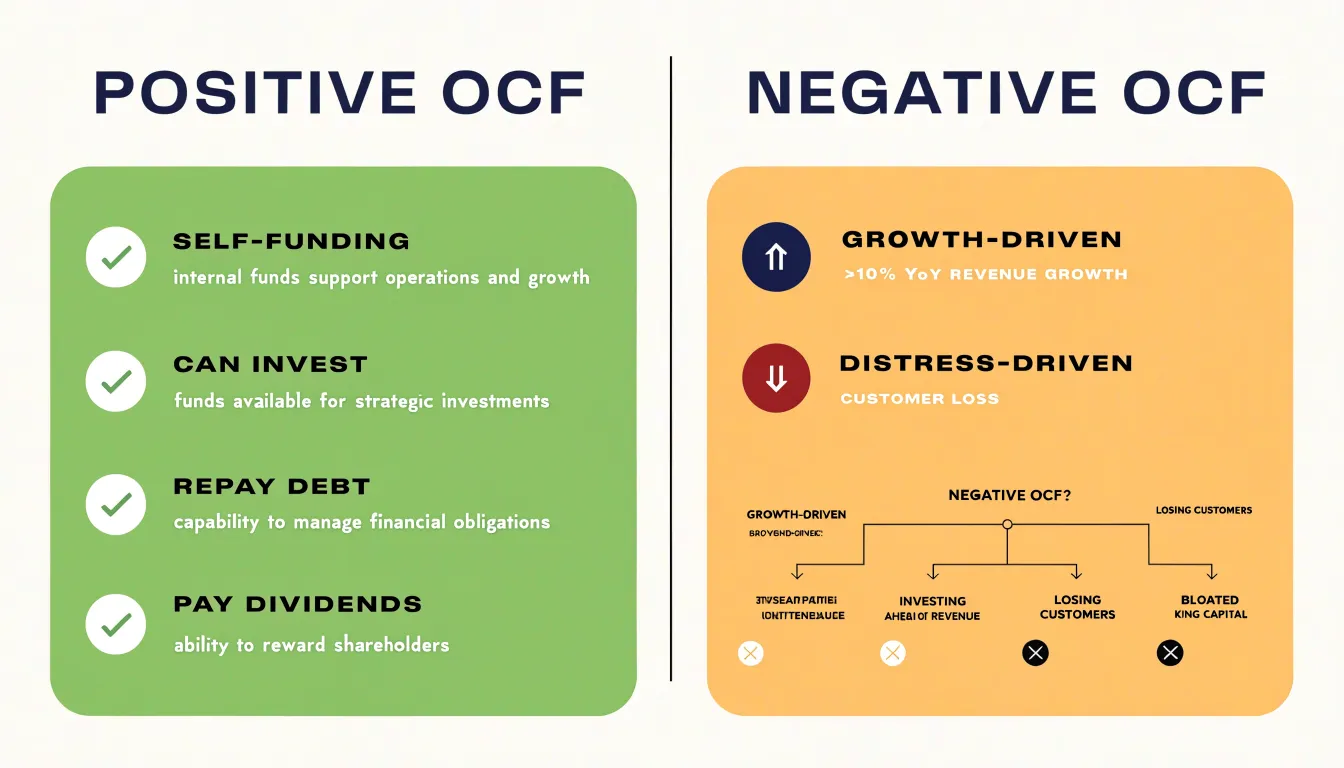
A negative operating cash flow figure requires more careful interpretation, because the meaning depends heavily on context. In a growth phase, a young or expanding company may burn cash as it invests ahead of revenue: hiring staff, building inventory, extending credit terms to attract customers, or funding marketing campaigns. For a company scaling quickly, negative operating cash flow can be a deliberate and temporary condition, and the key question is whether the cash burn is funding growth that will eventually produce positive returns. Investors typically examine the trend, the size of the cash burn relative to available reserves, and the company’s path toward breakeven.
In other contexts, negative operating cash flow signals distress. A mature company that cannot generate cash from its core operations may be losing customers, facing pricing pressure, or struggling with bloated working capital. Persistent negative operating cash flow forces reliance on debt or equity raises, which dilutes shareholders or increases financial risk. When negative operating cash flow coincides with declining revenue or rising liabilities, it can be an early warning of liquidity problems. The distinction between investment-driven and distress-driven negative cash flow matters: analysts look at whether the shortfall stems from deliberate growth spending or from operations that simply fail to cover costs. Comparing operating cash flow against net income also helps, since a widening gap between reported profits and cash generation can reveal aggressive accounting or deteriorating collection of receivables.
Red flags and common errors when analyzing cash from operations
When analyzing cash from operations, several red flags and common errors deserve close attention because they can distort the picture of a company’s true liquidity. One frequent mistake is misclassifying items within the cash flow statement. For example, treating capital expenditures as operating outflows, or lumping financing activities such as borrowing proceeds into the operating section, skews the core cash generation figure. Analysts should verify that only cash flows from primary business activities, like customer receipts and supplier payments, appear in the operating section. Another common error is ignoring working capital changes. A company may report strong profits while cash flow suffers because receivables are ballooning or inventory is piling up. Failing to adjust for these swings can make operating cash flow look healthier or weaker than it really is. Seasonal businesses, in particular, require normalization across quarters to avoid misreading temporary working capital fluctuations.
A related pitfall is overlooking non-cash items that are added back, such as depreciation or stock-based compensation. While adding back depreciation is standard, excessive add-backs for items like unrealized gains or provisions can inflate operating cash flow artificially. Analysts should cross-check the reconciliation between net income and operating cash flow for unusually large or recurring adjustments. Warning signs include persistently negative operating cash flow despite reported profits, which often signals aggressive revenue recognition, poor collections, or unsustainable growth. Similarly, a widening gap between net income and operating cash flow over several periods can indicate earnings quality issues. Companies that consistently rely on financing inflows to cover operating shortfalls, or that show declining operating cash flow alongside rising net income, warrant deeper scrutiny. Another red flag is a sudden spike in days sales outstanding or inventory days, which slows cash conversion. Finally, currency effects and one-off items like litigation settlements can mask underlying trends if not separated. By watching for these misclassifications, working capital distortions, and persistent negative cash flow patterns, analysts can better assess whether reported profits are backed by real cash generation.
Frequently Asked Questions
What is operating cash flow and where does it appear?
Operating cash flow measures the cash a company generates from its core business operations during a given period. It appears in the cash flow statement, typically as the first of three sections alongside investing activities and financing activities.
Why is operating cash flow considered more reliable than net income?
Net income is based on accrual accounting and includes estimates, timing conventions, and non-cash items, while operating cash flow tracks cash received from customers and cash paid to suppliers and employees. Because operating cash flow is grounded in verifiable bank transactions, it is harder to manipulate through accrual adjustments.
How is operating cash flow calculated using the indirect method?
The standard formula is Operating Cash Flow = Net Income + Non-Cash Expenses + Changes in Working Capital. The indirect method begins with net income, adds back non-cash expenses such as depreciation and amortization, and adjusts for working capital changes such as subtracting increases in receivables or inventory and adding increases in payables.
What does the direct method show for operating cash flow?
The direct method lists actual cash receipts and cash payments from operating activities, such as cash collected from customers and cash paid to suppliers and employees. The difference between total operating receipts and total operating payments produces net cash provided by operating activities.
What does positive versus negative operating cash flow mean?
Positive operating cash flow indicates that the company’s day-to-day operations are self-funding and can cover expenses without relying on external financing. Negative operating cash flow depends on context: it may reflect deliberate growth spending, or it may signal distress, especially if it is persistent or requires reliance on debt or equity raises.
What are common red flags when analyzing cash from operations?
Common red flags include misclassifying items in the cash flow statement, ignoring working capital changes, and overlooking non-cash add-backs that can inflate operating cash flow. Persistently negative operating cash flow despite reported profits, a widening gap between net income and operating cash flow, and rising days sales outstanding or inventory days also warrant deeper scrutiny.