
Operating Margin
Operating margin is a financial ratio that shows how much of each dollar of revenue remains after subtracting operating expenses such as cost of goods sold, wages, rent, marketing, and depreciation. Calculated as operating income divided by revenue, it measures core operational efficiency excluding interest and taxes, so a 20% margin means 20 cents of each sales dollar remains.
Table of Contents
- Understanding the Core Definition of Operating Margin
- The Operating Margin Formula Explained Step by Step
- Differences Between Operating Income and Gross Profit
- Step-by-Step Walkthrough
- What Does a High Operating Margin Tell You About a Company
- Red Flags
- Comparing Operating Margin Across Different Industries
- How Operating Margin Differs From Net Profit Margin
- Practical Ways Management Can Improve Their Operating Margin
Understanding the Core Definition of Operating Margin
Operating margin is a financial ratio that expresses, as a percentage, how much of each dollar of revenue a company keeps after paying for the costs of running its business day to day. To calculate it, you take operating income—revenue minus operating expenses such as cost of goods sold, wages, rent, marketing, and depreciation—and divide that figure by total revenue. A company with $10 million in revenue and $2 million in operating income has an operating margin of 20%, meaning twenty cents of every sales dollar remain after the core costs of doing business are covered.
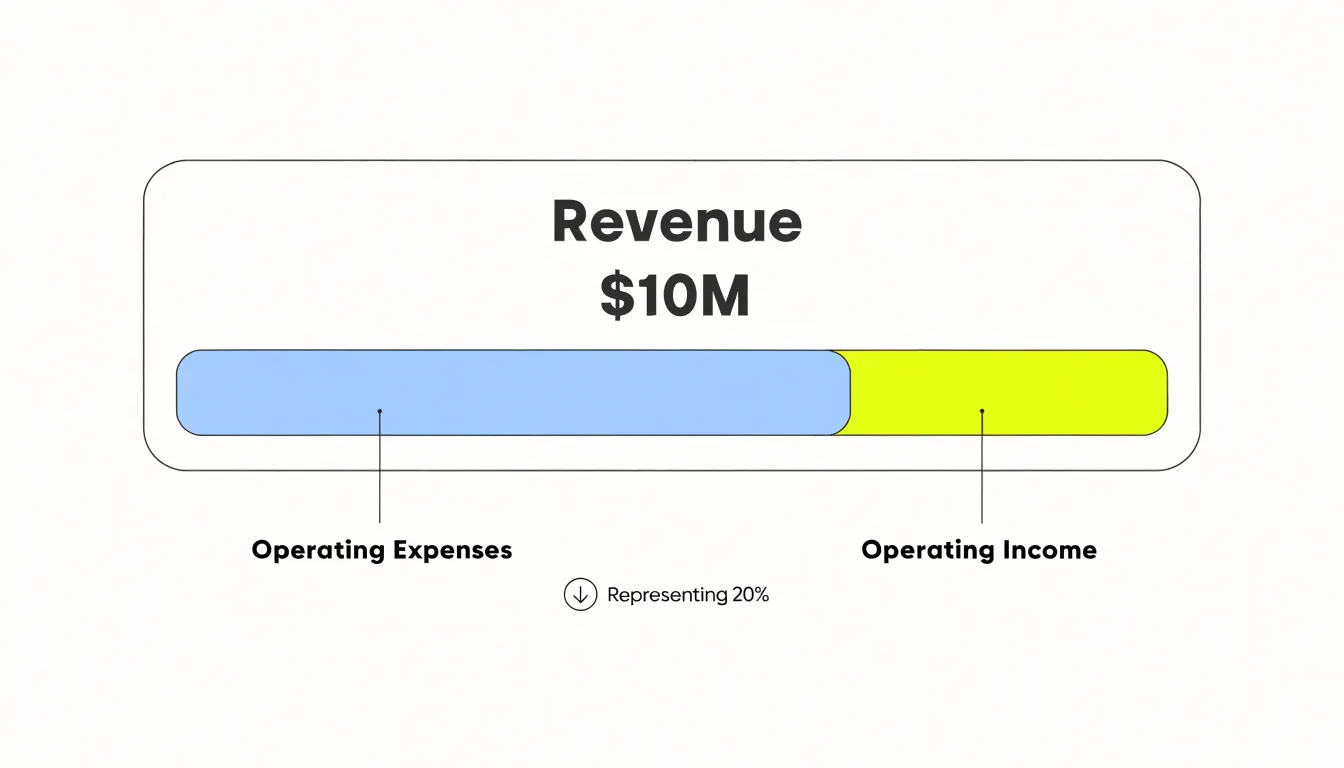
The measure captures operational efficiency in a direct way. It shows how well a company converts sales into profit through its ordinary activities: producing goods, delivering services, managing staff, and running its facilities. A higher margin suggests the business controls its costs well relative to its pricing, while a lower margin points to cost pressures, pricing weakness, or both. Because the figure is expressed as a percentage rather than an absolute dollar amount, it allows meaningful comparison between companies of different sizes and across time periods, making it a staple of ratio analysis.
A key feature of operating margin is what it excludes. It sits above interest and taxes on the income statement, so it isolates the profitability of core operations from financing decisions and tax jurisdictions. A company carrying heavy debt will see interest expenses depress its net income, yet its operating margin may remain healthy, revealing that the underlying business is sound and the earnings pressure comes from its capital structure. Likewise, companies in different tax environments can be compared on operating margin without tax rules distorting the picture. This makes the ratio especially useful for judging management’s ability to run the business itself, separate from how the business is financed.
Operating margin also serves as a lens for tracking trends. Watching the ratio over several quarters or years reveals whether efficiency is improving or eroding, and comparing it with peers shows whether a company enjoys a cost or pricing advantage. For investors, lenders, and managers alike, the operating margin offers a compact, plain-language answer to a fundamental question: for every dollar of sales, how much is left to reward the business after the costs of simply being in business are paid?
The Operating Margin Formula Explained Step by Step
The operating margin formula begins with revenue, the total income generated from a company’s core business activities before any costs are subtracted. For a retailer, revenue is the money collected from selling merchandise; for a software firm, it is subscription and license fees. This figure appears at the top of the income statement and serves as the denominator for the entire calculation, which is why analysts often refer to it as the top line.
The next component is operating income, sometimes called operating profit or earnings before interest and taxes (EBIT). It represents what remains after subtracting operating expenses from revenue. These expenses fall into several categories. Cost of goods sold (COGS) covers the direct costs of producing or acquiring what the company sells, such as raw materials, manufacturing labor, and freight. For a furniture maker, COGS includes the wood, fabric, and factory wages tied to each piece produced. Selling, general, and administrative expenses (SG&A) capture the costs of running the business day to day: sales commissions, marketing budgets, rent, salaries for administrative staff, and professional fees. Depreciation accounts for the gradual wear and loss of value on long-lived assets like machinery, vehicles, and buildings, allocating their cost across the years they help generate revenue.
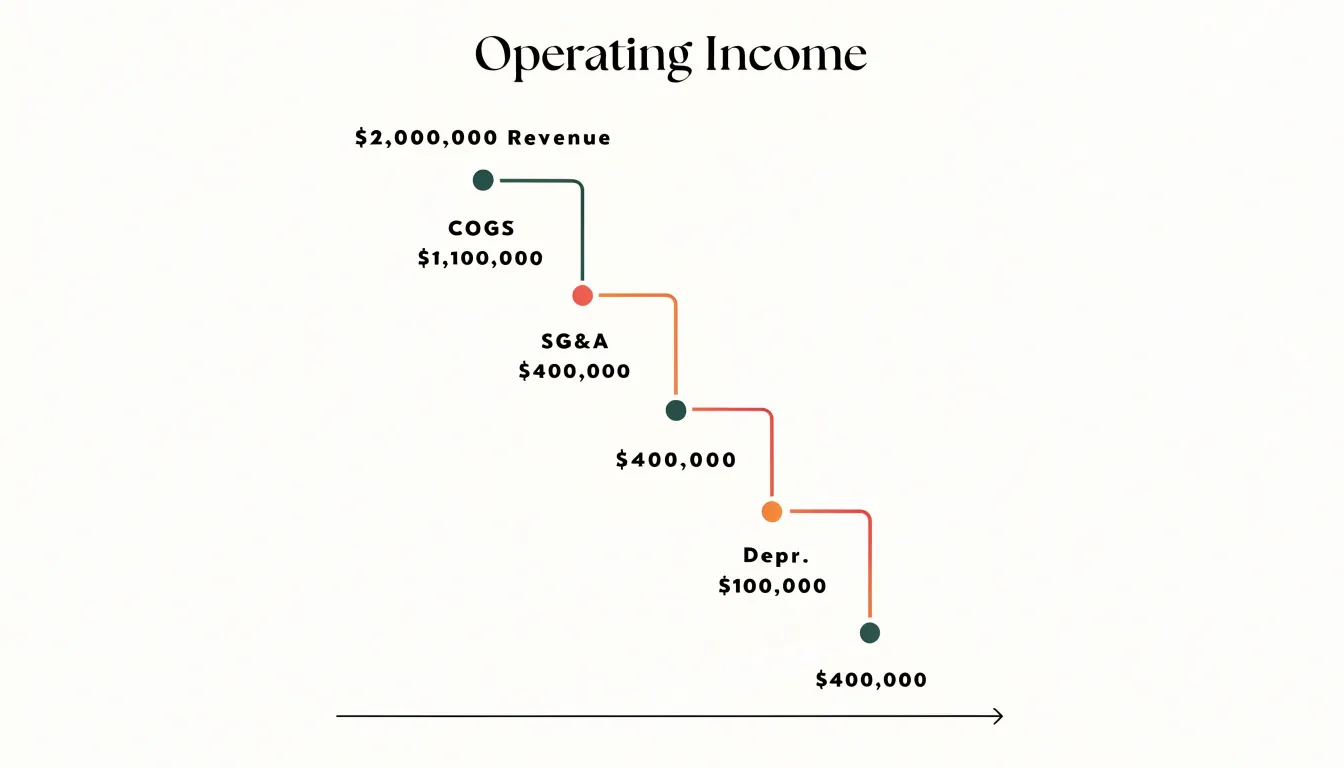
A worked example makes the arithmetic concrete. Suppose a company reports revenue of $2,000,000. Its COGS is $1,100,000, SG&A totals $400,000, and depreciation is $100,000. Subtracting all three operating expenses from revenue leaves operating income of $400,000. Dividing that operating income by revenue yields an operating margin of 20 percent. That single number tells the reader that for every dollar of sales, the company retains twenty cents to cover interest, taxes, and profit after paying the costs of running its operations.
The step-by-step sequence matters: start with revenue, deduct COGS to reach gross profit, then deduct SG&A and depreciation to arrive at operating income, and finally divide operating income by revenue. Each stage isolates a different layer of cost, allowing anyone reading the calculation to see exactly where money is being consumed before the final margin emerges.
Differences Between Operating Income and Gross Profit
Gross profit and operating income sit at different points on the same income statement, and the distance between them reveals how much of a company’s revenue is consumed by running the business rather than making the product. Gross profit is calculated by subtracting cost of goods sold from revenue. Cost of goods sold captures the direct costs tied to producing or acquiring what the company sells: raw materials, manufacturing labor, freight, and similar expenses that scale with production volume. Gross profit therefore measures the profitability of the core product or service before the costs of administering the organization enter the picture.
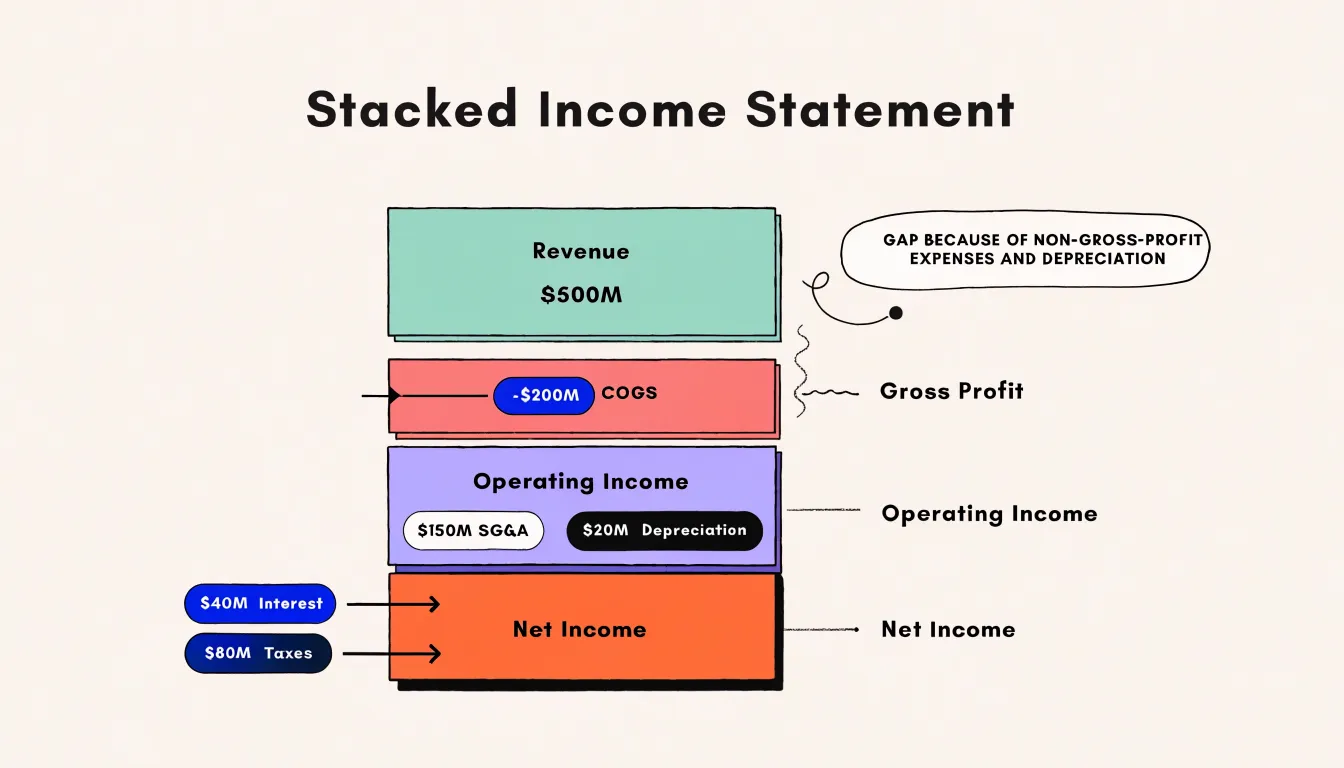
Operating income goes a layer deeper. It begins with gross profit and then deducts operating expenses, the costs required to run the business day to day. These include selling, general, and administrative costs such as salaries for sales and management staff, marketing and advertising, rent, utilities, insurance, professional fees, and depreciation on operating assets. Research and development spending also typically falls into this category for many companies. The result is a figure that reflects earnings generated by normal operations, after nearly every recurring cost has been accounted for except interest and taxes.
The distinction matters because the two metrics answer different questions. Gross margin indicates how efficiently a company converts production inputs into saleable output, and it is especially useful for comparing companies within an industry where cost structures are similar. Operating margin shows how effectively the entire organization, including its sales force and back office, turns revenue into profit. A company can post a healthy gross margin while producing a thin operating margin if its overhead is heavy, which tells an analyst that the problem lies in administration or selling costs rather than in production.
Tracking the gap between the two margins over time is equally revealing. If gross margin holds steady while operating margin erodes, operating expenses are growing faster than revenue, pointing to bloat in overhead or declining efficiency in sales and administration. If both compress together, cost of goods sold is likely the culprit. Comparing operating margin across companies also requires care, since classifications of expenses can vary. For these reasons, analysts use both measures together, reading gross margin as a gauge of production economics and operating margin as a gauge of overall operational discipline.
Step-by-Step Walkthrough
Calculating operating margin begins with an income statement, the financial document that summarizes a company’s revenues and expenses over a defined period. The first step is to locate the top line, labeled as revenue, net sales, or total sales. This figure represents the money brought in from the company’s core business activities before any costs are subtracted. Suppose a sample income statement shows total revenue of $500,000 for the year.
The next step requires working down the statement to find operating income, sometimes labeled as operating profit or income from operations. This line appears after cost of goods sold and operating expenses such as selling, general, and administrative costs, and depreciation, but before interest and taxes are deducted. In the sample statement, after subtracting $300,000 in cost of goods sold and $100,000 in operating expenses, operating income comes to $100,000. Using operating income rather than net income keeps the calculation focused on the profitability of core operations, excluding financing and tax effects.
With both figures identified, the division is straightforward: divide operating income by revenue. In this example, $100,000 divided by $500,000 equals 0.20. Multiplying by 100 converts the decimal into a percentage, giving an operating margin of 20%. This means that for every dollar of sales, the company retains 20 cents as operating profit before interest and taxes are considered.
Interpreting the result requires context. A 20% operating margin indicates the company converts a healthy share of revenue into profit from its main business, though the figure only becomes meaningful when compared with prior periods, competitor benchmarks, or industry norms. A margin that rises over successive quarters suggests improving cost control or pricing power, while a declining margin may point to rising expenses or pricing pressure. Analysts also watch for margins that shift sharply from one period to the next, since such movements often signal changes in the underlying business. Running through this walkthrough with an actual income statement builds familiarity with where the key figures sit and how the ratio responds to changes in revenue and costs. Repeating the exercise across several periods or companies turns a single percentage into a useful tool for tracking operational performance over time.
What Does a High Operating Margin Tell You About a Company
A high operating margin tells you that a company keeps a generous share of each sales dollar after covering the costs of running the business day to day. Operating margin is calculated by dividing operating income by revenue, so a high figure means that wages, materials, rent, marketing, and other core expenses consume a comparatively small portion of what customers pay. That outcome signals several things at once about how the business is managed.
First, it points to strong cost control. Management has found ways to keep production and administrative expenses in check relative to sales, whether through disciplined procurement, efficient scheduling, lean overhead, or careful management of labor. A company that consistently earns a high operating margin is usually one that watches its expense base closely and does not let costs creep up faster than revenue.
Second, a high operating margin often reflects pricing power. When a company can charge more for its products or services without losing customers, that extra revenue flows largely down to operating income because the underlying costs do not rise at the same pace. Pricing power tends to come from brand strength, differentiated products, switching costs, or a dominant market position, so the margin itself hints at the strength of the company’s competitive position.
Third, the margin speaks to operational efficiency. Businesses that turn inputs into outputs with less waste, shorter cycle times, or better asset utilization tend to convert a larger share of revenue into operating profit. This efficiency can stem from scale, technology, process design, or simply superior execution by management.
Taken together, these traits suggest durable competitive advantages. A company that sustains a high operating margin over many years is often protected by some barrier to competition, because otherwise rivals would compete away the premium through lower prices or higher spending. The margin also carries information about scalability: once fixed costs are covered, additional revenue tends to drop through to profit at a high rate, so growth can be unusually rewarding for shareholders. Investors reading a high operating margin are therefore looking at evidence of both present discipline and future earnings potential.
Red Flags
A shrinking operating margin is one of the most important red flags for investors, because it directly reflects a company’s ability to generate profit from its core operations. When operating margin declines, it means that a smaller portion of each revenue dollar is left after covering the costs of running the business. This deterioration can stem from several common causes. Rising costs—whether for raw materials, labor, or energy—can squeeze margins if a company cannot pass these increases on to customers. Pricing pressure, often from intense competition or a shift in bargaining power, may force a company to lower prices or offer discounts, eroding profitability. Inefficiencies, such as bloated overhead, poor cost control, or operational missteps, can also cause margins to contract. Each of these causes warrants scrutiny, but the critical question for investors is whether the decline is temporary or structural. A temporary decline might result from a one-time event, such as a surge in commodity prices or a transient increase in marketing spend to launch a new product. In such cases, margins may recover as conditions normalize. A structural decline, however, signals deeper problems: a losing competitive position, a flawed business model, or a permanent shift in the industry landscape. Structural declines often persist and can precede further deterioration in earnings and cash flow. Therefore, investors should investigate the root causes. Are cost increases industry-wide or company-specific? Is pricing pressure due to new entrants or changing consumer preferences? Are inefficiencies fixable through better management, or do they reflect a fundamental lack of scale or technological disadvantage? Answering these questions helps distinguish between a temporary setback and a long-term threat. Failing to do so can lead to holding a stock that continues to disappoint. Moreover, a declining operating margin can be an early warning sign of financial distress, as it reduces the buffer available to cover interest and other fixed obligations. It may also indicate that management is losing control of costs or making poor strategic decisions. By monitoring operating margin trends and digging into the underlying reasons, investors can protect their portfolios from potential value destruction and identify companies that are genuinely improving their operational efficiency.
Comparing Operating Margin Across Different Industries
Operating margin benchmarks vary widely from one industry to the next, and understanding why helps explain how a company’s profitability should be judged. The core reason is that industries differ in their fundamental cost structures. A software company building a product once and licensing it to thousands of customers carries relatively low incremental costs for each additional sale, so a large share of revenue can flow down to operating profit once development costs are covered. A grocery retailer, by contrast, operates on thin per-unit margins and must account for the cost of goods sold, distribution, store operations, and labor on every item it moves, leaving a much smaller percentage of revenue as operating profit. A heavy manufacturer combines expensive raw materials, capital-intensive equipment, and substantial overhead, all of which consume revenue before operating income is reached.
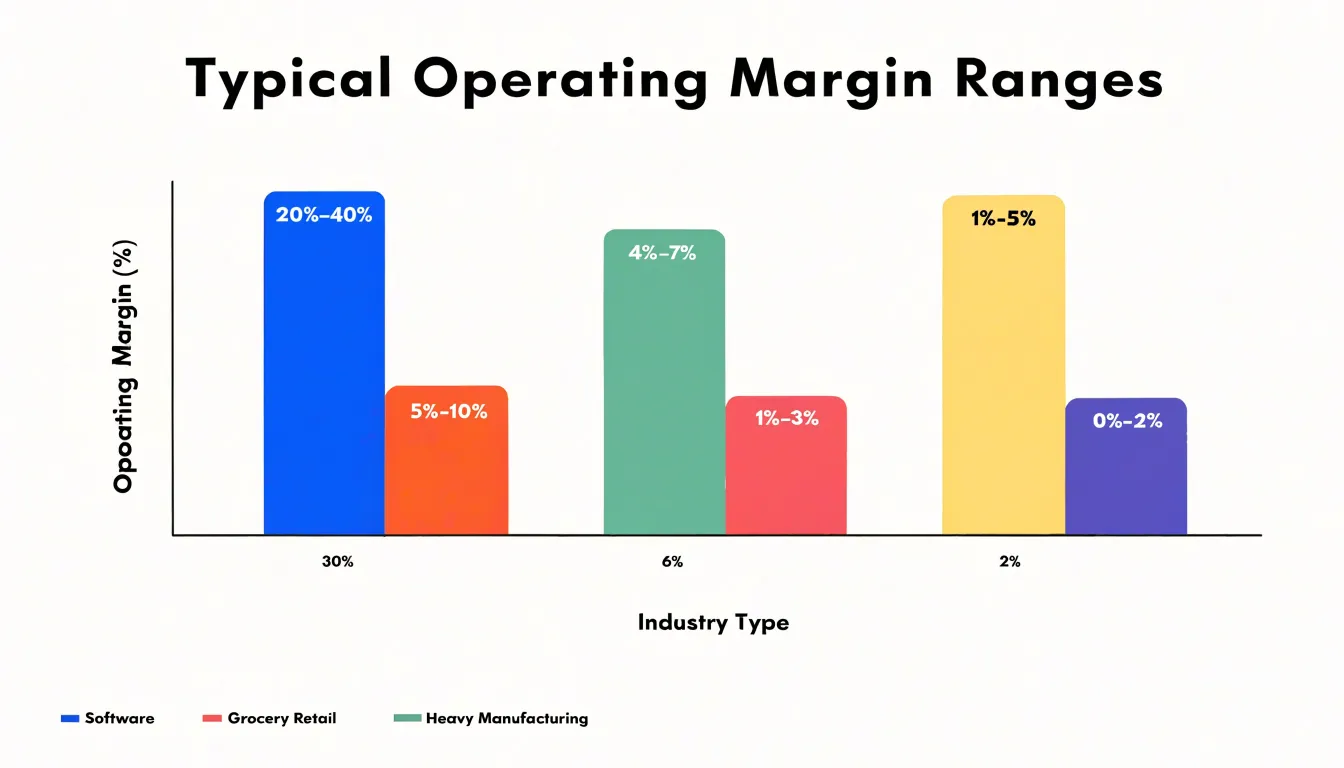
Because these structural differences are so pronounced, a single economy-wide benchmark for operating margin offers little value. A figure that looks weak in one sector may represent strong performance in another, and a figure that looks impressive could be ordinary elsewhere. Comparing a software firm’s operating margin against a supermarket chain’s tells you more about the industries than about either company’s efficiency. The meaningful comparison is between companies operating under similar cost conditions, facing similar customer expectations, and using similar business models.
This is why analysts emphasize sector-based benchmarking. Within a given industry, companies typically contend with comparable input costs, pricing dynamics, and capital requirements, so differences in operating margin tend to reflect genuine differences in execution, scale, or efficiency. A retailer that sustains a higher margin than its peers is likely managing supply chains or inventory better. A manufacturer that outperforms its sector is probably controlling production costs or commanding premium pricing. These insights emerge only when the peer group is chosen carefully. Sector comparison also helps in tracking trends over time, since shifts affecting an entire industry, such as rising input costs or changing consumer habits, can be separated from company-specific performance. Recognizing that benchmarks are industry-relative is therefore essential for drawing accurate conclusions about operational strength.
How Operating Margin Differs From Net Profit Margin
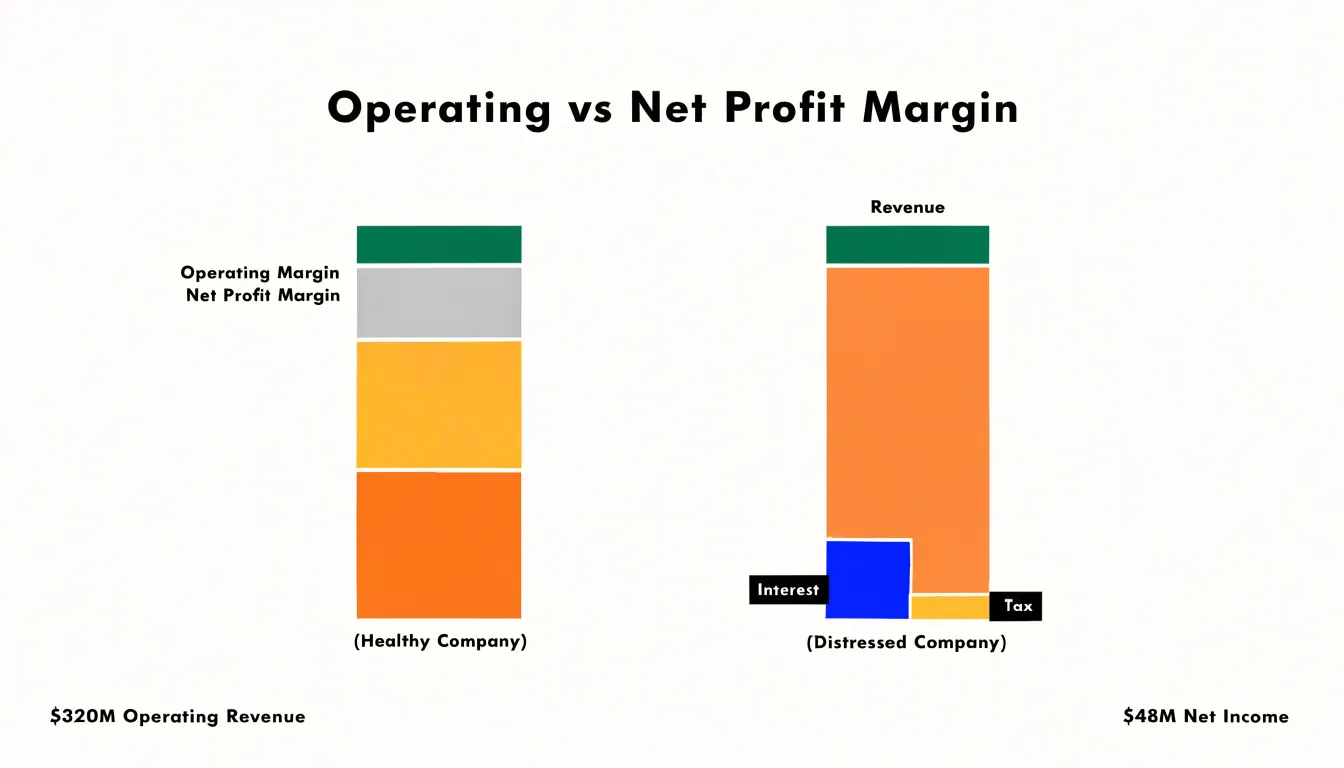
Operating margin and net profit margin both measure profitability, yet they answer different questions because they sit at different points along the income statement. Operating margin is calculated by dividing operating income by revenue, where operating income represents the profit remaining after cost of goods sold and all operating expenses such as selling, general, administrative, research, and depreciation costs have been subtracted. Crucially, this figure stops before interest and taxes. Net profit margin, by contrast, divides net income by revenue, and net income is what remains after interest expense, taxes, and any other non-operating items have also been deducted. The gap between the two margins therefore captures the combined effect of financing decisions and tax obligations on a company’s bottom line.
This distinction matters because each metric illuminates a different dimension of performance. Operating margin isolates the core business: it shows how efficiently a company converts sales into profit from its primary operations, independent of how the business is financed or where it is taxed. Analysts use it to compare companies with different capital structures, since a heavily indebted firm and a debt-free competitor may post similar operating margins while diverging sharply at the net level. Operating margin also serves as a clean read on pricing power and cost control, because it is unaffected by changes in interest rates or shifts in the tax code.
Net profit margin tells a more complete story about what shareholders ultimately keep. It reflects the burden of debt through interest payments and the impact of tax planning and jurisdictional differences. A company can post a healthy operating margin yet a thin net margin if it carries substantial leverage or faces a high effective tax rate. Conversely, a firm with modest operating profitability might show a respectable net margin thanks to interest income or favorable tax treatment.
Reading the two margins together gives a fuller picture. A wide spread between them points to heavy interest costs or a steep tax burden, prompting questions about capital structure and tax exposure. A narrow spread suggests financing and tax effects are modest. Tracking how each margin moves over time helps distinguish operational trends from financing or tax developments, making the pair far more informative than either metric alone.
Practical Ways Management Can Improve Their Operating Margin
Management teams looking to strengthen operating margin have a range of practical levers available, and the most effective approaches usually combine several of them at once. A sensible starting point is a careful review of operating expenses. This means examining overhead categories such as rent, utilities, administrative salaries, travel, and professional fees to identify areas where spending has drifted beyond what the business genuinely requires. Trimming these costs directly reduces the expenses subtracted from gross profit, so every dollar saved flows straight into operating margin.
Supplier contracts represent another productive area. Many companies renew agreements year after year without testing the market. Renegotiating terms with existing suppliers, consolidating purchases to gain volume discounts, or introducing competitive bids can lower the cost of goods and services embedded in daily operations. These negotiations often yield quick wins because they require no capital investment, only focused attention from procurement staff.
Pricing deserves equal scrutiny. Raising prices modestly, restructuring discount policies, or adjusting the mix toward higher-value offerings can lift revenue without a corresponding rise in operating costs. Even small percentage increases in price can produce meaningful margin improvement, provided the company monitors customer response and competitive positioning.
Automation offers a durable path to lower costs. Replacing repetitive manual tasks in billing, payroll, reporting, and customer service with software reduces labor hours and error rates over time. The initial investment typically pays back within a few quarters as headcount requirements and processing costs decline.
Finally, management should evaluate the product portfolio honestly. Some lines consume disproportionate resources in production, marketing, and support while contributing thin margins. Discontinuing these offerings frees capacity and capital that can be redirected toward stronger performers, raising the blended operating margin. Together, these strategies give leadership a structured toolkit for improving profitability without relying on revenue growth alone.
Frequently Asked Questions
What is operating margin and how is it calculated?
Operating margin is a financial ratio that expresses, as a percentage, how much of each dollar of revenue a company keeps after paying the costs of running its business day to day. It is calculated by dividing operating income—revenue minus operating expenses such as cost of goods sold, wages, rent, marketing, and depreciation—by total revenue.
What does a high operating margin tell you about a company?
A high operating margin suggests strong cost control, pricing power, and operational efficiency. A company that sustains a high operating margin over many years is often protected by some barrier to competition and may benefit from scalability.
Why is a declining operating margin a red flag?
A shrinking operating margin means a smaller portion of each revenue dollar is left after covering the costs of running the business, and it can be an early warning sign of financial distress. Investors should investigate the root causes to determine whether the decline is temporary or structural.
Can you compare operating margin across different industries?
A single economy-wide benchmark for operating margin offers little value because industries differ in their fundamental cost structures. Meaningful comparison is between companies operating under similar cost conditions, facing similar customer expectations, and using similar business models, which is why analysts emphasize sector-based benchmarking.
What is the difference between operating margin and net profit margin?
Operating margin divides operating income by revenue and stops before interest and taxes, isolating the profitability of core operations. Net profit margin divides net income by revenue after interest expense, taxes, and other non-operating items have also been deducted, so the gap captures the combined effect of financing decisions and tax obligations.
How can management improve operating margin?
Management can review and trim operating expenses, renegotiate supplier contracts, adjust pricing and discount policies, automate repetitive manual tasks, and discontinue product lines that consume disproportionate resources while contributing thin margins.