
Payback Period
The payback period is the time required for an investment’s cash inflows to recover its initial cost. For even cash flows, divide the initial investment by annual cash inflow; for uneven flows, accumulate yearly inflows until the cumulative total turns positive, then interpolate the partial year. Shorter periods reduce risk and improve liquidity.
Table of Contents
- Understanding payback period and why short timeframes lower your risk
- The basic payback period formula for predictable cash flows
- Step by step
- What is a good payback period length for small business projects
- Simple versus discounted payback
- How does payback period compare to internal rate of return and net present value
- Common traps when relying only on payback period to make money decisions
- Real world example
Understanding payback period and why short timeframes lower your risk
The payback period measures how long it takes for the cash flows from an investment to recover the initial capital outlay. It is a simple yet powerful metric because it directly addresses a fundamental question: how long will my money be tied up before I get it back? Understanding this timeframe is essential for assessing risk. A shorter payback period means you recoup your investment quickly, which reduces your exposure to uncertainty. The future is inherently unpredictable; the longer your capital is committed, the more opportunities there are for adverse events—economic downturns, technological shifts, regulatory changes, or competitive pressures—to erode returns. By shortening the payback period, you minimize the window during which your investment is vulnerable to these risks.
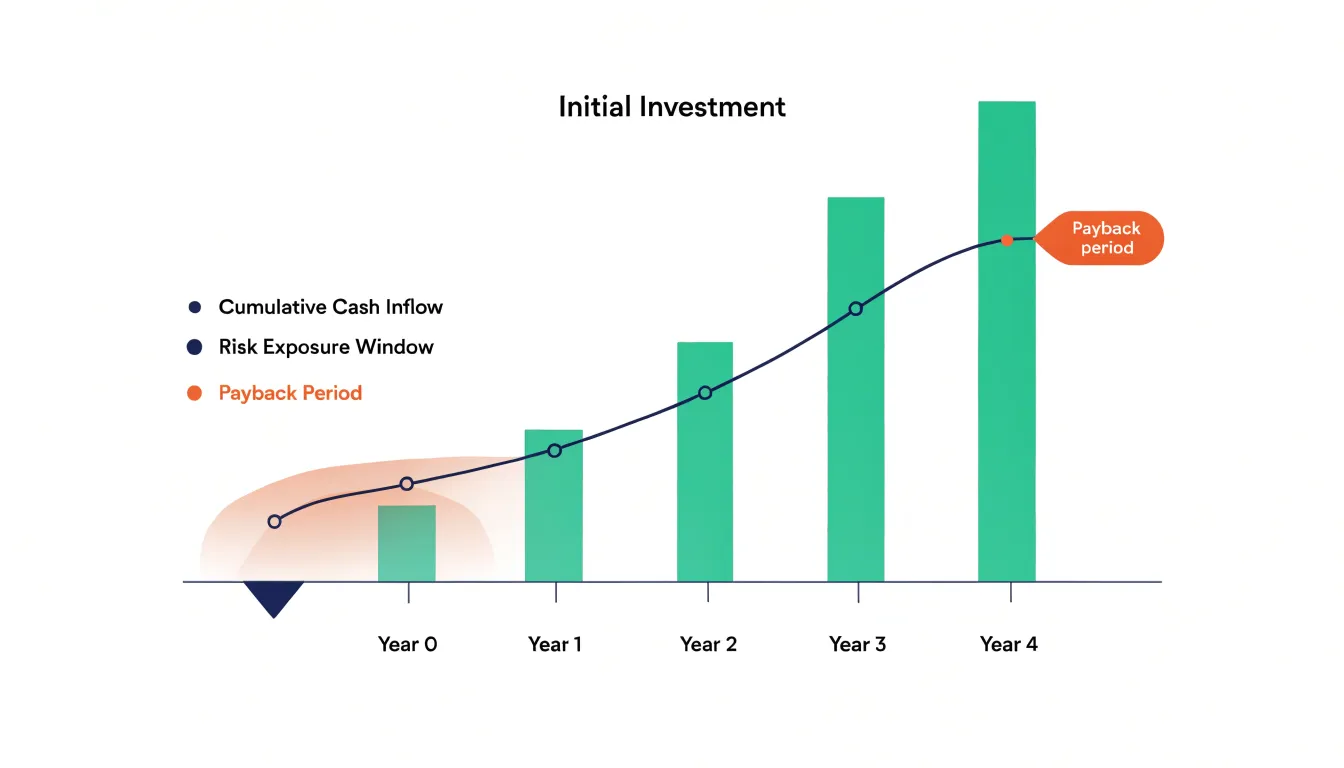
Moreover, a short payback period enhances liquidity. Capital that is returned swiftly can be redeployed into new opportunities or held as a buffer against unexpected expenses. This flexibility is particularly valuable in volatile environments where having cash on hand can be a strategic advantage. In contrast, investments with long payback periods lock up resources, potentially leaving you cash-strapped when needs arise. The payback period thus serves as a risk indicator: the quicker you recover your investment, the lower the risk profile. It acts as a screening tool, helping investors and managers prioritize projects that offer faster returns, all else being equal.
However, it’s important to recognize that payback period alone doesn’t capture the full picture. It ignores cash flows beyond the payback point and the time value of money. Yet, its simplicity and focus on liquidity and risk make it a valuable starting point in capital budgeting. By emphasizing shorter timeframes, you adopt a more conservative stance, safeguarding against the unknown and maintaining financial agility. In essence, a short payback period is a cushion against uncertainty, providing peace of mind and preserving options. Thus, when evaluating investments, considering the payback period alongside other metrics can lead to more resilient financial decisions.
The basic payback period formula for predictable cash flows
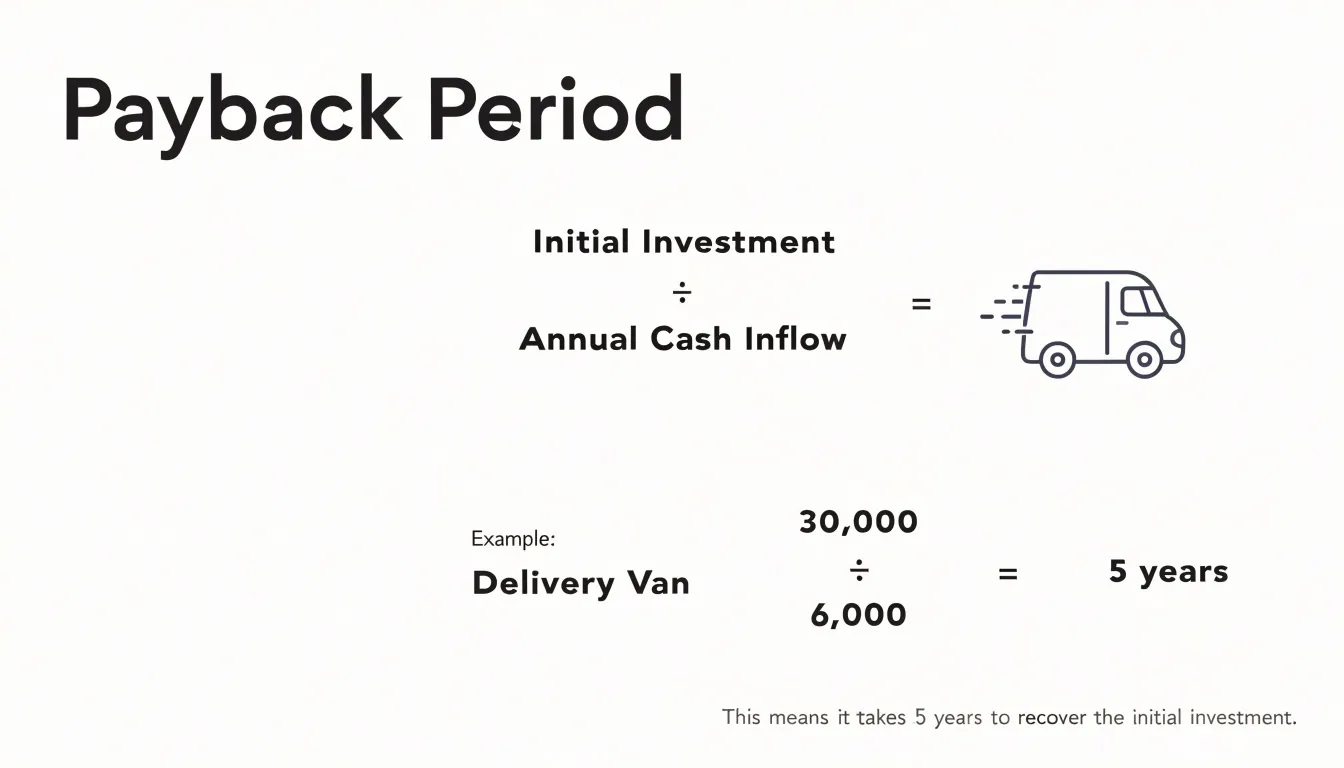
The basic payback period formula for predictable cash flows is a straightforward calculation that answers a simple question: how long does it take for an investment to return its original cost? The formula is initial investment divided by annual cash inflow. You take the amount of money committed at the outset and divide it by the steady amount of cash the investment generates each year. The result is expressed in years, and it tells you the point at which cumulative cash inflows equal the original outlay.
This simple formula applies under a specific set of conditions. The cash flows must be predictable, meaning the annual inflow is expected to remain constant year after year. The initial investment is treated as a single lump sum occurring at the start, and the project or asset is assumed to begin generating cash immediately or within a reasonably short ramp-up period. When these conditions hold, the division gives an accurate payback figure without the need for year-by-year tracking. The formula is most useful for quick screening: it lets an analyst or manager compare several proposals at a glance and discard those that take too long to recover their cost.
A straightforward example makes the mechanics clear. Suppose a small business buys a delivery van for 30,000. The van is expected to generate 6,000 in additional net cash each year after accounting for fuel, maintenance, and insurance. Applying the formula, 30,000 divided by 6,000 equals 5. The payback period is five years. In practical terms, the business recovers the full purchase price of the van by the end of the fifth year, and any cash generated after that point represents a return beyond the initial outlay.
The same logic works for equipment purchases, software subscriptions with fixed annual savings, or any project with a steady annual benefit. The appeal of the formula lies in its simplicity and transparency. Anyone can follow the arithmetic and understand what it means. That clarity makes it a natural starting point before moving to more detailed analysis, such as discounted payback or net present value, which account for the time value of money and uneven cash flow patterns.
Step by step
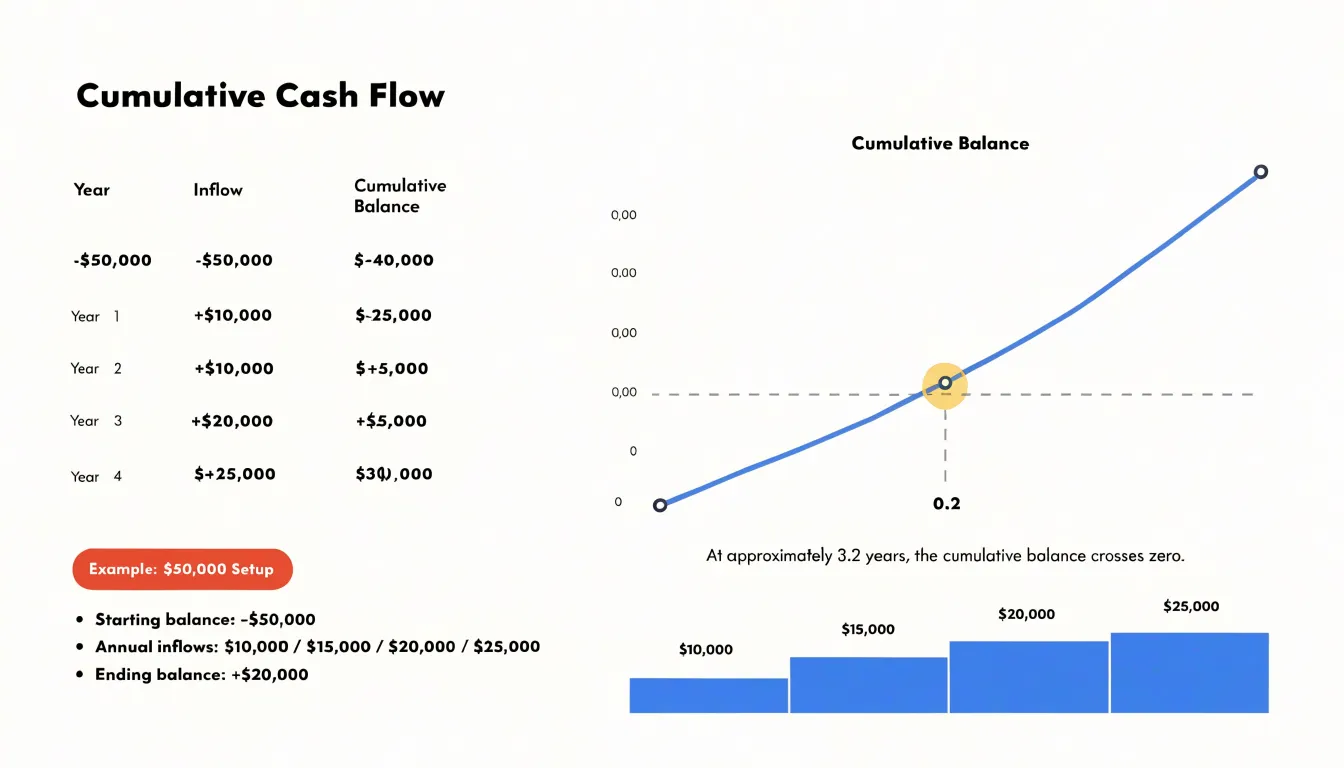
To calculate the payback period when annual returns are uneven, you use the cumulative cash flow method. Start by listing the initial investment as a negative cash flow at time zero. Then list the expected net cash inflow for each year. Next, compute the cumulative cash flow for each year by adding the annual inflow to the previous cumulative total. The payback period occurs in the year when the cumulative cash flow turns from negative to positive. If the cumulative total reaches exactly zero at the end of a year, the payback period is that whole number of years. More often, the cumulative total remains negative through one year and becomes positive during the next, indicating a partial year. To find the fraction of the year, take the absolute value of the cumulative cash flow at the end of the last negative year and divide it by the cash inflow during the following year. Add this fraction to the number of full years before the recovery year.
For example, suppose a project requires an initial investment of $50,000. The annual net cash inflows are $10,000 in year 1, $15,000 in year 2, $20,000 in year 3, and $25,000 in year 4. The cumulative cash flows are: year 0: -$50,000; year 1: -$40,000; year 2: -$25,000; year 3: -$5,000; year 4: +$20,000. The cumulative balance is still negative at the end of year 3, so the payback period falls in year 4. The unrecovered amount at the end of year 3 is $5,000. The cash inflow in year 4 is $25,000. The fraction of year 4 needed to recover the remaining $5,000 is $5,000 / $25,000 = 0.2 years. Therefore, the payback period is 3.2 years. This means the investment is recovered in 3 full years plus 0.2 of the fourth year, or about 3 years and 2.4 months. The same procedure applies to any pattern of uneven returns: accumulate inflows year by year until the cumulative total crosses zero, then interpolate within the crossing year using the unrecovered balance and that year’s inflow.
What is a good payback period length for small business projects
Determining a good payback period for a small business project begins with recognizing that there is no universal number, because acceptable thresholds shift with industry norms, project risk, and the scale of the business itself. Still, several benchmarks and rules of thumb give owners a practical starting point for judgment.
One common rule of thumb for small businesses is that a project should pay back within two to three years, with many owners preferring eighteen months to two years for equipment purchases, technology upgrades, or modest expansions. For lower-cost projects, such as software subscriptions or small marketing initiatives, a payback period of six to twelve months is often considered healthy, since the capital at stake is limited and the recovery window should be short.
Industry norms provide useful context. In manufacturing and logistics, where equipment is expensive and long-lived, payback periods of three to five years are common and generally acceptable. Retail and hospitality businesses, which face thinner margins and faster-changing customer preferences, tend to favor payback periods under two years. Service businesses and professional firms often target twelve to twenty-four months for investments in tools, hiring, or client acquisition systems.
Project risk should adjust these benchmarks. A venture with predictable, contracted revenue can tolerate a longer payback period, while an unproven product line, a new market entry, or a project relying on uncertain demand warrants a shorter target. A useful rule is that the higher the uncertainty, the faster the money should come back, so owners might demand payback within a year for speculative projects and allow three years or more for stable, well-understood investments.
Business size also matters. A sole proprietor with limited cash reserves generally needs faster payback than an established firm with diversified revenue and access to credit. For small businesses, a widely used screening rule is to reject any project whose payback period exceeds roughly half the expected useful life of the asset, ensuring that the investment generates returns well beyond the point at which it has paid for itself.
Finally, payback period works best as a filter rather than a final verdict. Owners should combine it with cash flow forecasts, return calculations, and a clear sense of strategic value, using the benchmarks above to flag projects that recover capital too slowly for the risk involved.
Simple versus discounted payback
The simple payback period measures how long it takes for cumulative cash inflows to equal the initial investment, treating every dollar received in the future as worth exactly one dollar today. This approach is straightforward to calculate and easy to communicate, which explains its popularity as a quick screening tool. Its limitation lies in the implicit assumption that money has no time value: a project recovering its cost in year five is credited with the same nominal inflows regardless of what those dollars will actually be worth when they arrive.
The discounted payback period addresses this by converting each future cash flow into its present value before accumulating the running total. Each inflow is divided by a discount factor reflecting the required rate of return, which incorporates both the opportunity cost of capital and expected inflation. Because discounted inflows are smaller than their nominal counterparts, the cumulative total climbs more slowly, and the payback period extends beyond the simple figure. A project that appears to break even in three years on a simple basis might take four or more years once discounting is applied, with the gap widening as the discount rate rises and as cash flows arrive further in the future.
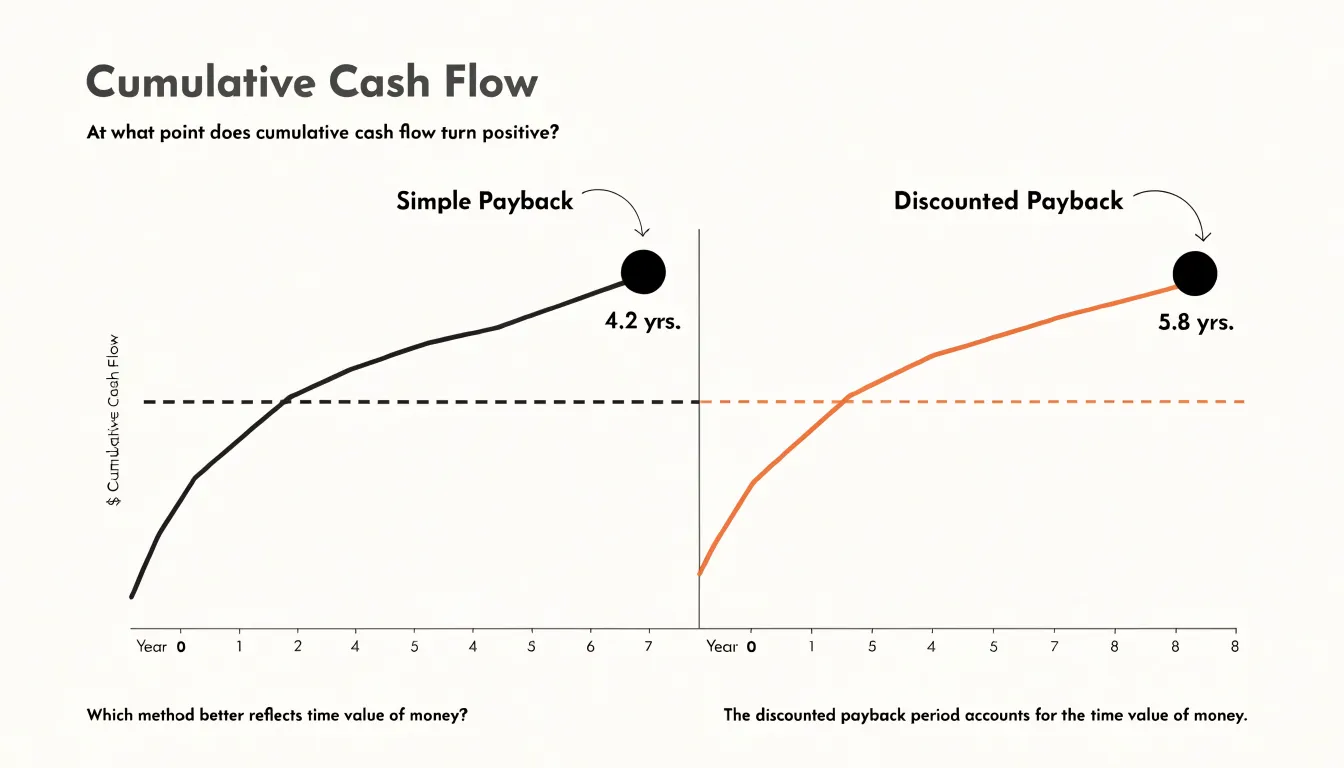
The choice between the two methods depends on the purpose of the analysis. Simple payback works well for rapid, rough comparisons among projects with short horizons and similar risk profiles, or as an initial filter before more rigorous evaluation. Discounted payback suits situations where the cost of capital is significant, where inflation is material, or where cash flows are spread over many years and their timing matters to the decision. It offers a more conservative and economically defensible view of liquidity recovery, since it answers the question of when the investment genuinely repays itself in today’s money.
In practice, many analysts report both figures side by side. The simple calculation conveys intuitive speed of recovery, while the discounted version signals whether the project clears the organization’s hurdle rate within an acceptable window. Presenting the two together gives decision-makers a fuller picture: one number shows the nominal timeline, the other shows the timeline adjusted for the real cost of waiting.
How does payback period compare to internal rate of return and net present value
The payback period offers a straightforward measure of how quickly an investment recovers its initial cost. To appreciate its role, it helps to compare it with two other widely used metrics: internal rate of return (IRR) and net present value (NPV). Each method brings a distinct perspective on investment viability, and understanding their relative strengths and weaknesses clarifies why payback period is most effective when used alongside them.
Payback period is praised for its simplicity and intuitive appeal. It answers a fundamental question: how long will it take to get the money back? This makes it particularly useful for firms with tight liquidity or for screening projects where rapid recoupment is essential. However, payback period has notable limitations. It ignores the time value of money, treating cash flows in later years as equal to those in earlier years. It also disregards all cash flows beyond the payback point, potentially overlooking long-term profitability. As a result, payback period can favor short-term projects that may not maximize value.
In contrast, net present value (NPV) accounts for the time value of money by discounting future cash flows to their present value. NPV directly measures the expected increase in shareholder wealth, making it a theoretically sound criterion: a positive NPV indicates that the project adds value. Its weakness lies in the need for an accurate discount rate and its absolute dollar output, which can be difficult to interpret when comparing projects of different scales.
Internal rate of return (IRR) also incorporates the time value of money, representing the discount rate that makes NPV zero. IRR is often preferred by managers because it is expressed as a percentage, facilitating comparison with hurdle rates. Nonetheless, IRR can be problematic: it may produce multiple or no solutions for unconventional cash flows, and it assumes reinvestment at the IRR itself, which may be unrealistic. For mutually exclusive projects, IRR can also rank projects incorrectly when scale or timing differs.
Each method thus has distinct strengths: payback emphasizes liquidity and risk, NPV focuses on value creation, and IRR offers a intuitive return measure. Their weaknesses are complementary. Payback period should be used alongside IRR and NPV to provide a comprehensive view. Payback quickly assesses risk and liquidity, while NPV and IRR ensure that the project’s long-term profitability and time value of money are not overlooked. By combining these metrics, decision-makers can balance short-term cash recovery with long-term value maximization, leading to more informed investment choices.
Common traps when relying only on payback period to make money decisions
The payback period carries an appealing simplicity: you divide the initial outlay by the annual cash inflow, and a single number tells you how quickly your money comes back. That simplicity is exactly where the traps begin. The most common pitfall is the cutoff effect. Once an investment has crossed the payback line, the calculation stops paying attention. A project that returns its cost in three years and then produces nothing for a decade looks identical to one that returns its cost in three years and then generates strong cash flows for another fifteen. Decisions made on payback alone systematically favor investments that recover quickly and quietly disregard the long, productive tail that often represents most of the value.
A second trap is the silent assumption that a dollar received in year four is worth the same as a dollar spent today. Payback period treats all cash flows as if they occur on the same footing, ignoring that distant receipts carry more risk and less purchasing power. Two projects with identical payback timelines can have very different values once discounting is applied, and the one that looks superior on a simple payback basis may be the weaker choice in present-value terms. Building a discounted payback calculation into your analysis, where each inflow is adjusted for the cost of capital before being counted against the outlay, closes much of this gap.
A third trap is behavioral. Payback rewards speed, and speed is emotionally satisfying, particularly for managers who are evaluated on short reporting cycles. This creates a bias toward quick wins and against ventures whose returns arrive later, even when those ventures create far more wealth. The discipline that guards against this is to treat payback as a screening tool rather than a verdict, always pairing it with a discounted cash flow measure such as net present value or internal rate of return.
Practical safeguards follow from these pitfalls. Define a maximum acceptable payback as a liquidity filter, then evaluate surviving candidates on their full stream of discounted cash flows. Extend your analysis horizon beyond the payback point and explicitly model the post-payback years. Finally, document why a longer payback was accepted, so that short-term pressure does not quietly override sound analysis.
Real world example
Consider a small manufacturing company that is evaluating whether to purchase a new piece of automated packaging equipment. The machine costs $120,000, including installation and setup. Management estimates that the equipment will reduce labor costs by $35,000 per year and cut material waste by another $10,000 annually, giving total expected annual savings of $45,000. The first step in calculating the payback period is to divide the initial investment by the annual net cash savings: $120,000 divided by $45,000 equals approximately 2.67 years. This figure tells the company how long it will take for the cumulative savings to equal the original outlay.
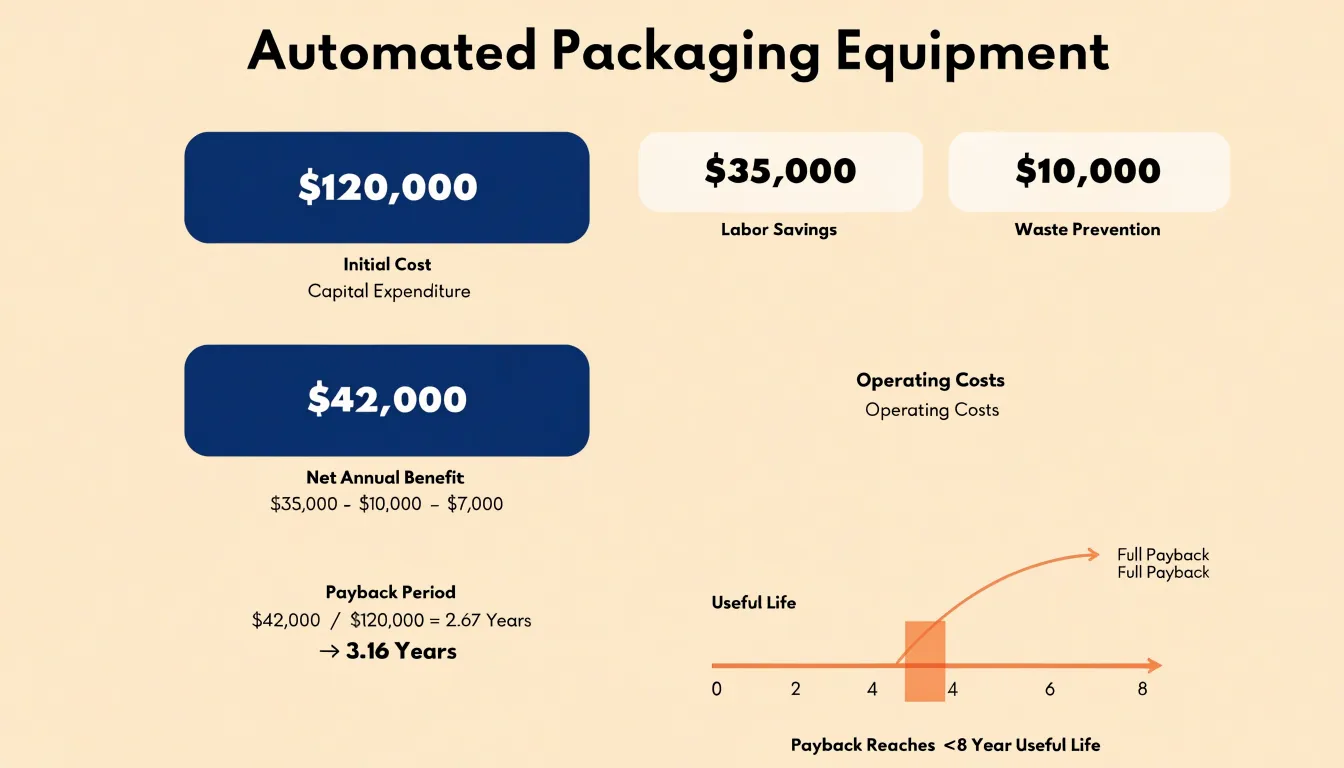
The calculation becomes more useful when the company adjusts for ongoing costs. Suppose the equipment requires $5,000 per year in maintenance and consumes an additional $2,000 in electricity. Net annual savings then fall to $38,000, and the payback period rises to roughly 3.16 years. Reviewing this figure alongside the equipment’s expected useful life of eight years shows that savings continue to accumulate for nearly five years after the investment is recovered. The company can also compare the 3.16-year payback with its own hurdle, such as requiring recovery within four years, to decide whether the purchase meets internal policy.
Interpreting the result requires some care. A payback period of just over three years indicates a relatively quick return, which reduces the risk that the investment will be stranded by changing technology or market conditions. The measure, however, ignores the time value of money and any cash flows that occur after the break-even point. A company might therefore also discount the annual savings or extend the analysis into a full net present value calculation. Even so, this example shows how a straightforward division, followed by realistic adjustments for operating costs, converts a large capital outlay into a clear timeline that managers can weigh against alternatives and against the strategic need for the equipment.
Frequently Asked Questions
What does payback period mean?
The payback period measures how long it takes for the cash flows from an investment to recover the initial capital outlay. A shorter payback period means you recoup your investment quickly, reducing exposure to uncertainty and enhancing liquidity.
How do I calculate payback period with steady cash flows?
For predictable cash flows, divide the initial investment by the annual cash inflow. The result is expressed in years and tells you when cumulative cash inflows equal the original outlay.
How do you calculate payback period when cash flows are uneven?
List the initial investment as a negative cash flow, add each year’s net cash inflow to get cumulative cash flow, and find the year when cumulative cash flow turns positive. If it crosses during a year, divide the unrecovered amount at the end of the last negative year by that year’s cash inflow and add the fraction to the full years before recovery.
What is a good payback period for a small business?
There is no universal number; acceptable thresholds depend on industry norms, project risk, and business scale. A common small-business rule is two to three years, with many owners preferring 18 months to two years for equipment, technology upgrades, or modest expansions, and six to twelve months for lower-cost projects. Higher uncertainty generally calls for faster payback, while stable investments can tolerate longer periods.
What is the difference between simple and discounted payback?
Simple payback treats every future dollar as worth one dollar today, while discounted payback converts each future cash flow to present value using a discount factor that reflects the required rate of return. Because discounted inflows are smaller, the discounted payback period extends beyond the simple figure.
Why shouldn’t you use payback period by itself?
Payback period is useful for liquidity and risk screening, but it ignores the time value of money and all cash flows beyond the payback point, so it can favor short-term projects that may not maximize value. It should be used alongside NPV or IRR rather than as a final verdict.