
Quick Ratio vs Current Ratio
The quick ratio measures a company’s ability to cover current liabilities using only its most liquid assets—cash, marketable securities, and receivables—excluding inventory and prepaid expenses. The current ratio divides all current assets by current liabilities, including inventory. A quick ratio of 1.0 or higher is generally considered healthy, while the current ratio typically ranges from 1.5 to 2.0.
Table of Contents
- Understanding liquidity and why short term debt health matters
- What the current ratio measures on a business balance sheet
- Current ratio calculation
- What the quick ratio leaves out and why inventory matters
- Quick ratio calculation
- Key differences between the two liquidity metrics
- What is a healthy target number for each metric
- Sector comparisons
- How to use both ratios together to spot hidden financial risks
Understanding liquidity and why short term debt health matters
Liquidity describes a company’s capacity to convert its assets into cash quickly enough to satisfy obligations falling due within the next twelve months. Those obligations include accounts payable to suppliers, short-term loans and the current portion of long-term debt, accrued wages, taxes, and other operating expenses that come due in the ordinary course of business. The assets that stand against them are similarly short-dated: cash on hand, marketable securities, and receivables expected to be collected within the year. When analysts assess liquidity, they are essentially asking whether the cash and near-cash resources available over the coming year are sufficient to cover the claims that will mature over that same period. The question is one of timing as much as of total amount, since a company can hold substantial wealth in property, plant, and equipment while still lacking the funds to pay next month’s payroll.
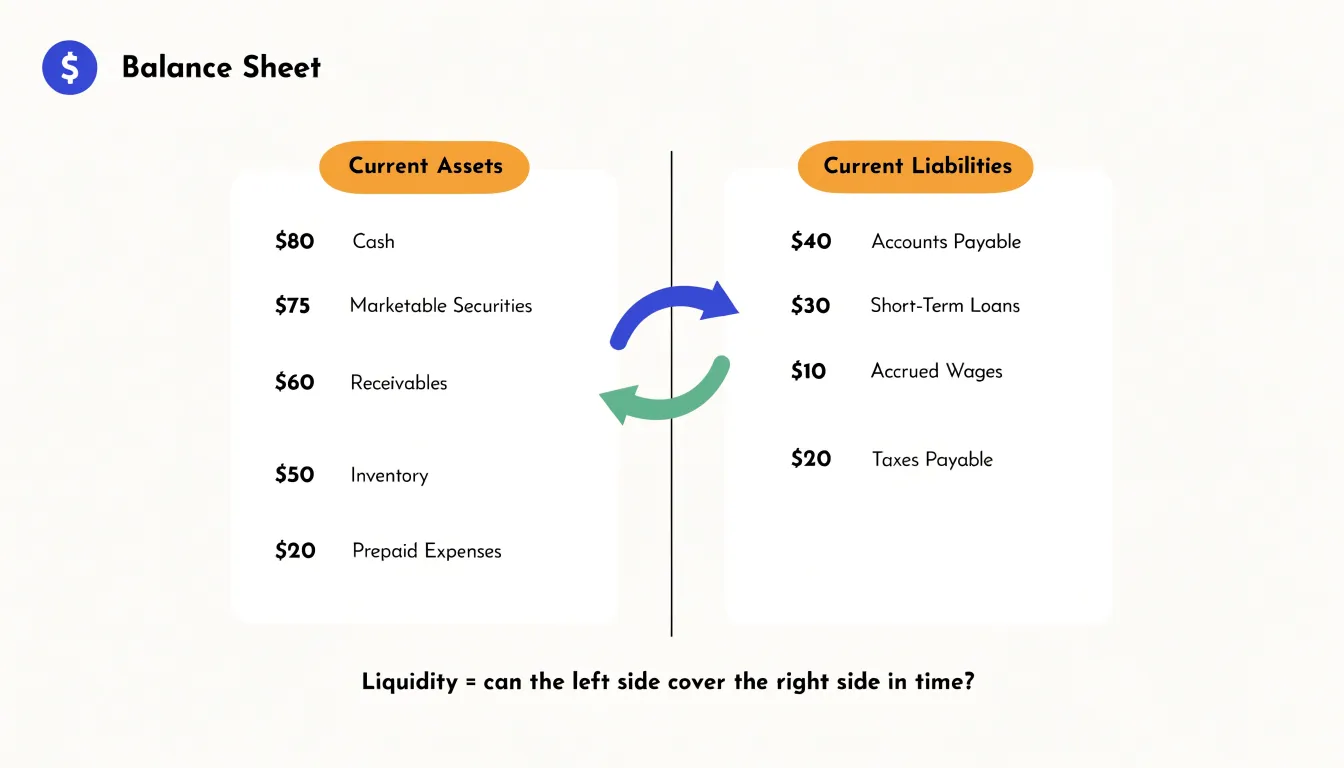
Short-term debt health matters because failure in this area can bring down a business that is otherwise sound. A company may report consistent profits, hold valuable assets, and serve a growing customer base, yet still face insolvency if it cannot marshal cash on the day a payment falls due. Suppliers who are not paid may withhold deliveries, disrupting operations. Lenders who see missed interest or principal payments may accelerate repayment terms or refuse to roll over credit lines. Employees who are not paid on time may leave. Each of these reactions compounds the original shortfall, and the spiral can move quickly from a single missed payment to a full-blown crisis.
Profitability on an accrual basis offers limited protection here, because accounting profit recognizes revenue when it is earned rather than when cash arrives. A company can book healthy sales while its customers take months to pay, leaving a gap between outgoing obligations and incoming receipts. That gap is precisely what liquidity analysis is designed to expose. Strong short-term debt health gives a business the flexibility to absorb shocks such as a delayed customer payment, a sudden rise in input costs, or a temporary dip in demand without having to sell assets at a discount or seek emergency financing on unfavorable terms. It also supports bargaining power with suppliers and lenders, since counterparties prefer to deal with firms that pay reliably. For these reasons, the metrics that gauge whether current obligations can be met from current resources sit at the center of credit analysis and everyday financial management alike.
What the current ratio measures on a business balance sheet
The current ratio is a liquidity measure drawn directly from the balance sheet, and it compares a company’s total current assets to its total current liabilities. Current assets are the resources a business expects to convert into cash, sell, or consume within one operating cycle, typically a year. This category includes cash, marketable securities, accounts receivable, inventory, and prepaid expenses. Current liabilities are the obligations due within the same window, such as accounts payable, short-term debt, accrued wages, taxes payable, and the current portion of long-term debt. Dividing total current assets by total current liabilities produces a single figure that summarizes whether the resources on hand cover the bills coming due.
A result above 1.0 indicates that current assets exceed current liabilities. For example, a ratio of 1.5 means the company holds $1.50 in current assets for every $1.00 of obligations due within the year. That cushion suggests the business can meet its near-term commitments from assets it already controls, which is generally reassuring to creditors, suppliers, and lenders. The margin matters because some current assets, particularly inventory and receivables, may take time to convert into cash, and a comfortable buffer absorbs delays in collection or unexpected expenses.
A result below 1.0 signals the opposite condition: current liabilities outweigh current assets. A ratio of 0.8 means the company has $0.80 of current assets available for each $1.00 of near-term obligations. This points to potential strain, because the business may need to rely on incoming cash flow, renewed credit lines, or asset sales to settle its bills on time. For a small or growing company, a below-1.0 ratio can reflect aggressive use of supplier credit or seasonal timing rather than distress. Still, it warrants scrutiny of the composition of assets and the timing of liabilities.
The ratio itself provides a quick snapshot rather than a definitive verdict. Analysts interpret it alongside trends over time, industry norms, and the quality of the underlying assets. Reading the current ratio correctly means understanding which assets are genuinely liquid and which obligations fall due first, since that combination determines whether the company can pay its upcoming bills.
Current ratio calculation
To see how the current ratio works in practice, consider a sample balance sheet for a fictional retailer, Harbor Lane Supplies, at the close of its fiscal year. The current assets section lists cash of $40,000, short-term investments of $15,000, accounts receivable of $60,000, inventory of $85,000, and prepaid expenses of $10,000. Adding these line items together gives total current assets of $210,000. On the other side of the balance sheet, the current liabilities section shows accounts payable of $50,000, a short-term loan of $30,000, accrued wages of $15,000, and taxes payable of $10,000, for total current liabilities of $105,000. With both totals in hand, the calculation is straightforward: divide current assets by current liabilities, or $210,000 divided by $105,000, which yields a current ratio of 2.0.
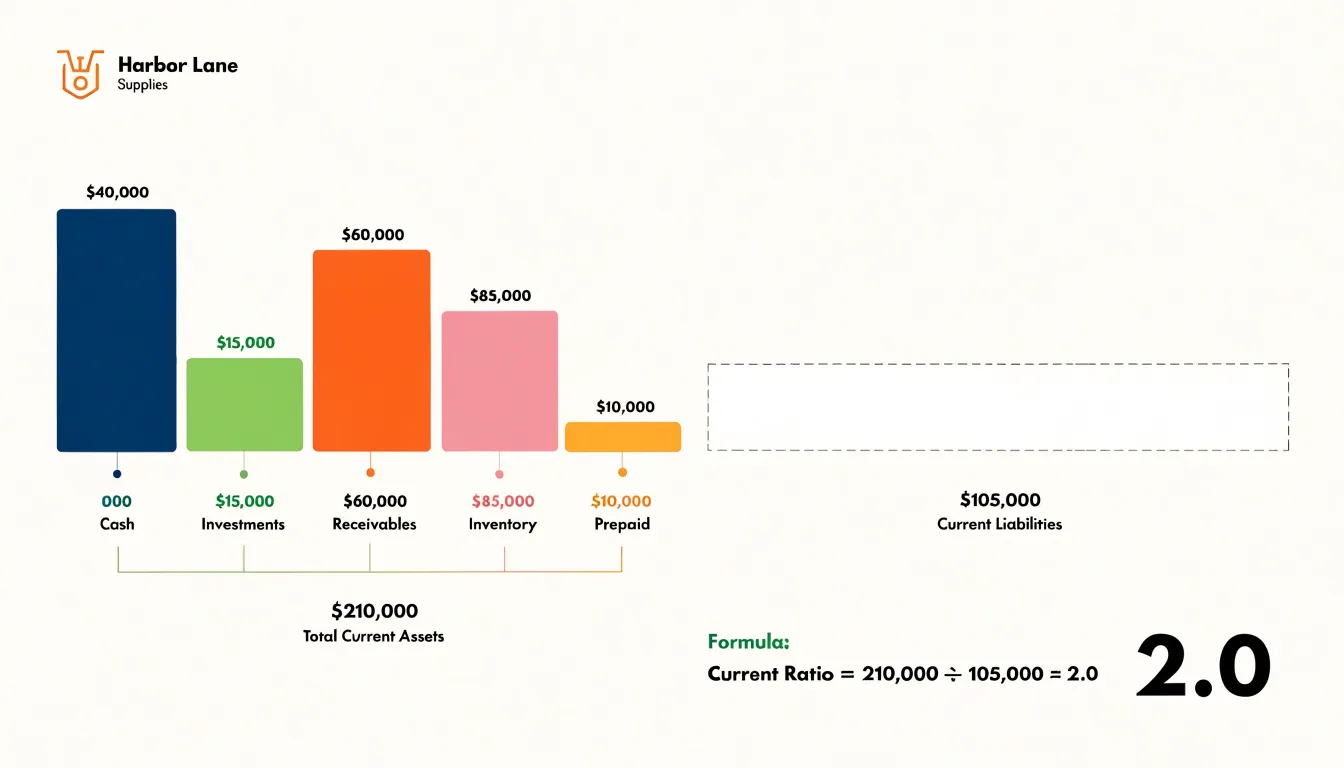
Interpreting that result requires a bit of context. A ratio of 2.0 means Harbor Lane holds two dollars of current assets for every dollar of obligations coming due within the year. On its face, that suggests a comfortable liquidity cushion, giving the company room to absorb a slowdown in cash collections or an unexpected expense without straining to meet its near-term debts. A ratio in this range is often read as a sign of financial stability, particularly for a business with predictable sales cycles.
The interpretation also depends on the composition of those assets. Inventory makes up a large share of Harbor Lane’s current assets, and inventory can take time to convert into cash, so the headline ratio of 2.0 may overstate how quickly the company could actually pay its bills if all liabilities came due at once. Analysts often look at the mix of cash, receivables, and inventory alongside the ratio itself to understand the quality of the liquidity behind it.
Running the calculation step by step on a real balance sheet shows how a single number summarizes a company’s short-term financial position, while also pointing to the details that give that number its meaning. The same method applied to successive periods lets an analyst track whether liquidity is improving or eroding over time.
What the quick ratio leaves out and why inventory matters
The quick ratio deliberately excludes inventory and prepaid expenses from its calculation, focusing instead on cash, marketable securities, and receivables—assets that can be converted to cash quickly. This exclusion is rooted in the practical realities of liquidation: inventory often takes time to sell, may require discounts to move, and its value can fluctuate based on market conditions. Prepaid expenses, such as insurance premiums or rent paid in advance, represent future benefits rather than cash, and they cannot be easily converted into cash without cancelling the underlying service. By leaving out these items, the quick ratio provides a stricter test of a company’s ability to meet short-term obligations using its most liquid resources.
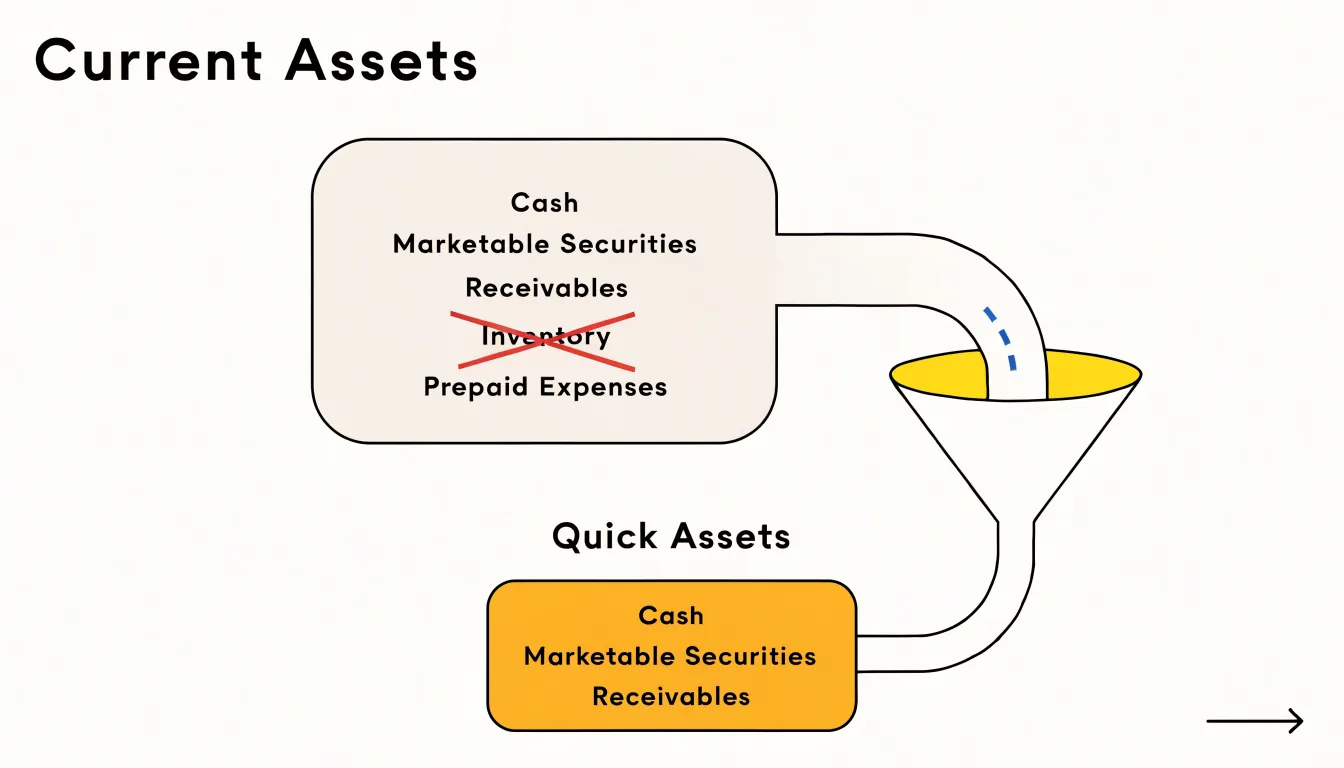
Inventory matters because it is a major component of current assets for many businesses, particularly retailers and manufacturers. However, its inclusion in the current ratio can inflate the appearance of liquidity. A company might hold large amounts of inventory that are slow-moving or obsolete, which would not generate cash quickly if needed. The quick ratio acknowledges this risk by excluding inventory entirely, forcing a focus on assets that are readily available to pay bills. This is especially relevant for companies with long inventory turnover periods, where cash is tied up in goods that may take months to sell.
Prepaid expenses are also excluded for similar reasons: they are not cash and cannot be used to settle debts directly. While they represent value, they are typically small relative to other current assets and do not contribute to immediate liquidity. The quick ratio’s stricter approach helps stakeholders assess whether a company can survive a sudden cash crunch without relying on selling inventory or liquidating prepaid assets. In essence, the quick ratio answers a more conservative question: can the company pay its short-term liabilities with assets that are already cash or can be turned into cash almost immediately? This makes it a valuable complement to the current ratio, offering a clearer picture of financial resilience.
Quick ratio calculation
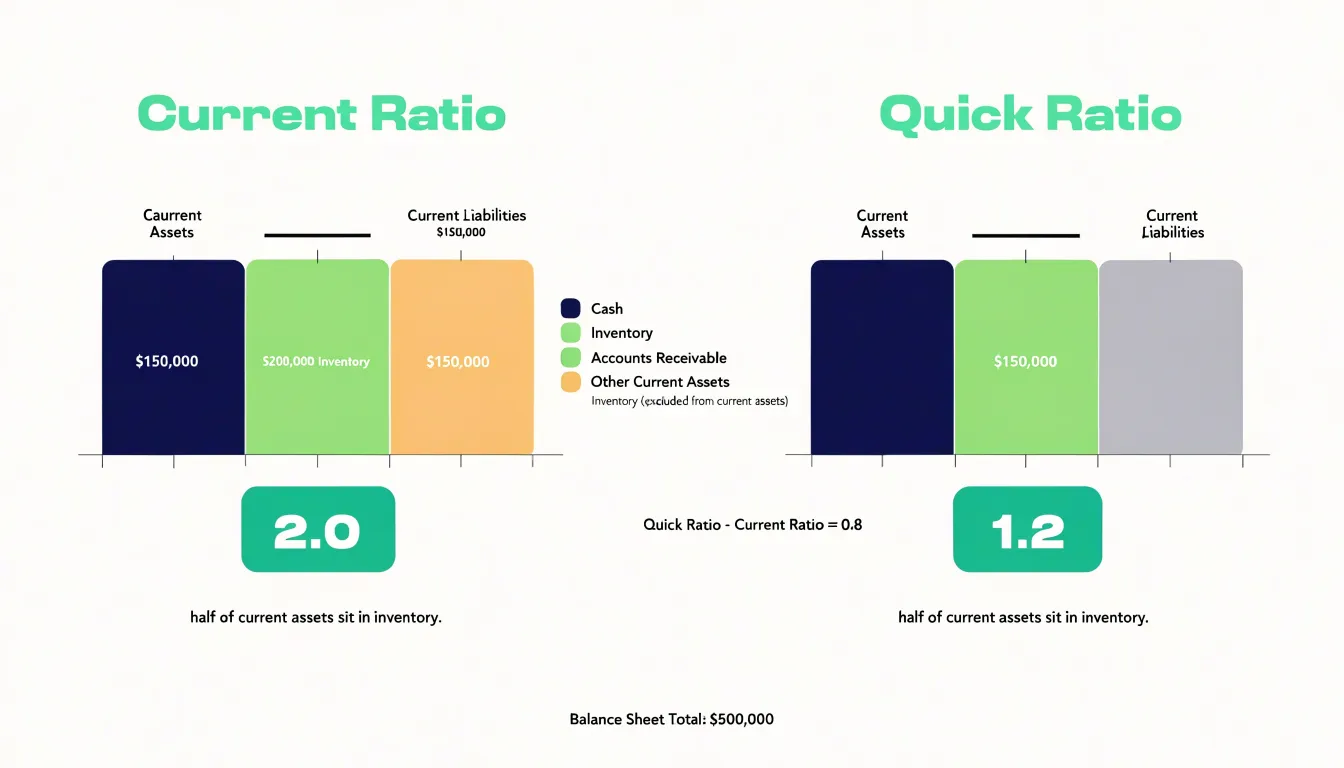
The quick ratio formula strips the current ratio down to its most liquid components. It is expressed as cash plus marketable securities plus receivables, all divided by current liabilities. Each item in the numerator represents value that can be converted to cash within a short window, typically ninety days or less. Cash is already available. Marketable securities, such as Treasury bills or money market instruments, trade in active markets and can be sold quickly at predictable prices. Receivables reflect amounts owed by customers, generally collected within standard payment terms. Inventory and prepaid expenses are excluded because they carry more uncertainty. Inventory may take months to sell, may require discounting, and may not recover its recorded book value. Prepaid expenses represent services already paid for, such as insurance premiums, and cannot be converted into cash at all. Removing these slower assets gives a clearer picture of a company’s immediate ability to cover obligations. To illustrate, consider the same example company used for the current ratio comparison. Suppose it reports current assets of 500,000, comprising 100,000 in cash, 50,000 in marketable securities, 150,000 in receivables, and 200,000 in inventory. Current liabilities total 250,000. The current ratio would be 2.0, calculated as 500,000 divided by 250,000. Applying the quick ratio formula produces a markedly different result. The numerator becomes 100,000 plus 50,000 plus 150,000, which equals 300,000. Dividing 300,000 by 250,000 gives a quick ratio of 1.2. The gap between 2.0 and 1.2 is meaningful. Half of the company’s current assets sit in inventory, value that depends on customer demand and pricing conditions. The quick ratio shows that the company holds 1.20 in highly liquid assets for every 1.00 of near-term obligations, a comfortable but far less generous cushion than the current ratio suggests. Running both calculations side by side on the same balance sheet lets analysts see how much of a company’s liquidity position rests on inventory. A large divergence between the two ratios signals that inventory is a significant share of current assets, which warrants closer examination of turnover rates and obsolescence risk.
Key differences between the two liquidity metrics
The current ratio and the quick ratio both measure a company’s ability to cover short-term obligations, yet they diverge in the assets they count and the level of safety they demand. The current ratio takes the broadest view of liquidity. It divides all current assets, including cash, marketable securities, accounts receivable, inventory, and prepaid expenses, by current liabilities. Because inventory and prepaid costs often make up a substantial portion of a company’s working capital, the current ratio captures the full resources on hand to meet near-term debts. The quick ratio, sometimes called the acid-test ratio, narrows the picture. It strips out inventory and prepaid expenses, counting only cash, cash equivalents, marketable securities, and accounts receivable. The reasoning rests on the reality that inventory can take time to sell and may sell below book value, and prepaid expenses represent services already paid for that cannot be converted into cash to satisfy creditors.
The result is a meaningful difference in strictness. A current ratio of 2.0 might suggest ample coverage, yet if half of those current assets sit in slow-moving inventory, the company’s true short-term position could be far weaker than the headline figure implies. The quick ratio exposes this gap by excluding the assets least certain to convert into cash quickly. For this reason, the quick ratio functions as a more conservative test of liquidity, while the current ratio offers a broader, more forgiving measure of working capital adequacy.
Each metric suits different contexts. The current ratio works well for businesses with predictable inventory turnover and stable sales cycles, where stock reliably converts to cash within the operating cycle. Retailers with fast-moving goods or manufacturers with dependable order books can rely on the current ratio as a reasonable gauge. The quick ratio proves more appropriate for industries where inventory is illiquid or valuation is uncertain, such as construction, heavy equipment, or businesses holding large work-in-progress balances. Lenders and analysts often favor the quick ratio when assessing credit risk because it focuses on assets that can be tapped immediately. Used together, the two ratios give a layered view: the current ratio shows overall working capital strength, while the quick ratio reveals how well the company could weather a sudden call on its obligations.
What is a healthy target number for each metric
When evaluating liquidity, benchmarks provide a starting point for interpreting the current and quick ratios. A current ratio between 1.5 and 2.0 is often cited as healthy because it suggests a company has enough short-term assets to cover its short-term liabilities with a cushion. A quick ratio of 1.0 or higher is generally considered satisfactory, indicating that the most liquid assets—cash, marketable securities, and receivables—can fully cover current liabilities without relying on inventory. These ranges serve as general guidelines, but they are not universal targets.
Ideal levels vary significantly by industry and business model. For instance, retailers and manufacturers typically carry substantial inventory, which can inflate the current ratio while the quick ratio remains lower. A quick ratio below 1.0 may be normal in these sectors if inventory turns quickly and receivables are reliable. Conversely, service-based businesses often have minimal inventory, so their current and quick ratios tend to be closer together, and a quick ratio near 1.0 is more typical. Companies with highly predictable cash flows, such as utilities, may operate comfortably with lower ratios, while firms in volatile industries might need higher buffers.
Business model also plays a role. A subscription-based software company with recurring revenue and low physical inventory might maintain a current ratio below 1.5 yet still be financially healthy because of consistent cash generation. A project-based construction firm, on the other hand, might require a higher current ratio to manage uneven cash flows and large payables. Seasonal businesses often see ratios fluctuate throughout the year, so a single snapshot may not reflect true liquidity.
Analysts should therefore compare a company’s ratios to its industry peers and its own historical trends rather than relying solely on absolute benchmarks. A ratio that appears low relative to the general guideline might be perfectly appropriate for the industry, while a high ratio could indicate inefficient use of assets. Understanding the context—inventory turnover, receivables collection, and cash flow patterns—is essential for a meaningful assessment. Ultimately, healthy target numbers are a reference point, and the ideal level depends on the specific circumstances of the business.
Sector comparisons
Sector comparisons reveal why retail and technology companies present such different liquidity profiles, and understanding these structural differences is essential when interpreting ratio analysis. Retail businesses depend on inventory as a core operating asset. A grocery chain, department store, or electronics retailer must maintain substantial stock on shelves and in warehouses to meet customer demand, and this inventory sits on the balance sheet as a current asset. Because current assets include inventory, retailers naturally report higher current ratios than businesses carrying little or no stock. A retailer might show a current ratio of 1.8 or 2.0 largely because inventory accounts for a large share of current assets. This does not necessarily signal superior liquidity, since inventory must still be sold and converted into cash, which can take weeks or months.
Technology firms operate under a different asset structure. Software companies, cloud providers, and digital platforms typically hold minimal inventory. Their current assets consist mainly of cash, short-term investments, and receivables, while their current liabilities include payables, accrued expenses, and deferred revenue. An asset-light tech company might comfortably operate with a current ratio of 1.1 or 1.2 because its assets convert to cash quickly and predictably. Judging such a company against a retailer’s 2.0 ratio would misrepresent its financial position, since the composition of current assets differs so fundamentally.
The quick ratio sharpens this distinction by excluding inventory from the numerator. For retailers, the quick ratio is often markedly lower than the current ratio, sometimes falling below 1.0, because inventory dominates the current asset base. For tech firms, the quick ratio typically sits close to the current ratio, since inventory is negligible. Comparing quick ratios across sectors still requires care, but the metric offers a cleaner view of immediate liquidity for inventory-heavy businesses.
The practical takeaway is that ratio analysis gains meaning through industry context. Analysts should benchmark a company against peers in the same sector, where asset structures, operating cycles, and working capital norms are similar. Cross-industry comparisons can highlight interesting differences, but they rarely support sound conclusions about relative liquidity or financial health on their own.
How to use both ratios together to spot hidden financial risks
Reading the current ratio and the quick ratio side by side gives analysts a far richer picture of liquidity than either measure provides alone. The current ratio counts inventory, prepaid expenses, and other current assets in the numerator, while the quick ratio strips inventory out and keeps only cash, marketable securities, and receivables. The distance between the two figures is therefore a direct measure of how much of a company’s short-term liquidity depends on selling inventory. When that gap is wide, a business is leaning heavily on stock to meet its obligations, and any slowdown in demand, spoilage, obsolescence, or a price war that forces markdowns can convert that inventory into far less cash than the balance sheet implies.
Analysts can turn that observation into a practical diagnostic. Compute both ratios for the same period and track the spread between them quarter after quarter. A current ratio holding steady at, say, 2.0 while the quick ratio slides from 1.4 to 0.9 tells a specific story: inventory is quietly accumulating as a share of current assets, and the company’s genuine near-term cushion is shrinking even though the headline number looks unchanged. That pattern frequently precedes write-downs, margin compression, or a scramble for short-term credit. The reverse movement, where the quick ratio rises toward the current ratio, suggests inventory is being converted into cash and receivables, which is generally a healthy sign.
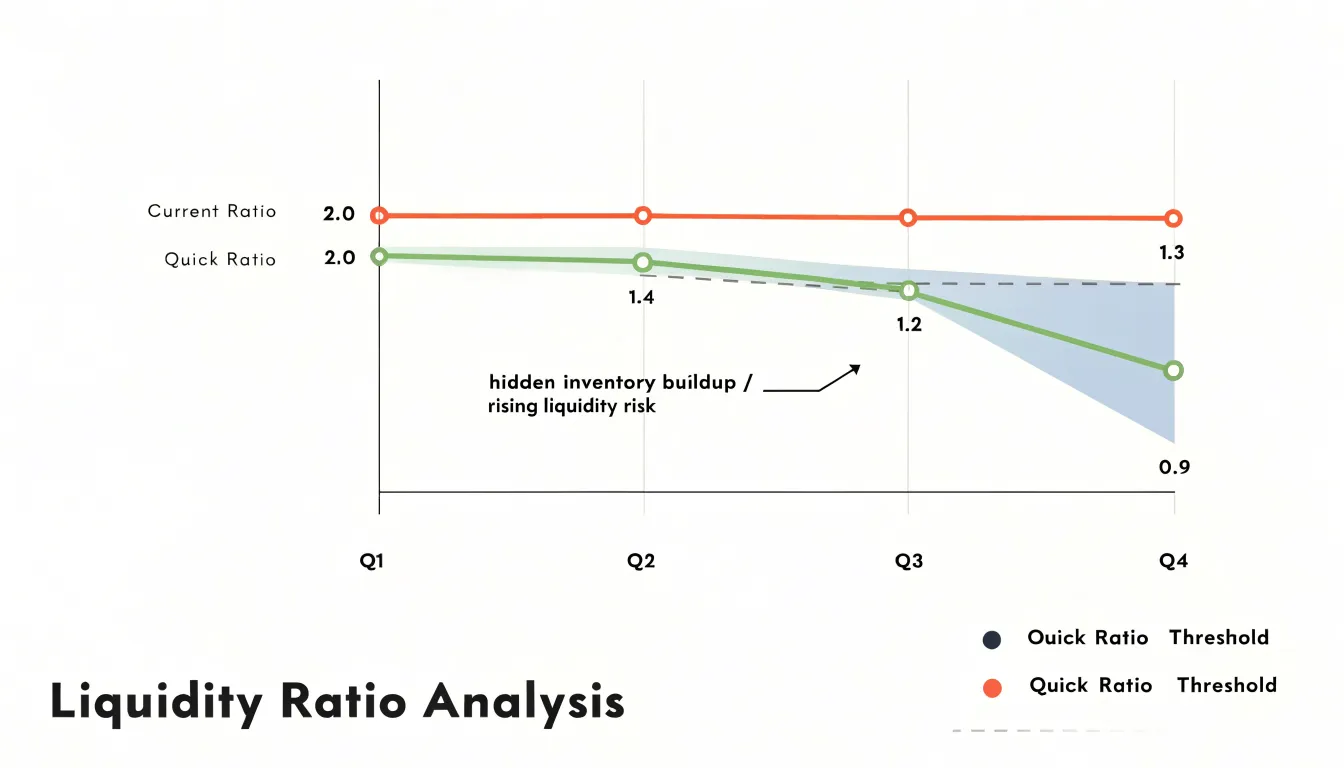
The absolute levels also matter alongside the trend. A quick ratio well below 1.0 combined with a current ratio above 2.0 describes a company that may be technically liquid on paper but dangerously dependent on turnover speed. If inventory days are lengthening at the same time, the risk is compounding. Conversely, a low current ratio paired with an equally low quick ratio points to a weak cash position across the board, with few buffers of any kind. Watching both metrics over several periods, rather than at a single point, distinguishes a seasonal build from a structural deterioration, because genuine liquidity problems show up as a persistent widening of the gap or a steady erosion of the quick ratio while the current ratio masks the decline.
Frequently Asked Questions
What is the difference between the current ratio and the quick ratio?
The current ratio divides all current assets by current liabilities, including inventory and prepaid expenses. The quick ratio strips out inventory and prepaid expenses and counts only cash, marketable securities, and receivables, making it a more conservative liquidity test.
What does a current ratio below 1 mean?
A current ratio below 1 means current liabilities outweigh current assets; for example, a ratio of 0.8 means the company has $0.80 of current assets for each $1.00 of near-term obligations. This can point to potential strain, though for a small or growing company it can reflect aggressive use of supplier credit or seasonal timing rather than distress.
Why does the quick ratio exclude inventory and prepaid expenses?
The quick ratio excludes inventory because inventory can take time to sell, may require discounts to move, and its value can fluctuate. It excludes prepaid expenses because they represent future benefits rather than cash and cannot be easily converted into cash.
How do you calculate the quick ratio?
The quick ratio is calculated as cash plus marketable securities plus receivables, all divided by current liabilities. Inventory and prepaid expenses are left out of the numerator.
What is considered a healthy current ratio and quick ratio?
A current ratio between 1.5 and 2.0 is often cited as healthy, while a quick ratio of 1.0 or higher is generally considered satisfactory. These are general guidelines, and ideal levels vary significantly by industry and business model.
Why should the current ratio and quick ratio be used together?
Reading the current ratio and quick ratio side by side gives a richer picture of liquidity than either measure alone. The gap between them shows how much of a company’s short-term liquidity depends on selling inventory, and tracking the spread can help spot hidden risks.