
Return on Assets (ROA)
Return on assets (ROA) is a profitability ratio calculated by dividing net income by total assets, showing how many cents of profit each dollar of assets generates. A higher ROA indicates more efficient asset use. Because capital intensity varies by industry, ROA is most meaningful when compared against direct peers, the company’s own history, and its cost of capital.
Table of Contents
- Understanding Return on Assets and Why Asset Efficiency Matters
- The Return on Assets Formula
- Step-by-Step Walkthrough for Calculating Return on Assets Using Real Balance Sheets
- What Is a Good Return on Assets Ratio for a Business?
- How Industry Differences Impact What Counts as a High Return on Assets
- Return on Assets vs Return on Equity
- Using DuPont Analysis to Uncover the Drivers Behind Return on Assets
- Common Limitations of Return on Assets That Can Mislead Investors
- Practical Strategies Companies Use to Improve Asset Efficiency
Understanding Return on Assets and Why Asset Efficiency Matters
Return on assets measures how effectively a company converts the resources on its balance sheet into profit. The ratio divides net income by total assets, producing a percentage that tells investors how many cents of earnings each dollar of assets generates in a given period. Asset efficiency sits at the center of this metric because every business deploys capital into inventory, property, equipment, receivables, and cash, and the return on that deployment determines whether the enterprise creates value or merely consumes it. A company that earns a healthy profit on a modest asset base is compounding value efficiently, while a company that requires enormous assets to produce a thin profit is working hard for little reward.
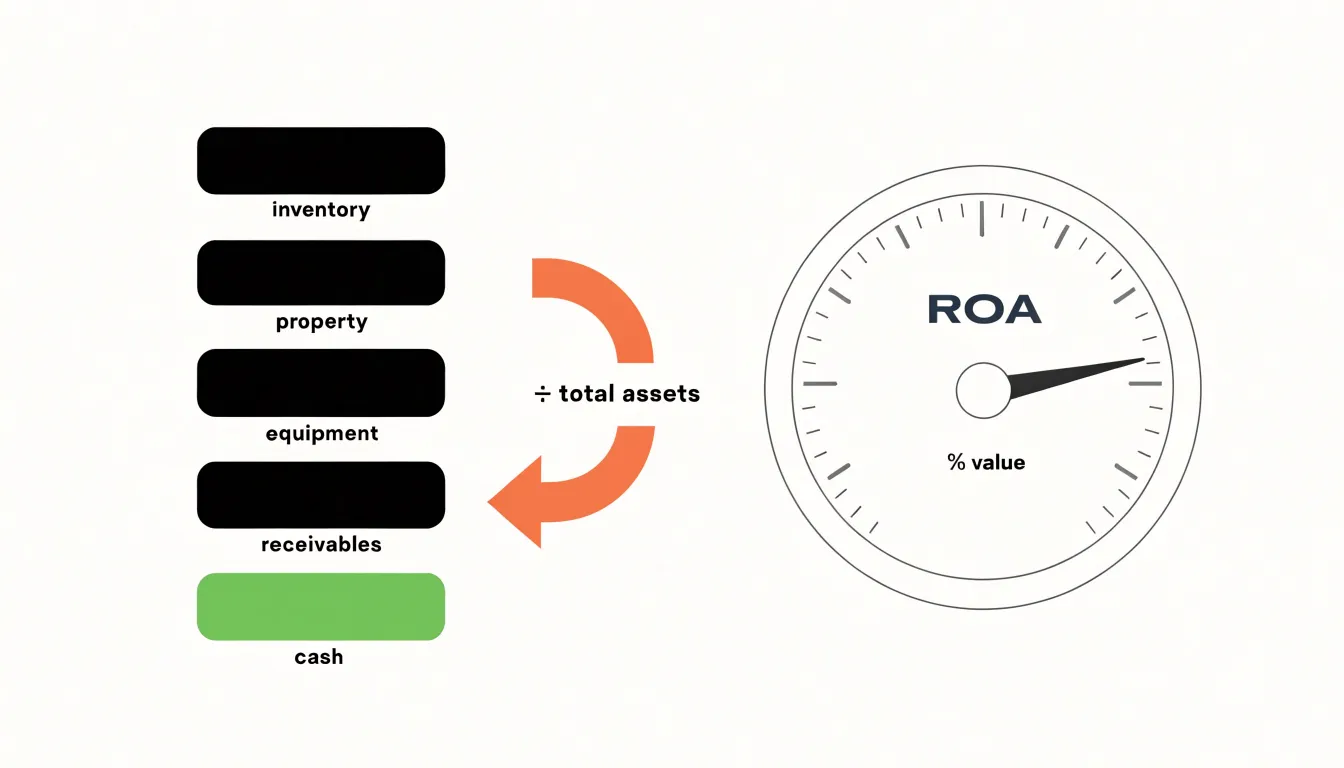
The connection between capital allocation and earnings runs directly through ROA. Management decisions about purchasing machinery, extending credit terms, holding inventory, or acquiring another business all change the asset base. When those decisions raise earnings faster than they raise assets, ROA climbs and the capital is being allocated well. When assets grow without a matching gain in profit, ROA falls and the allocation deserves scrutiny. In this way ROA functions as a scorecard for how wisely leadership turns investor and creditor capital into operating results, and sustained improvements in the ratio often signal disciplined stewardship of the balance sheet.
Investors rarely judge ROA in isolation, because the number means little without a benchmark. Capital intensity varies enormously between industries: utilities, manufacturers, and airlines carry heavy asset bases, while software firms and service businesses operate with far fewer tangible assets. Comparing a bank’s ROA with a retailer’s reveals nothing useful. The meaningful comparison happens among peers, where similar business models and asset structures make differences in efficiency informative. A company whose ROA consistently exceeds that of its direct competitors is likely extracting more profit from each unit of capacity, whether through pricing power, operational discipline, or smarter investment choices. Viewed over several years and alongside peer data, ROA becomes a reliable lens on profitability and long-term value creation.
The Return on Assets Formula
The return on assets formula divides a company’s net income by its total assets, producing a percentage that indicates how efficiently the asset base generates profit. Each input carries interpretive weight, so the choice of figures matters as much as the arithmetic.
Net income sits in the numerator, and the income statement offers several versions. Reported net income attributable to common shareholders is the most common starting point because it reflects what remains after interest, taxes, and preferred dividends. Analysts focused on operating performance sometimes prefer after-tax operating income, calculated by adding back interest expense net of its tax shield. This version isolates the productivity of assets from how the company is financed, which helps when comparing firms with different capital structures. Whichever figure is selected, consistency across periods and peers keeps the ratio meaningful.
Total assets in the denominator can be taken as the ending balance from the balance sheet or as the average of beginning and ending balances. Ending assets are simple but can distort results when a large acquisition, divestiture, or seasonal swing occurs late in the year. Averaging the two balances smooths those effects and better matches the income earned throughout the period against the assets employed to earn it. Companies with volatile asset bases benefit most from the averaging approach.
Several pitfalls recur in practice. One involves cash: some analysts strip excess cash from the denominator to measure operational asset efficiency, though doing so raises questions about where the boundary of excess lies. Another concerns intangibles. Goodwill and acquired intangibles can dominate the balance sheet after a major deal, depressing ROA without reflecting weak operations; excluding them produces a tangible-asset variant that some readers find more informative. Consistency is the guiding principle: whatever treatment is chosen, applying it uniformly across time periods and comparison companies preserves the ratio’s usefulness.
The formula’s simplicity makes it a versatile first-pass diagnostic, provided the analyst understands which income and asset figures are being combined and why.
Step-by-Step Walkthrough for Calculating Return on Assets Using Real Balance Sheets
To illustrate the calculation of return on assets (ROA), consider a hypothetical company, RiverTech Inc., a mid-sized manufacturer. We will use its income statement and balance sheet for the fiscal year ending December 31, 2023, to walk through each step. The income statement shows net income of $2.5 million. The balance sheet reports total assets of $20 million at the beginning of the year (January 1, 2023) and $24 million at the end of the year (December 31, 2023).
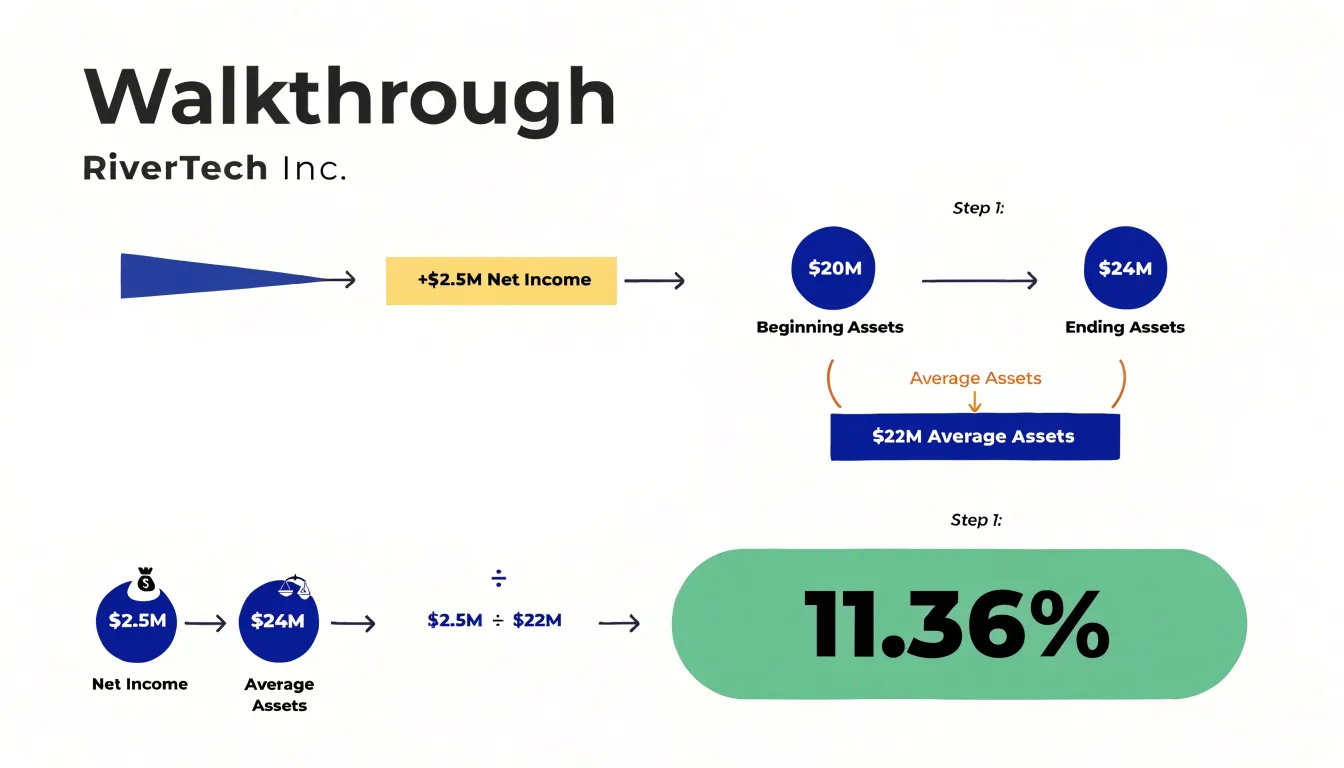
The first step is to determine net income, which is the bottom-line profit after all expenses, taxes, and interest. For RiverTech, net income is clearly stated as $2.5 million. This figure represents the earnings available to all capital providers, including debt and equity holders, making it appropriate for ROA.
Next, calculate average total assets. Since assets can fluctuate during the year, using an average provides a more representative denominator. Add the beginning and ending total assets and divide by two: ($20 million + $24 million) / 2 = $22 million. This average reflects the asset base that generated the earnings throughout the period.
Now compute ROA by dividing net income by average total assets: $2.5 million / $22 million = 0.1136, or 11.36%. This means that for every dollar of assets, RiverTech generated approximately 11.4 cents of profit.
Interpreting this result requires context. Compare RiverTech’s ROA to its industry average, say 8%. An ROA of 11.36% indicates that RiverTech is more efficient than its peers in using assets to generate profits. However, also consider trends over time: if the prior year’s ROA was 12%, the slight decline might warrant investigation. Additionally, a high ROA could stem from a lean asset base (e.g., outsourcing production) rather than superior profitability. Therefore, analysts should examine the composition of assets and the company’s business model. For capital-intensive industries, an ROA of 11% might be excellent, while for asset-light industries, it could be mediocre. Thus, ROA is most meaningful when benchmarked against historical performance and industry norms.
What Is a Good Return on Assets Ratio for a Business?
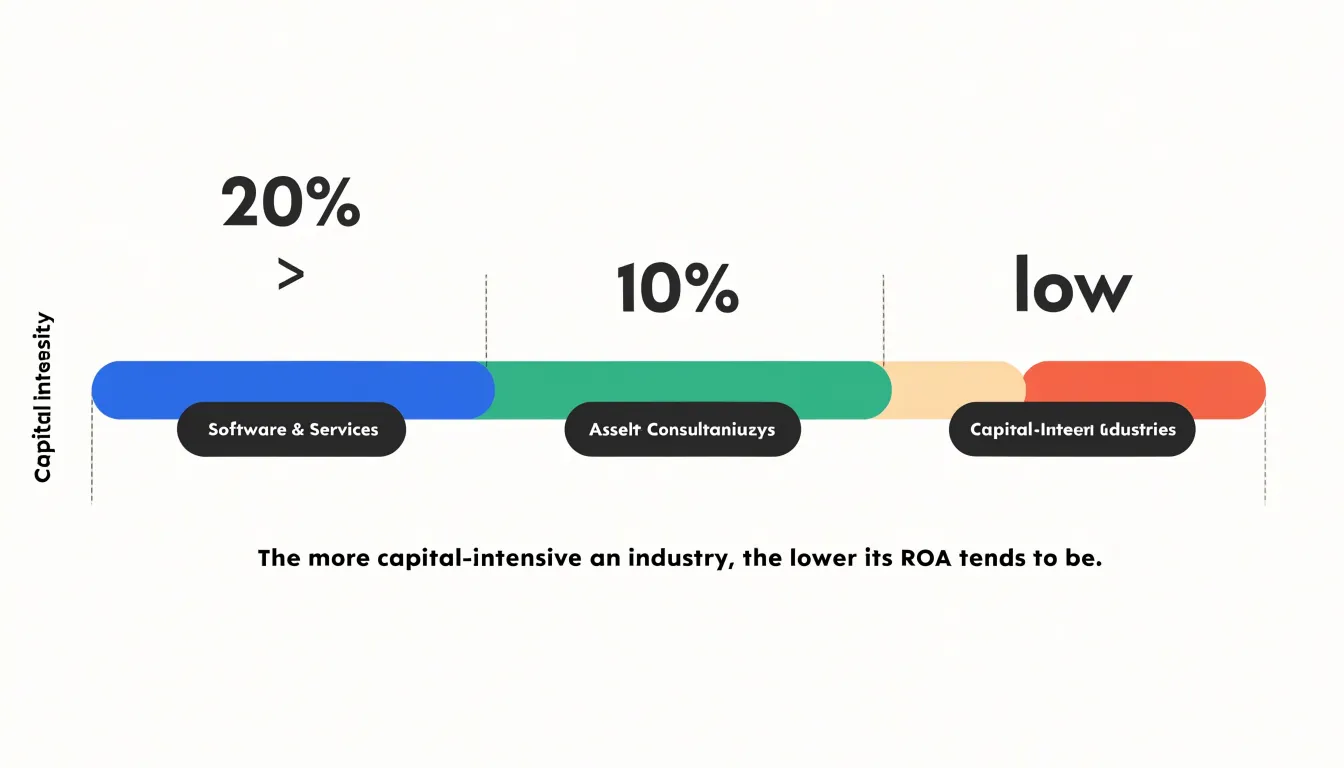
A good return on assets ratio depends heavily on the industry in which a business operates, and meaningful benchmark ranges shift accordingly. Broadly speaking, an ROA above 5% is often considered respectable for many established companies, while figures above 10% tend to signal a strong performer, and ratios exceeding 20% are exceptional and typically found among asset-light businesses such as software firms or consultancies. Capital-intensive sectors like manufacturing, utilities, and transportation often post ROA in the low single digits simply because their asset bases are large, so a 3% return in such an industry can be as impressive as a 15% return in services. This industry variation explains why no universal threshold exists. Comparing a retailer’s ROA to a bank’s tells an analyst very little, because each business model converts assets into profit at fundamentally different rates. The useful comparison is always against direct peers and against the company’s own history. A rising ROA over several years suggests improving operational efficiency, better asset utilization, or disciplined capital allocation, while a declining trend can flag deteriorating margins or an asset base that has grown faster than earnings. Cost of capital provides another critical lens. A company’s ROA should exceed its weighted average cost of capital for the business to create genuine economic value; an ROA of 6% may look healthy in isolation, but if the firm’s cost of capital sits at 8%, it is effectively destroying value with every dollar deployed. Judging ROA this way connects accounting returns to real economic performance. Analysts also examine ROA alongside the DuPont breakdown, separating margin, turnover, and leverage effects to understand what drives the number. A company can lift ROA by improving margins, squeezing more sales out of existing assets, or carrying more debt relative to equity, and each route carries different implications for risk. Finally, context matters: an unusually high ROA may reflect a recently sold-off asset base or one-time gains rather than durable operating strength, so reviewing several years of data alongside management commentary gives the clearest picture of whether a company’s return on assets is genuinely good or merely momentarily flattered.
How Industry Differences Impact What Counts as a High Return on Assets
Return on assets measures how efficiently a company converts its asset base into profit, and the ratio is deeply shaped by the structure of the industry a company operates in. Software firms, advertising agencies, and professional services businesses build their operations around human capital and intellectual property rather than heavy physical infrastructure. Their balance sheets hold relatively few fixed assets, so even a modest profit level produces a large ROA figure. A software company generating a healthy margin on a slim asset base can routinely post ROA in the double digits, and figures above 20 percent are not unusual among leading firms in that space.
Capital-intensive industries tell a different story. Utilities, manufacturers, airlines, and telecommunications companies must invest heavily in plants, equipment, networks, and infrastructure before they can generate a single dollar of revenue. Those assets sit on the balance sheet for years and depreciate slowly, which enlarges the denominator of the ROA calculation. Even a well-run utility earning solid returns for shareholders may report ROA in the low single digits, because the capital required to produce earnings is so substantial. A manufacturing company with an ROA of 6 percent could be performing excellently relative to its peers while appearing weak next to a software firm posting 18 percent.
For this reason, comparing ROA across sectors offers little useful information. A raw cross-industry comparison mostly reveals differences in capital structure and business model rather than differences in managerial effectiveness. The meaningful comparison happens within an industry, where companies face similar capital requirements and similar operating environments. When evaluating a utility, an ROA of 3 to 4 percent may represent strong performance, while in software the same figure would suggest serious inefficiency. Analysts typically build peer groups of companies with comparable asset intensity, then rank ROA within that group.
Investors can also adjust their approach by tracking ROA trends over time for a single company, watching whether the ratio is improving as management wrings more profit from the existing asset base, or deteriorating as capital investments fail to generate proportionate returns. Combining ROA with sector-specific benchmarks and multi-year trend analysis gives a far clearer picture of operational quality than any single number viewed in isolation.
Return on Assets vs Return on Equity
Return on Assets (ROA) and Return on Equity (ROE) both measure how efficiently a company turns its capital base into profit, yet they answer subtly different questions. ROA divides net income by total assets, capturing how productively the firm deploys everything on its balance sheet, regardless of who funded those assets. ROE divides net income by shareholders’ equity, focusing narrowly on the return delivered to owners. Because equity equals assets minus liabilities, the two ratios share a numerator but diverge in their denominators, and that divergence is where useful information lives.
Debt sits at the heart of the difference. When a company borrows money and invests it in assets, total assets rise, and so does the income generated from those assets. If the return earned on the borrowed funds exceeds the after-tax interest cost, net income rises faster than equity, and ROE climbs. ROA, by contrast, spreads that same income across a larger asset base, so it moves far less. In this way, leverage can lift ROE while leaving ROA essentially flat. The improvement reflects financing choices rather than operating improvements.
A widening gap between ROE and ROA is a practical warning signal. Analysts often track the two side by side and watch the spread over time. A stable or rising ROA paired with a surging ROE points to increasing reliance on debt. A falling ROA alongside a steady ROE suggests management is propping up equity returns with borrowed money while the underlying business weakens. Comparing the spread against peers in the same industry helps separate legitimate capital structure differences from aggressive borrowing.
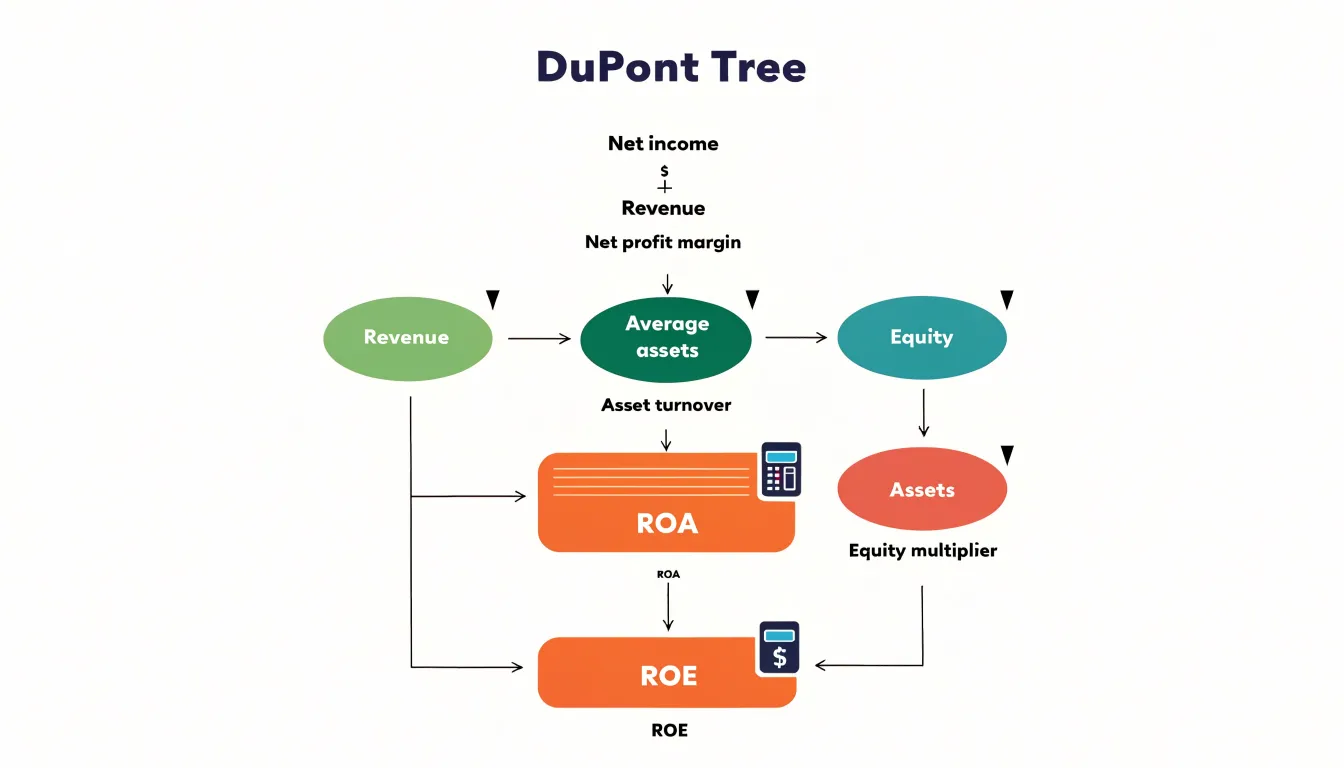
The DuPont framework formalizes this relationship by decomposing ROE into profit margin, asset turnover, and an equity multiplier equal to assets divided by equity. The multiplier is the leverage term: it equals 1 for an unlevered firm and rises with debt. Multiplying ROA by the equity multiplier yields ROE, which makes the arithmetic of leverage explicit. An investor who sees ROE of 20 percent should check whether ROA is 10 percent with a multiplier of 2, or 15 percent with a multiplier of 1.33. The first company carries twice the financial risk for the same headline return.
Used together, ROA and ROE give a fuller picture. ROA reveals operating efficiency across the whole asset base, while ROE reveals what owners actually earn. Reading the gap between them tells you how much of that equity return comes from the business and how much from the balance sheet.
Using DuPont Analysis to Uncover the Drivers Behind Return on Assets
DuPont analysis offers a structured way to unpack return on assets (ROA) into its two multiplicative components: net profit margin and asset turnover. ROA is simply the product of these two ratios, so changes in overall profitability can be traced to shifts in either operational efficiency or capital efficiency. Net profit margin, calculated as net income divided by revenue, reflects how well a company converts sales into profits after all expenses. A high margin signals strong pricing power, cost control, or both—essentially operational effectiveness. Asset turnover, revenue divided by average total assets, measures how efficiently a company uses its asset base to generate sales. A high turnover indicates that the company is squeezing more revenue from each dollar of assets, which is a sign of capital efficiency.
By decomposing ROA, analysts can diagnose performance changes. For instance, if ROA declines, DuPont analysis reveals whether the cause is a falling margin, declining turnover, or both. A margin-driven decline might point to rising costs, pricing pressure, or operational inefficiencies, prompting a review of the income statement. A turnover-driven decline could indicate underutilized assets, bloated inventory, or slower receivables collection, directing attention to the balance sheet and operational processes. Moreover, the breakdown helps in comparing companies within the same industry: two firms may have identical ROA but vastly different strategies—one relying on high margins (e.g., luxury goods) and the other on high turnover (e.g., discount retail). Understanding these drivers provides context for benchmarking and strategic analysis.
DuPont analysis also aids in trend analysis over time. By tracking margin and turnover separately, stakeholders can see whether a company’s competitive position is strengthening or weakening in specific areas. For example, a company might maintain its ROA by offsetting a margin decline with improved asset turnover, which could signal a strategic shift toward volume over premium pricing. Such insights are invaluable for management, investors, and creditors in assessing operational health and making informed decisions.
Common Limitations of Return on Assets That Can Mislead Investors
Return on Assets appears straightforward: divide net income by total assets and you have a snapshot of how efficiently a company converts its asset base into profit. In practice, several structural features of financial reporting can distort this ratio and lead investors toward faulty conclusions about capital efficiency.
Asset age and depreciation represent one of the most significant distortions. Because ROA uses the book value of assets, a company operating a fleet of fully depreciated plants or equipment carries those assets at a fraction of their original cost. The denominator shrinks while earnings remain largely intact, mechanically inflating ROA. A competitor that recently built comparable facilities reports assets at near-replacement value and therefore shows a lower ROA despite operating equally well. Within a single company, ROA can drift upward over time simply because the asset base ages, creating an impression of improving efficiency that reflects accounting mechanics rather than operational gains.
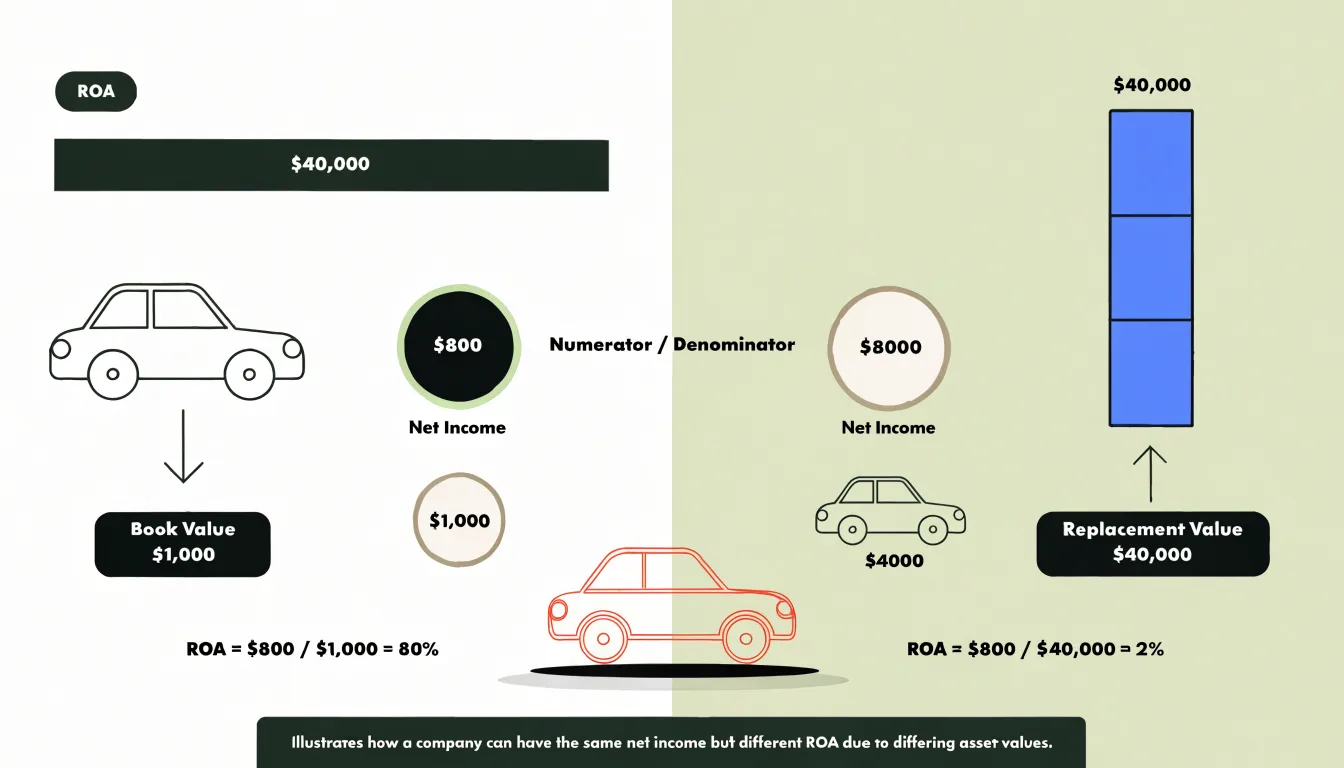
Acquisitions introduce another layer of distortion. When a company buys another business, the purchase price is allocated across identified assets, with the excess recorded as goodwill. Goodwill sits on the balance sheet without generating depreciation charges, and acquired assets are stepped up to fair value, enlarging the denominator. A serial acquirer may therefore display a depressed ROA relative to an organic grower, even when the acquired businesses earn attractive returns. Conversely, write-downs of goodwill or impaired assets can shrink the denominator sharply and flatter ROA in subsequent periods, obscuring the capital that was genuinely consumed.
Off-balance-sheet assets further complicate the picture. Firms using operating leases, joint ventures, or research partnerships may deploy substantial capital that never appears as a recorded asset, understating the denominator and overstating measured efficiency. Differences in how companies structure these arrangements make cross-company comparisons unreliable.
Finally, ROA compresses a great deal of information into a single figure. It says nothing about the risk taken to generate returns, the cost of the liabilities funding the asset base, or the timing of cash flows. Two companies with identical ROA can carry vastly different leverage and risk profiles. Investors are best served by treating ROA as one input among several, examined alongside cash flow returns, asset turnover, and capital expenditure patterns.
Practical Strategies Companies Use to Improve Asset Efficiency
Companies looking to lift their return on assets often start by scrutinizing the balance sheet for underperforming assets. Trimming these means identifying equipment, real estate, or entire business lines that generate returns below the cost of capital and either selling them, shutting them down, or repurposing them for higher-value uses. A manufacturer might sell off idle machinery, while a retailer might close unprofitable stores. The goal is to shrink the asset base while preserving revenue, which mechanically boosts ROA. Improving inventory turnover is another lever: tighter purchasing, just-in-time systems, and better demand forecasting reduce the amount of capital tied up in stock. Faster inventory turns mean fewer assets are needed to support the same sales volume. Accelerating receivables collection works similarly—companies can offer early-payment discounts, tighten credit terms, or use electronic invoicing to shorten the cash conversion cycle, freeing up cash that would otherwise sit in accounts receivable. Outsourcing capital-heavy functions, such as logistics, manufacturing, or IT infrastructure, shifts assets off the balance sheet entirely; the company pays for the service as an expense rather than owning the underlying facilities. Each of these tactics can genuinely improve efficiency by reducing the asset base or increasing asset productivity. However, investors need to distinguish real gains from accounting maneuvers. Genuine efficiency shows up in operating metrics: higher inventory turns, shorter days sales outstanding, and improved capacity utilization, all accompanied by stable or growing margins. Accounting tricks, by contrast, often involve asset write-downs that temporarily shrink the denominator without improving operations, or sale-leaseback transactions that remove assets but add back rent expenses that may offset the benefit. Investors should watch for consistent, multi-period improvements in both ROA and its components, and check whether cash flow from operations keeps pace with reported earnings. A rising ROA driven solely by asset sales or write-downs, without corresponding operational improvements, is a red flag. Genuine efficiency gains tend to be sustainable and are reflected in better cash conversion and return on invested capital over time.
Frequently Asked Questions
What does return on assets tell you?
Return on assets measures how effectively a company converts the resources on its balance sheet into profit. It divides net income by total assets, producing a percentage that shows how many cents of earnings each dollar of assets generates in a given period.
How do you calculate ROA using average total assets?
Calculate ROA by dividing net income by average total assets. Average total assets are found by adding beginning and ending total assets and dividing by two.
What is a good return on assets ratio?
A good ROA depends heavily on the industry. An ROA above 5% is often considered respectable for many established companies, above 10% tends to signal a strong performer, and above 20% is exceptional and typically found among asset-light businesses; capital-intensive sectors often post ROA in the low single digits.
Why can ROA be misleading for companies with old or depreciated assets?
ROA uses the book value of assets, so fully depreciated plants or equipment can shrink the denominator and mechanically inflate ROA. A competitor with newer facilities may show a lower ROA despite operating equally well.
What is the difference between ROA and ROE?
ROA divides net income by total assets and captures how productively the firm deploys its balance sheet, while ROE divides net income by shareholders’ equity and focuses on the return delivered to owners. Leverage can lift ROE while leaving ROA essentially flat, and a widening gap between the two can signal increasing reliance on debt.
How can companies improve return on assets?
Companies can improve ROA by trimming underperforming assets, improving inventory turnover, accelerating receivables collection, and outsourcing capital-heavy functions. Investors should distinguish genuine efficiency from accounting maneuvers, because a rising ROA driven solely by asset sales or write-downs without operational improvements is a red flag.