
Return on Equity (ROE)
Return on Equity (ROE) is a financial ratio that measures the profit a company generates for each dollar of shareholder equity, calculated as net income divided by average shareholders’ equity. It shows how efficiently a company turns owner capital into profit, with 15% often cited as a strong benchmark, though healthy ROE varies by industry.
Table of Contents
- What Return on Equity Measures and Why Investors Care
- The Standard Formula for Calculating Return on Equity
- How to Pull the Right Numbers from a Company Balance Sheet
- What Counts as a Good Return on Equity Benchmark?
- DuPont Analysis
- How Debt Can Artificially Inflate Return on Equity Metrics
- ROE versus ROA
- Red Flags to Watch for When Analyzing Return on Equity Trends
What Return on Equity Measures and Why Investors Care
Return on Equity, commonly abbreviated as ROE, expresses the profit a company generates for every dollar of shareholder capital invested in it. The calculation divides net income by shareholders’ equity, the accounting measure of what remains for owners after liabilities are subtracted from assets. A company reporting an ROE of 15 percent has, in effect, earned fifteen cents of profit for each dollar of equity on its balance sheet. That single figure condenses the combined effect of how profitably a business sells its goods, how efficiently it uses its assets, and how much of its funding comes from debt versus owners’ money. Because it ties profit directly to the capital that owners have committed, ROE offers a compact summary of how hard that capital is working.
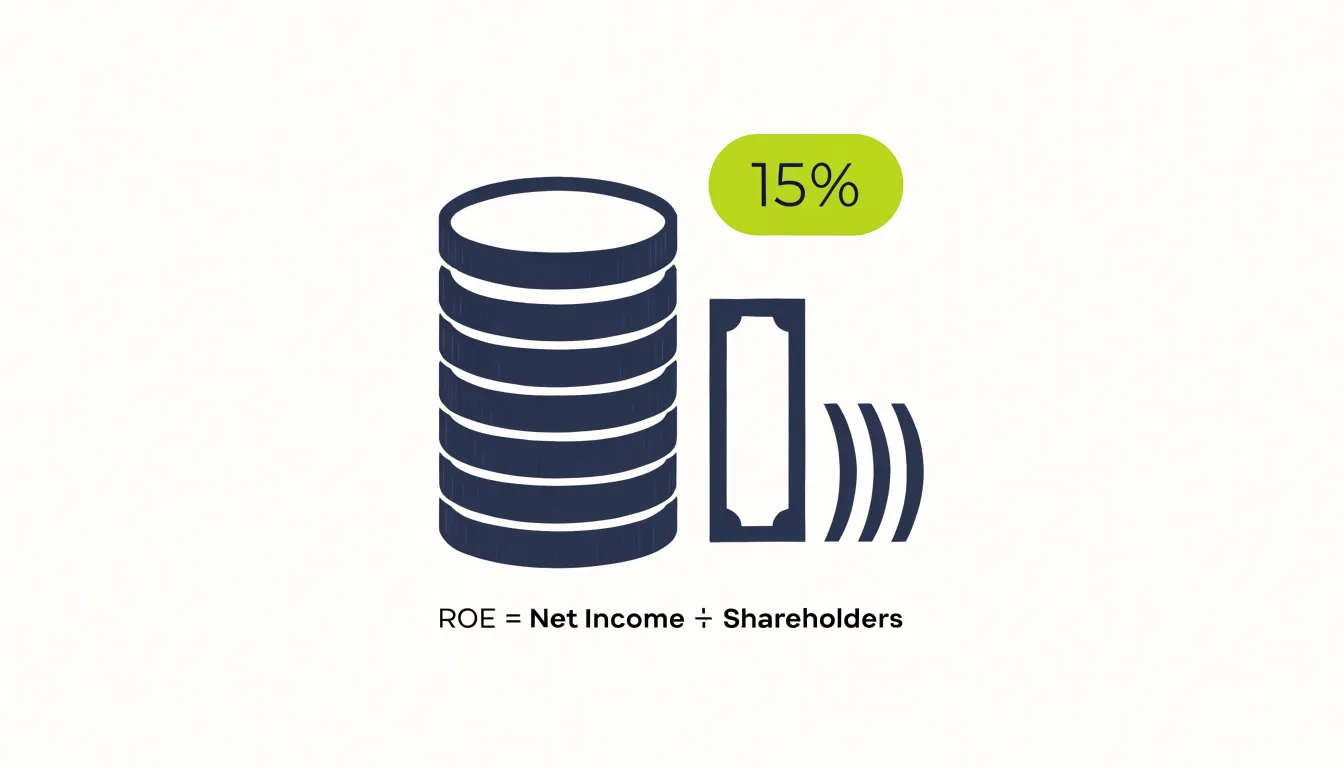
For investors, this compactness is precisely what makes ROE useful when comparing companies. Businesses differ in size, capital structure, and industry, and raw profit figures can mislead when placed side by side. A large firm earning a billion dollars may be far less efficient with its capital than a smaller competitor earning a fraction of that amount. ROE normalizes profit against the equity base, allowing an investor to ask a consistent question across a portfolio or an industry: for each dollar entrusted to management, how much profit comes back? Sustained differences in ROE often reveal differences in management quality, competitive position, pricing power, and operational discipline. Companies that consistently earn high returns on their equity typically possess some durable advantage that lets them squeeze more profit from each unit of capital than rivals do.
The connection to long-term shareholder returns runs through compounding. When a company earns a healthy return on equity and reinvests a portion of its profits back into the business, those retained earnings can generate further profits at a similar rate, and the cycle repeats. Over many years, this reinvestment dynamic drives the growth of book value and, ultimately, the earnings available to shareholders. High and stable ROE also tends to support dividend capacity and share repurchases, both of which return cash to owners. ROE is a starting point for analysis rather than a conclusion, since heavy borrowing can inflate the ratio while adding risk. Reading it alongside debt levels, margins, and the durability of the business gives investors a fuller picture of how efficiently their capital is being put to work and what that efficiency might mean for returns over time.
The Standard Formula for Calculating Return on Equity
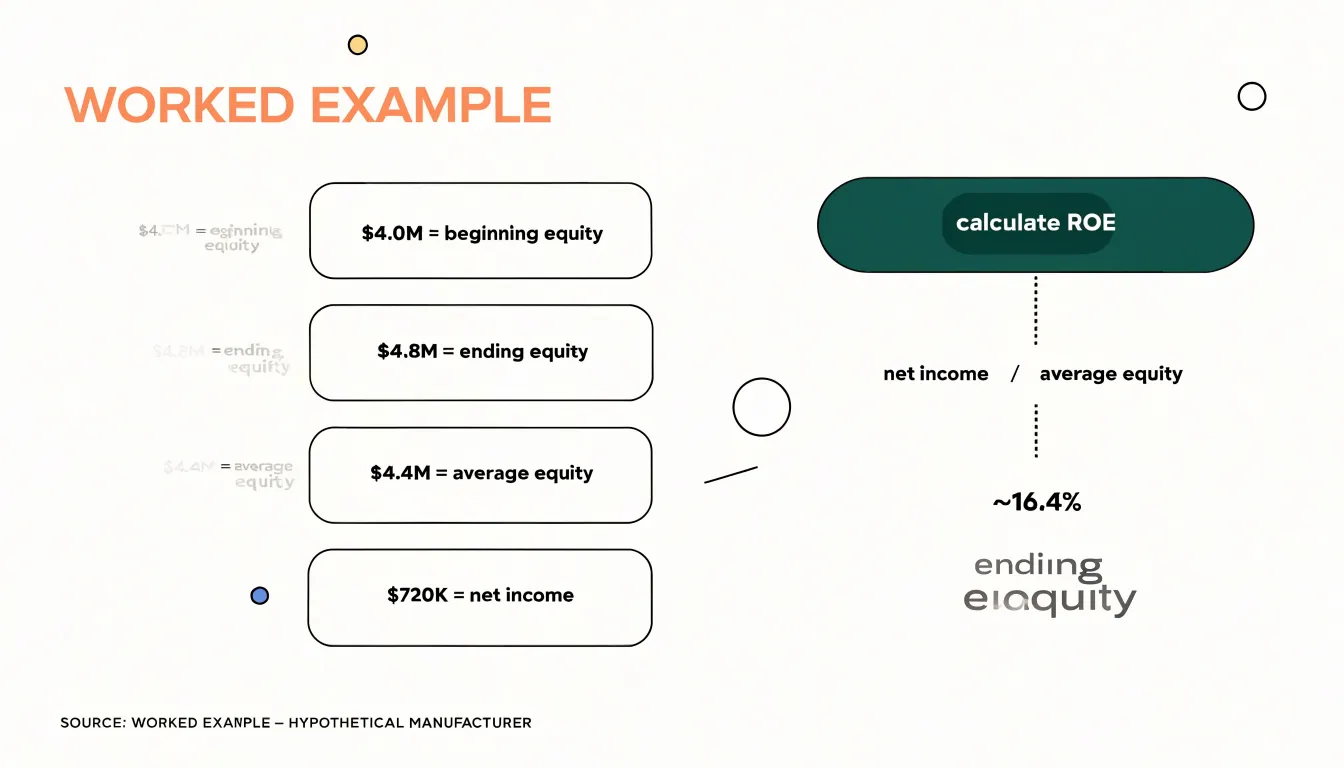
Return on equity measures how effectively a company turns the capital its shareholders have invested into profit. The standard formula divides net income by average shareholders’ equity. Net income is the figure reported at the bottom of the income statement, after all expenses, interest, and taxes have been deducted. Shareholders’ equity, sometimes called book value, is the residual claim that remains after total liabilities are subtracted from total assets. Because equity changes across the year as profits are retained, shares are issued, or buybacks occur, the standard practice is to average the beginning and ending equity balances. Using a single period-end figure can distort the result: if a company raised capital midway through the year, the closing equity balance would include cash that had not yet had time to generate earnings, understating true returns. Averaging smooths these timing effects so the ratio pairs the income earned throughout the period with the capital that was actually available to produce it. The average is calculated as beginning equity plus ending equity, divided by two. Consider a hypothetical manufacturer. At the start of the year its shareholders’ equity stood at $4.0 million. Over the year it earned net income of $720,000 and retained most of it. At year-end, equity was $4.8 million after accounting for the retained profit. Average equity equals ($4.0 million + $4.8 million) / 2, or $4.4 million. Dividing net income of $720,000 by average equity of $4.4 million gives an ROE of roughly 16.4%. Analysts can benchmark that figure against the company’s own history, against peers in the same industry, and against the cost of equity to judge whether management is creating value. For a second illustration, take a services firm with opening equity of $1.5 million and closing equity of $1.9 million, yielding average equity of $1.7 million; net income of $255,000 produces an ROE of 15%. Working through the arithmetic this way keeps the calculation transparent and comparable across periods, and it highlights the two inputs that drive the ratio: profitability and the size of the equity base.
How to Pull the Right Numbers from a Company Balance Sheet
Calculating return on equity begins with locating two figures in a company’s financial statements: net income and shareholders’ equity. Net income appears on the income statement, typically as the final line after operating expenses, interest, taxes, and any extraordinary items have been deducted. It represents the profit attributable to the company’s owners for the period, and it is the numerator in the ROE formula. Analysts should confirm that the net income figure reflects the full reporting period being measured and that it has not been adjusted for dividends paid, since dividends are distributions of profit rather than deductions from it.
The denominator, shareholders’ equity, is found on the balance sheet. It usually appears near the bottom under headings such as “Total Shareholders’ Equity,” “Total Stockholders’ Equity,” or “Total Equity.” This figure equals total assets minus total liabilities and represents the book value of owners’ claims on the business. When calculating ROE, use the equity attributable to common shareholders rather than total equity in cases where the company has issued preferred stock. Preferred shareholders have a prior claim on earnings and assets, so their equity is excluded from the denominator, and preferred dividends are subtracted from net income in the numerator. Minority interests, also called non-controlling interests, should likewise be excluded from shareholders’ equity, since they represent ownership stakes held by outside parties in consolidated subsidiaries rather than claims belonging to the parent company’s shareholders.
A common mistake involves substituting total assets for shareholders’ equity in the denominator. Total assets measure everything the company owns, funded by both debt and equity, so using them produces a return on assets calculation rather than a return on equity. Another frequent error is pulling an equity figure from the wrong date or mixing periods, such as pairing annual net income with a quarter-end equity balance. Average equity, computed as the beginning and ending balances divided by two, often provides a more representative denominator when equity has changed substantially during the year. Verifying each figure against the notes to the financial statements helps ensure the inputs reflect the company’s actual capital structure.
What Counts as a Good Return on Equity Benchmark?
Return on equity means different things in different sectors, so the first step in judging any ROE figure is to establish what is normal for the industry in which the company operates. Banks and other financial institutions routinely report ROE in the low-to-mid teens because their business models run on leveraged balance sheets, while asset-light service or software firms can post ROE well above 20%. Utilities and capital-intensive manufacturers often sit in the single digits or low teens, since heavy fixed assets and regulated pricing limit profitability. Consumer staples companies tend to cluster around the mid-teens. These ranges are broad rules of thumb rather than precise thresholds, and they shift with the economic cycle, but they give an investor a baseline against which a single company’s figure can be assessed.
The 15% figure is frequently cited as a strong benchmark for a reason. It represents a level of profitability that, sustained over time, tends to compound shareholder capital at an attractive rate and outpace the long-run returns of broad equity markets. A company generating a consistent 15% ROE is typically reinvesting earnings at a healthy rate while keeping costs and leverage under control. That said, the number carries more weight when it is earned consistently rather than in a single exceptional year, and when it is achieved without an unusually heavy debt load.
Comparison is where the benchmark becomes useful. Set the company’s ROE against the median or average of its sector peers to see whether it is a leader, a laggard, or simply average. A 12% ROE at a utility may signal excellence, while the same figure at a software company might flag underperformance. Equally important is the company’s own history: track ROE across five to ten years to see whether the trend is improving, stable, or deteriorating. A rising ROE can reflect better margins or smarter capital allocation, or it can reflect a shrinking equity base. Reading the number against both its peer group and its own track record turns a single statistic into a meaningful signal about business quality and management effectiveness.
DuPont Analysis
The three-step DuPont analysis takes the single ROE figure and expresses it as the product of three ratios: net profit margin, asset turnover, and the equity multiplier. Because ROE equals net income divided by shareholders’ equity, the decomposition simply rewrites that fraction in a way that exposes the operational, structural, and financing choices behind the result. Net profit margin is net income divided by revenue and shows how much of each sales dollar survives after all expenses. Asset turnover is revenue divided by total assets and shows how many dollars of sales the asset base generates each year. The equity multiplier is total assets divided by shareholders’ equity and shows how much of the balance sheet is funded by equity versus debt. Multiplying the three together returns the original ROE, which means any movement in ROE can be traced to one or more of these drivers.
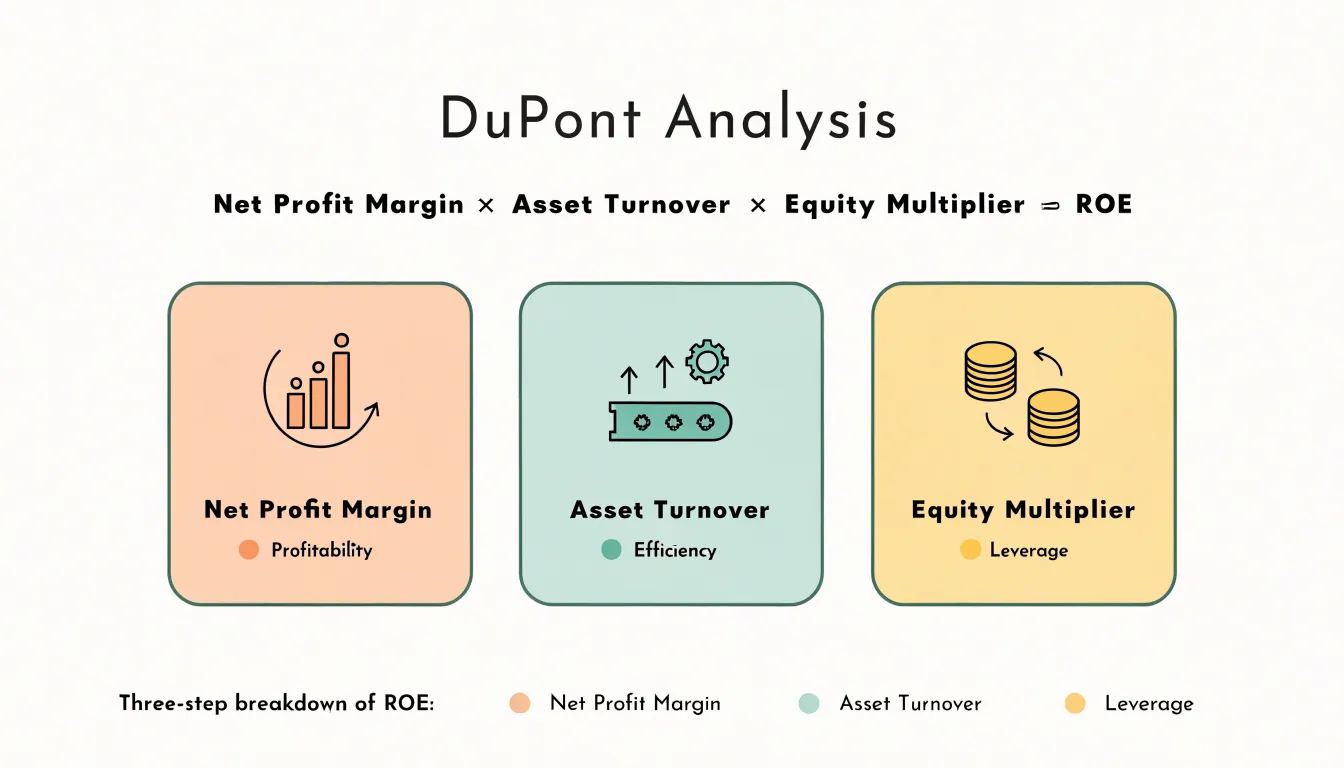
Each component answers a distinct question. Net profit margin reveals pricing power, cost discipline, and the strength of the business model: a high margin suggests the company can charge premium prices or operates with a lean cost structure. Asset turnover reveals operational efficiency, showing how hard the asset base works and whether capital is tied up in inventory, receivables, or underused facilities. The equity multiplier reveals financial structure, indicating how aggressively the company uses borrowed money to amplify returns to shareholders. A retailer and a software firm may post identical ROE figures while one earns it through thin margins and very high turnover and the other through very high margins and modest turnover.
In practice, the value of DuPont analysis lies in diagnosis. When ROE rises, an analyst can check whether margin, turnover, or leverage did the work. Rising margin points to improved profitability or pricing. Rising turnover points to better asset utilization. Rising leverage points to heavier borrowing, which inflates ROE without any operational improvement and raises financial risk. Tracking the three components across several years and against peers shows whether a company’s returns are durable or borrowed from the balance sheet, and it helps investors distinguish genuine operating strength from returns that depend on expanding debt.
How Debt Can Artificially Inflate Return on Equity Metrics
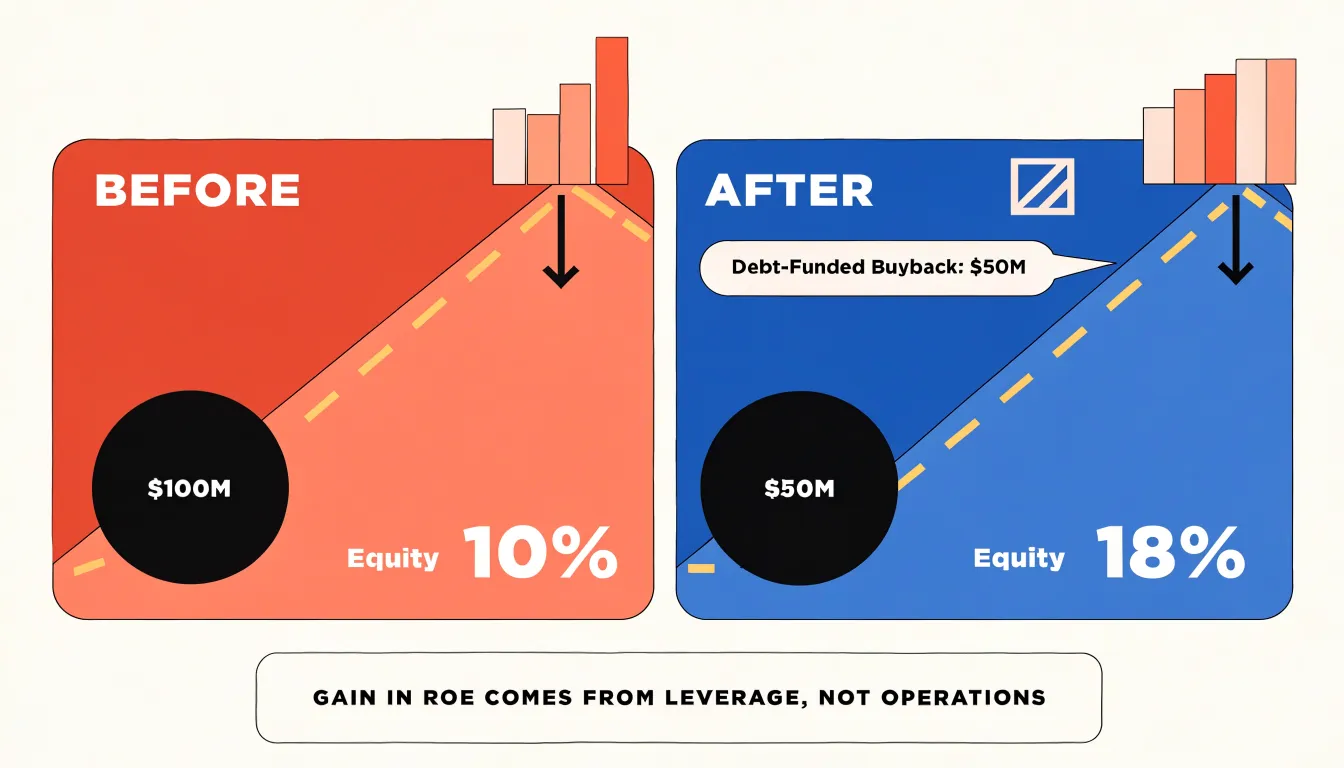
Return on equity measures net income as a percentage of shareholders’ equity, so any change in the equity base directly affects the ratio. When a company takes on debt, it uses borrowed funds to finance operations or buy back shares, which reduces the amount of equity on the balance sheet. A smaller equity denominator means the same net income produces a higher ROE. This mechanical effect occurs because debt displaces equity in the capital structure. For example, a firm with $100 million in equity and $10 million in net income has an ROE of 10%. If it borrows $50 million and uses the proceeds to repurchase shares, equity falls to $50 million. Assuming the interest expense is small relative to earnings, net income might remain near $9 million, pushing ROE to 18%. The improvement stems from leverage, not from better operational performance.
A debt-fueled ROE can mask significant financial risk. Higher leverage increases fixed interest obligations, which can strain cash flow during downturns. It also raises the possibility of financial distress if earnings decline. A company with a high ROE driven by heavy borrowing may appear efficient, but its earnings are more sensitive to changes in interest rates and economic conditions. The ratio alone does not reveal this vulnerability. Investors who focus solely on ROE might overlook the heightened risk of default or the reduced financial flexibility that comes with a leveraged balance sheet.
To spot companies whose ROE is propped up by borrowing rather than operational strength, several checks are useful. First, compare the debt-to-equity ratio and total liabilities relative to assets. A rising debt load alongside a rising ROE is a warning sign. Second, examine the trend in interest expense as a percentage of operating income; a growing share suggests that debt is becoming a larger factor in the capital structure. Third, look at return on invested capital (ROIC), which incorporates both debt and equity. If ROIC is stable or declining while ROE climbs, the ROE increase is likely leverage-driven. Fourth, check whether the company has been buying back shares using debt, which shrinks equity directly. Finally, assess the durability of earnings: if net income is volatile or dependent on favorable interest rates, the ROE may not be sustainable. By combining these checks, investors can distinguish between ROE generated by operational excellence and ROE inflated by financial engineering.
ROE versus ROA
Return on equity and return on assets both express profitability as a ratio of profit to a balance sheet base, yet they answer different questions. ROE divides net income by shareholders’ equity and measures the return generated on the capital owners have committed to the business. ROA divides net income by total assets and measures how efficiently the entire asset base, regardless of how it was financed, produces earnings. The gap between the two ratios is driven by leverage: when a company carries debt, its asset base exceeds its equity, and any positive return on assets is magnified when expressed against a smaller equity figure.
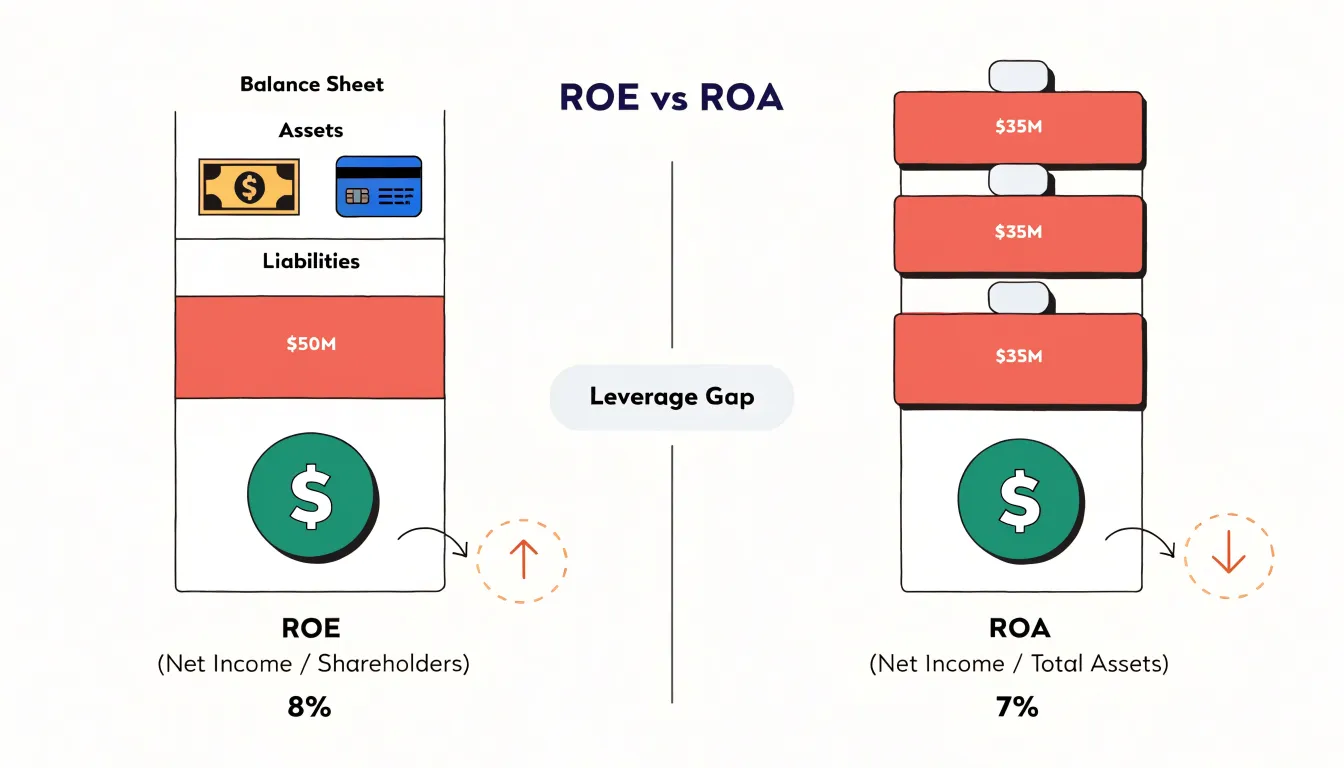
For asset heavy businesses such as manufacturers, utilities, telecommunications operators, and transport companies, that magnification can obscure the underlying economics. A capital-intensive firm may carry substantial debt to fund plants, equipment, or infrastructure, and its ROE will rise simply because equity is a thin slice of total funding. ROA sidesteps this distortion by putting profit against the full pool of assets employed, so it reflects operating and asset productivity on a like-for-like basis across companies with different financing choices. Two competitors with identical plants and identical operating margins can show very different ROEs purely because one is more leveraged, while their ROAs will be closely comparable. This makes ROA the more informative metric for judging management’s stewardship of expensive fixed assets and for benchmarking within capital-intensive industries.
ROE retains clear value in other contexts. For a shareholder, it speaks directly to the return earned on invested capital, and it is a natural summary measure for banks and insurers, where assets are largely funded by deposits and policyholder liabilities and equity is the true risk buffer. It also matters when assessing whether debt is being used productively: a company that borrows at a cost below its ROA will lift ROE for shareholders, which is a legitimate and observable benefit.
The practical guidance is to read the two together. ROA reveals the earning power of the asset base; ROE reveals how financing decisions translate that earning power into returns for owners. Where leverage is heavy and assets are long-lived, ROA deserves priority; where the business model is inherently leveraged or equity-centric, ROE offers the sharper view.
Red Flags to Watch for When Analyzing Return on Equity Trends
Return on equity tells you how efficiently a company turns shareholder capital into profit, but the trend behind the number often matters more than any single year’s figure. A steady decline in ROE across three to five years deserves attention, particularly when revenue and margins are also softening, since that pattern can point to eroding competitive advantages, rising costs, or capital being deployed into projects that fail to earn their keep. Management commentary and segment-level disclosures can help you determine whether the slide reflects a temporary setback or a structural problem.
A second warning sign appears when ROE looks strong only because of financial engineering. Share buybacks shrink the equity base, which mechanically lifts the ratio even if net income is flat or falling, so check the share count history alongside earnings. Rising debt produces a similar effect, since borrowed money magnifies returns on a smaller equity cushion. Comparing return on assets and return on invested capital to ROE can reveal whether leverage is doing the heavy lifting. A company whose ROE outpaces its ROIC by a wide margin is often borrowing its way to an attractive headline number, and that advantage reverses quickly when interest rates rise or credit tightens.
Volatility is a third flag. ROE that swings wildly from year to year, driven by one-off gains, asset sales, litigation charges, or cyclical commodity prices, signals inconsistent earnings quality. Smooth, durable ROE usually reflects recurring revenue and disciplined cost control, while erratic figures suggest profits depend on factors outside management’s control. Look at the DuPont breakdown of margin, asset turnover, and leverage over several periods to see which component is causing the swings.
Digging deeper means reading the footnotes, tracking cash flow from operations relative to net income, reviewing debt covenants, and checking whether buybacks were funded by free cash flow or borrowings. Comparing ROE with peers in the same industry adds context, since capital intensity varies by sector. Diligent investors treat ROE as a starting point for questions rather than a conclusion, using the trend, the composition of returns, and the quality of earnings to judge whether the number reflects genuine business strength.
Frequently Asked Questions
What does return on equity tell investors?
Return on equity expresses the profit a company generates for every dollar of shareholder capital, calculated as net income divided by shareholders’ equity. It helps investors compare companies of different sizes by showing how hard their capital is working.
How is return on equity calculated?
The standard formula divides net income by average shareholders’ equity, which is beginning equity plus ending equity divided by two. Averaging smooths timing effects because equity changes during the year as profits are retained, shares are issued, or buybacks occur.
What is considered a good ROE?
A 15% ROE is frequently cited as a strong benchmark, but what counts as good varies by industry: banks often report low-to-mid teens, software firms can exceed 20%, and utilities may sit in the single digits or low teens. The figure carries more weight when earned consistently and without an unusually heavy debt load.
What does DuPont analysis break ROE into?
The three-step DuPont analysis expresses ROE as the product of net profit margin, asset turnover, and the equity multiplier. It helps show whether margin, turnover, or leverage is driving a company’s ROE.
Can debt artificially inflate ROE?
Yes. Taking on debt can reduce the equity denominator, so the same net income produces a higher ROE, and a debt-fueled ROE can mask higher fixed interest obligations and financial risk. Investors can check debt-to-equity, interest expense trends, ROIC, and whether buybacks were funded by borrowing to spot leverage-driven ROE.
What is the difference between ROE and ROA?
ROE divides net income by shareholders’ equity and measures the return on capital owners have committed, while ROA divides net income by total assets and measures how efficiently the entire asset base produces earnings. The gap between them is driven by leverage, and ROA is often more informative for capital-intensive businesses.