The 3 Financial Statements and How They Connect
The three financial statements are the income statement, which shows profitability over a period; the balance sheet, which shows assets, liabilities, and equity at a point in time; and the cash flow statement, which tracks actual cash movements. They connect: net income flows into retained earnings, and cash reconciles to the balance sheet.
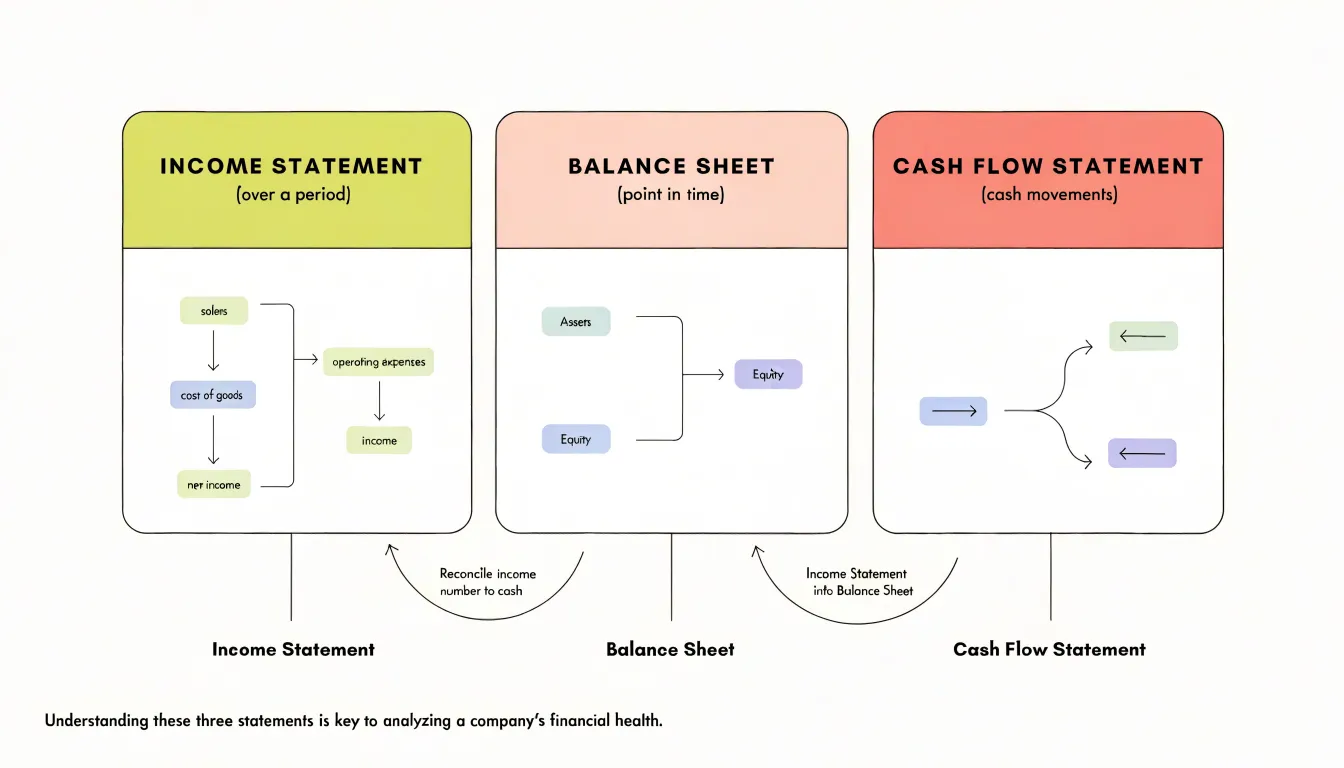
Table of Contents
- Why Do You Need Three Different Statements Instead of Just One?
- The Income Statement
- Understanding the Balance Sheet as a Snapshot of Assets and Debt
- The Cash Flow Statement
- How Net Income Flows Directly Into Retained Earnings
- Why Net Profit Rarely Matches the Actual Cash in the Bank
- Tracing a Single Equipment Purchase Across Every Statement
- Spotting Red Flags by Cross-Checking Your Financial Reports
Why Do You Need Three Different Statements Instead of Just One?
Each financial statement serves a distinct purpose, and together they provide a comprehensive view of a company’s financial health. The income statement focuses on profitability over a period, showing revenues, expenses, and net income. It answers whether the company is making a profit from its operations. However, profitability alone does not reveal the company’s financial position at a specific point in time. That is the role of the balance sheet, which lists assets, liabilities, and equity, offering a snapshot of what the company owns and owes. Yet, a company can be profitable and have a strong balance sheet but still face liquidity problems if it cannot meet short-term obligations. The cash flow statement tracks the flow of cash in and out of the business, highlighting liquidity and the sources and uses of cash. No single report can capture all three dimensions because they measure different aspects: performance over time, financial status at a moment, and cash movement. For instance, a company might show high net income on the income statement but negative cash flow if customers are slow to pay, leading to liquidity issues not evident from the income statement alone. Similarly, the balance sheet might show valuable assets, but without the cash flow statement, it’s unclear if the company can convert those assets into cash to pay bills. Therefore, the three statements are interconnected and each provides essential information that the others cannot. By using all three, stakeholders gain a holistic understanding of profitability, financial stability, and liquidity, enabling better decision-making.
The Income Statement
The Income Statement, sometimes called the Profit and Loss statement, reports a company’s financial performance over a defined period, whether a month, a quarter, or a fiscal year. It answers a straightforward question: during this window of time, did the business bring in more than it spent? The statement builds toward that answer in a logical sequence. It begins with revenue, the total value of goods sold or services delivered, then subtracts the costs directly tied to producing that revenue, such as raw materials, manufacturing labor, and shipping. What remains is gross profit, a measure of how efficiently the core offering converts sales into margin before overhead enters the picture. From gross profit, the statement deducts operating expenses like salaries, rent, marketing, and depreciation, along with interest on debt and taxes. The figure left at the bottom is net income, the profit that belongs to the owners after every obligation has been accounted for.
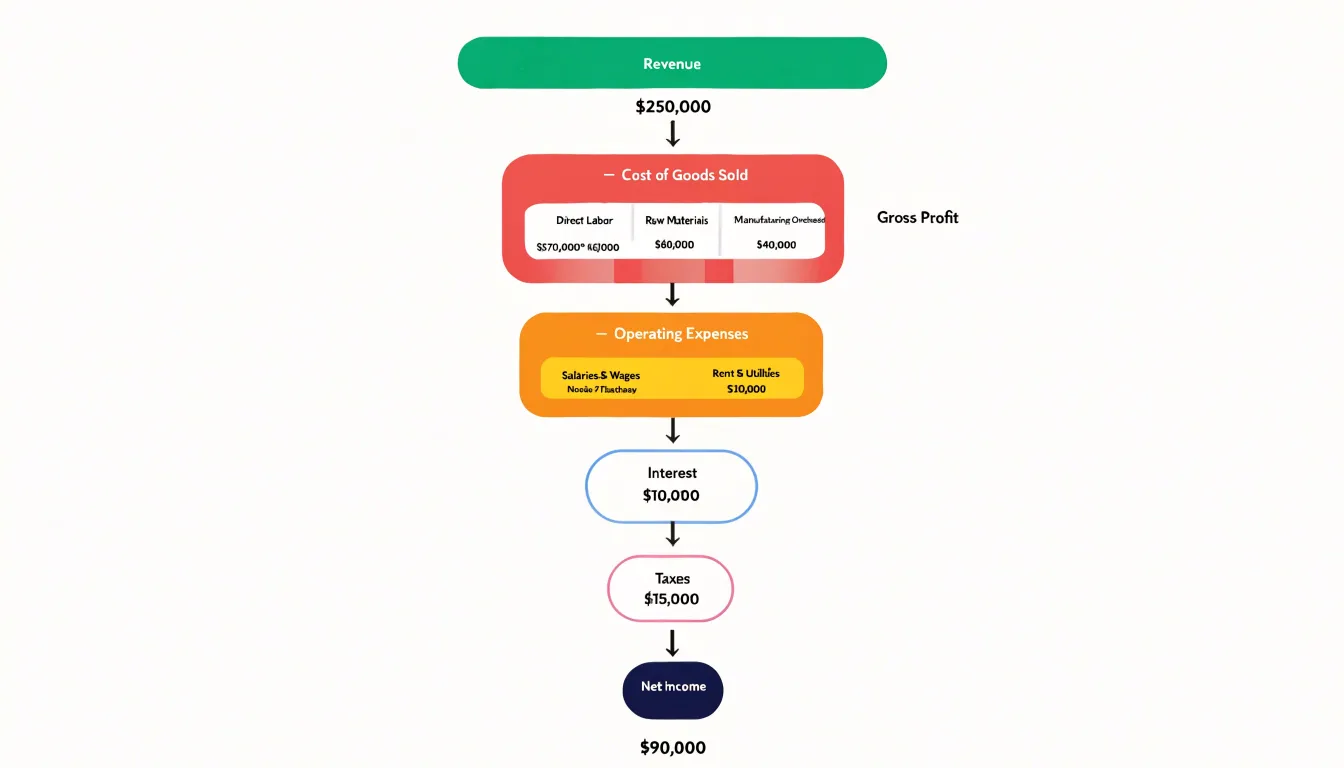
The distinction between gross and net profit carries real interpretive weight. A strong gross profit shows that the product itself is priced and produced well. A thin net profit alongside that strong gross figure points to heavy operating costs eating the margin, which tells a very different story about where management should focus attention.
Timing is central to reading an income statement correctly. The statement captures flows over a period, so a single strong quarter can reflect a seasonal surge or a one-time gain, just as a weak quarter may follow unusual expenses. Comparing consecutive periods reveals trends that any single snapshot would hide. Timing also matters because revenue is recorded when it is earned, under accrual accounting, which can diverge from when cash actually arrives. A company can report healthy net income while collecting little cash, and the statement alone will not show that gap. Recognizing the period covered and the accounting conventions behind the numbers lets a reader judge whether reported profit reflects durable performance or a passing moment.
Understanding the Balance Sheet as a Snapshot of Assets and Debt
The balance sheet offers a snapshot of a company’s financial position at a specific moment, typically the end of a reporting period. It is governed by the fundamental accounting equation: assets equal liabilities plus equity. Assets represent what the company owns—such as cash, inventory, property, and equipment. Liabilities are what the company owes to others, including loans, accounts payable, and other obligations. Equity, often called shareholders’ equity, is the residual interest in the assets after deducting liabilities. This equation must always balance, reflecting the dual aspect of accounting: every transaction affects at least two accounts.
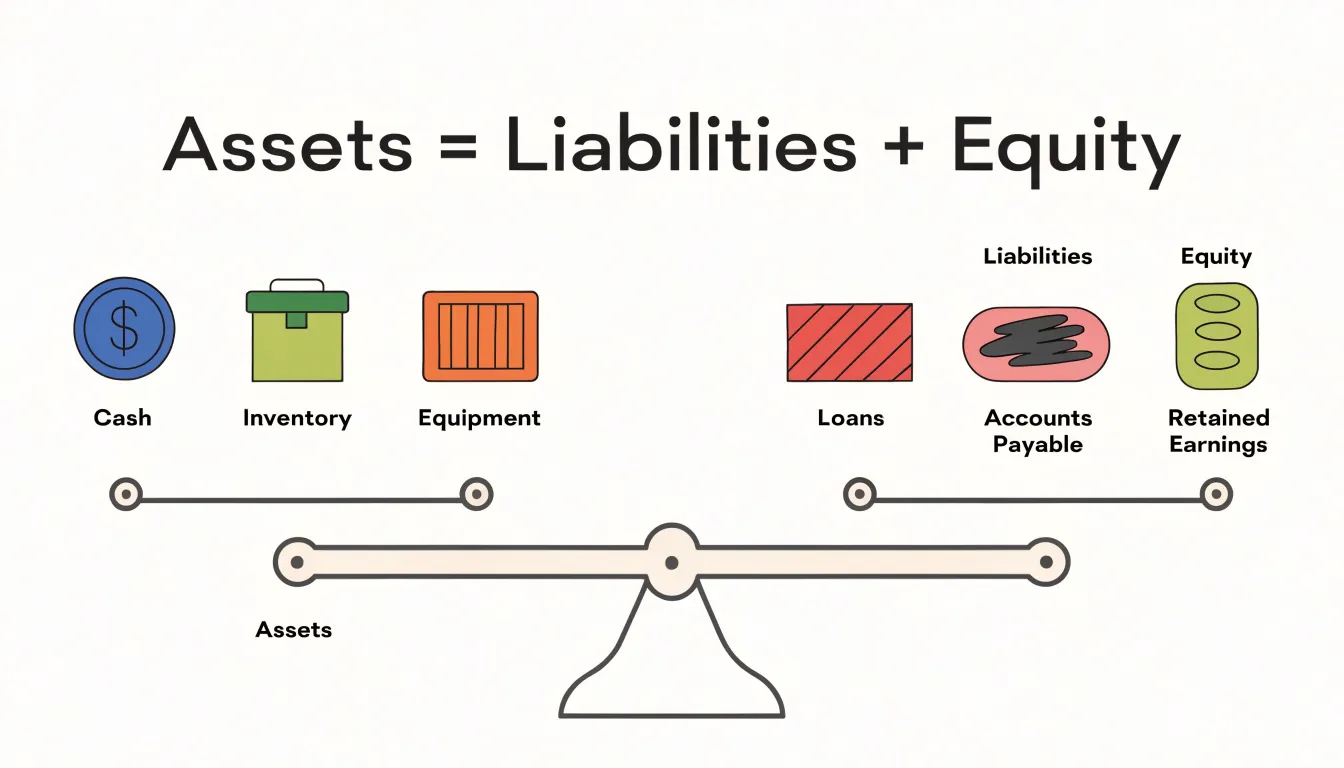
On the balance sheet, items are classified as current or non-current based on their liquidity and time horizon. Current assets are expected to be converted into cash or used up within one year, such as cash, accounts receivable, and inventory. Non-current assets are long-term investments, property, plant, equipment, and intangible assets like patents. Similarly, current liabilities are obligations due within one year, such as accounts payable and short-term debt. Non-current liabilities are long-term obligations, such as bonds payable and lease liabilities. This classification helps users assess the company’s short-term financial flexibility and long-term solvency.
The balance sheet provides critical insights into financial health at a single point in time. By comparing current assets to current liabilities, stakeholders can calculate the current ratio, a measure of liquidity. A ratio above one suggests the company can meet its short-term obligations. The debt-to-equity ratio, derived from total liabilities and equity, indicates financial leverage and risk. Additionally, the composition of assets and liabilities reveals how efficiently a company manages its resources and finances its operations. For instance, a high proportion of debt relative to equity may signal higher financial risk, while a strong equity base suggests resilience. However, the balance sheet is static; it does not show the flows that led to the position. Therefore, it is most useful when analyzed alongside the income statement and cash flow statement, which capture performance and cash movements over time. Together, these statements provide a comprehensive view of a company’s financial story.
The Cash Flow Statement
The cash flow statement tracks the actual movement of cash into and out of a business over a period, providing a clear picture of liquidity and operational health. It is divided into three sections: operating activities, investing activities, and financing activities. Operating activities encompass the cash generated or used in the core business, such as cash received from customers and cash paid to suppliers and employees. This section adjusts net income for non-cash items like depreciation and changes in working capital, revealing whether the company’s day-to-day operations are producing cash. Investing activities reflect cash flows from buying or selling long-term assets, such as property, equipment, or investments. These outflows often signal growth initiatives, while inflows may indicate asset sales. Financing activities show cash from transactions with owners and creditors, including issuing stock, borrowing, repaying debt, and paying dividends. Together, these sections reconcile the beginning and ending cash balances: the net cash flow from all activities is added to the opening cash balance to arrive at the closing balance. This reconciliation ensures that the statement ties to the balance sheet’s cash figure and provides a transparent view of how cash is generated and utilized, helping stakeholders assess a company’s ability to meet its obligations and fund future growth.
How Net Income Flows Directly Into Retained Earnings
Net income is the final line of the income statement, and it serves as the starting point for the retained earnings calculation on the balance sheet. The mechanical link works like this: once a company finishes its income statement and arrives at net income, that figure is carried directly into the equity section of the balance sheet. Retained earnings at the end of a period equal the beginning retained earnings balance plus net income for the period, minus any dividends paid to shareholders. This simple formula is the bridge that ties the two statements together.
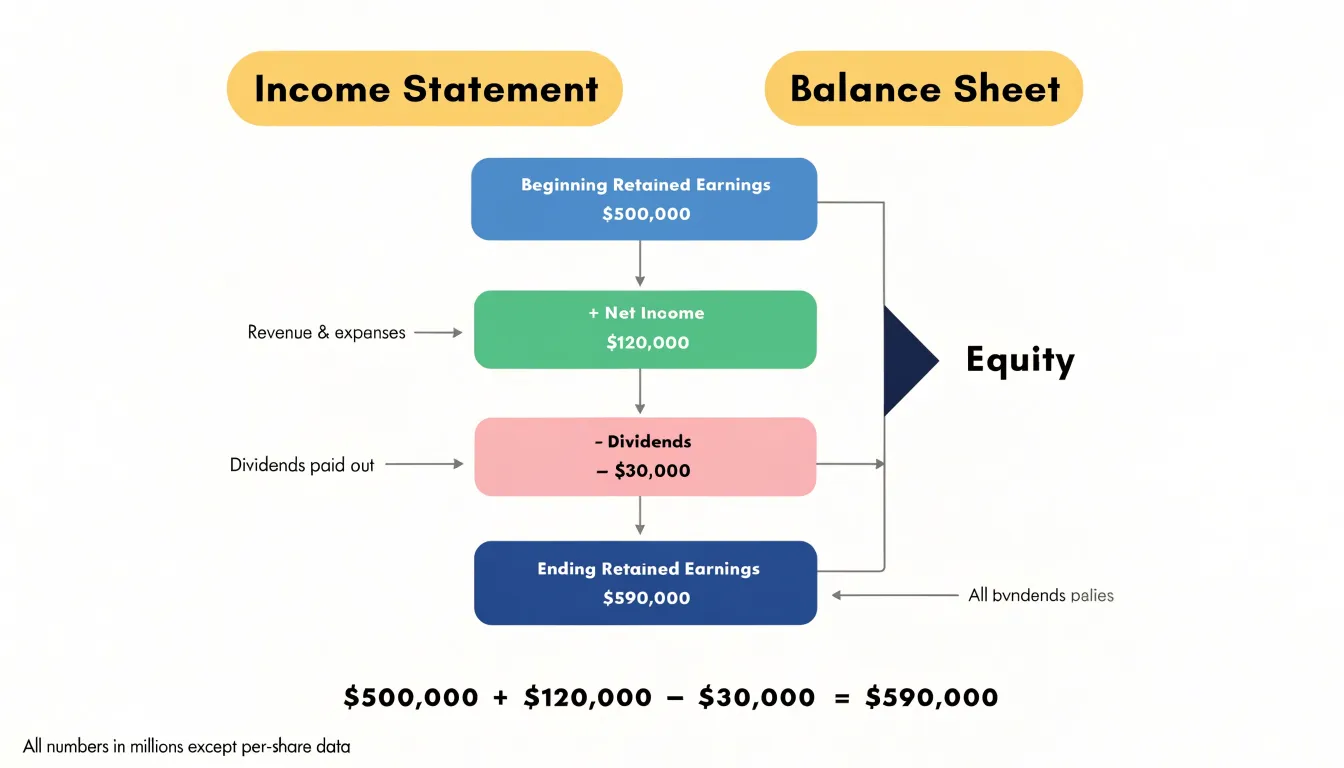
Walking through the mechanics step by step helps clarify the flow. Suppose a company begins the year with $500,000 in retained earnings. Over the course of the year, it reports net income of $120,000 on its income statement. That profit increases the equity that belongs to shareholders, so the retained earnings balance rises to $620,000 before any distributions are made. The net income figure is not modified or recalculated on the balance sheet; it moves across exactly as reported, which is why the two statements must always agree on that number.
Dividends then reduce the balance. If the company pays $30,000 in dividends during the year, that cash leaves the business and is returned to shareholders, so it is subtracted from retained earnings. The ending retained earnings balance becomes $590,000. Dividends appear on the statement of retained earnings and the statement of cash flows, and their effect lands on the balance sheet as a reduction of equity. This is the only routine item that offsets net income in the retained earnings account.
Because of this link, an error in the income statement propagates directly into the balance sheet. If net income is overstated, retained earnings and total equity will be overstated as well, and the balance sheet will no longer balance. Accountants use this relationship as a built-in check: the change in retained earnings should reconcile to net income minus dividends, and any discrepancy signals a problem somewhere in the reporting cycle. Understanding this flow gives readers a reliable way to trace profit from the income statement through to the equity section of the balance sheet.
Why Net Profit Rarely Matches the Actual Cash in the Bank
Net profit is one of the most closely watched numbers on the income statement, yet the balance in a company’s bank account at the end of the year commonly tells a different story. The gap between the two arises because the income statement is prepared under accrual accounting, which records revenue when it is earned and expenses when they are incurred, regardless of when cash actually changes hands. A sale made on credit appears in revenue immediately, even though the customer may not pay for thirty, sixty, or ninety days. Until that payment arrives, the amount sits on the balance sheet as accounts receivable. A company can therefore report a healthy profit while its bank balance stays flat or even shrinks, because the earnings exist on paper as money owed by customers rather than as cash on hand.
The same timing logic applies on the expense side through accounts payable. When a business receives goods or services from a supplier and is billed later, the expense is recorded right away, reducing profit, but the cash has not yet left the company. This works in the opposite direction from receivables: it can make reported profit look lower than the actual cash position, since obligations are recognized before they are paid. The interplay between receivables and payables means that profit and cash can diverge in either direction depending on how quickly a company collects from customers relative to how quickly it pays its suppliers.
Depreciation and other non-cash expenses widen the gap further. When a company buys equipment or a building, the cash outflow occurs at the time of purchase, but accounting spreads the cost across the asset’s useful life as depreciation expense. Each year’s income statement bears a portion of that cost even though no cash leaves the business during those years. Amortization of intangible assets and stock-based compensation follow similar patterns, reducing reported profit without touching the bank account. These entries are essential for matching costs to the periods that benefit from them, which is the core purpose of accrual accounting.
The result is that profit measures economic activity over a period, while the bank balance reflects the timing of actual cash movements. Understanding this distinction helps readers of financial statements see why a profitable company can still face a cash squeeze, and why the cash flow statement is needed alongside the income statement to complete the picture.
Tracing a Single Equipment Purchase Across Every Statement
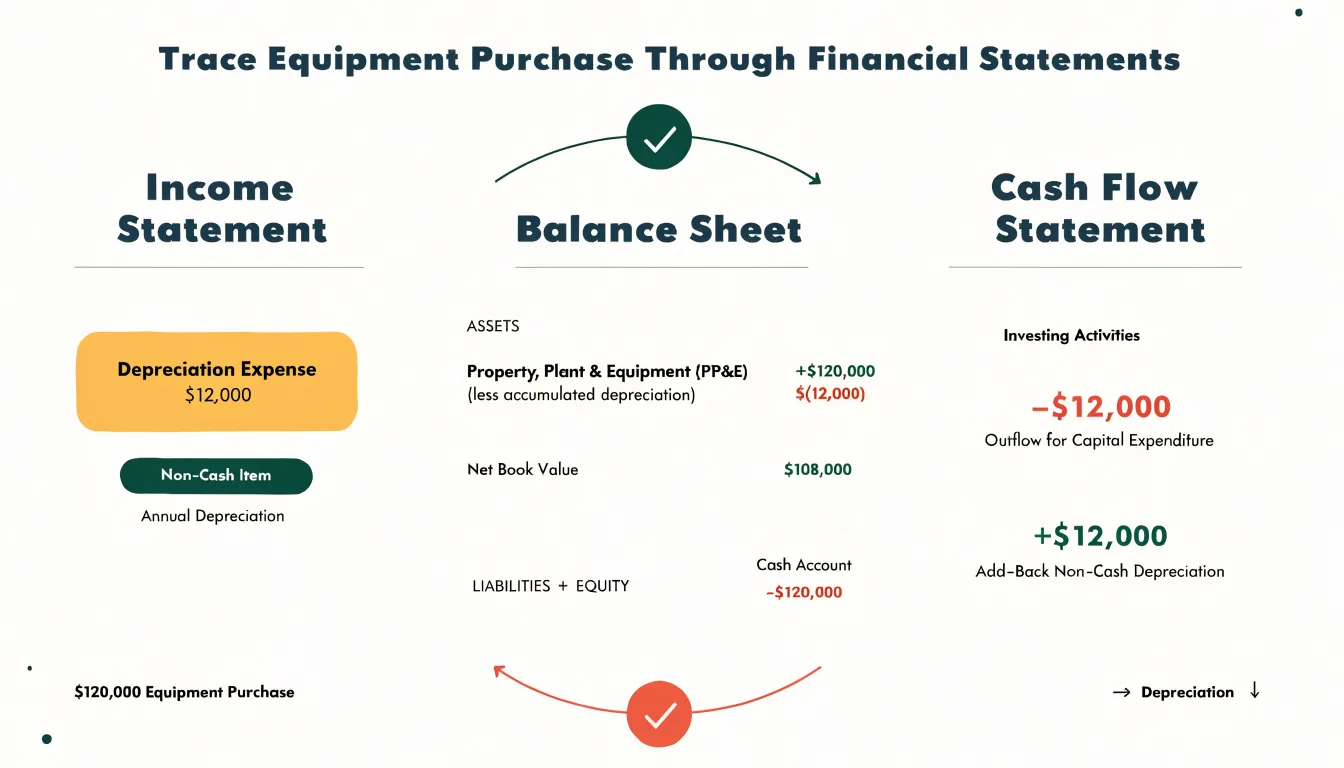
Consider a company that purchases a piece of manufacturing equipment for $120,000 in cash. This single transaction ripples through all three financial statements, and tracing it step by step makes the connections between them concrete. On the income statement, the purchase itself does not appear as an expense at the moment of payment. Instead, the cost is spread over the equipment’s useful life through depreciation. If the company expects the equipment to last ten years with no salvage value and uses straight-line depreciation, it records $12,000 of depreciation expense each year. That $12,000 reduces operating income and, after accounting for taxes, lowers net income. Depreciation is a non-cash charge, which matters when the income statement hands off to the cash flow statement. On the balance sheet, the purchase initially shows up as a shift within assets: cash falls by $120,000, and property, plant, and equipment rises by the same amount. After a full year of depreciation, accumulated depreciation grows by $12,000, so the net book value of the equipment stands at $108,000. Total assets end the year $12,000 lower than they would have been without the depreciation charge, and retained earnings on the equity side reflect the reduced net income. On the cash flow statement, the $120,000 outflow lands in the investing activities section as a purchase of property, plant, and equipment. In later years, the $12,000 depreciation expense is added back in the operating activities section because no cash leaves the business when depreciation is recorded. Put together, the cash flow statement captures the actual $120,000 leaving the company, the income statement spreads the cost over the years that benefit from the equipment, and the balance sheet tracks both the remaining book value and the reduced cash position. Following this one purchase across all three statements shows how a single decision touches profitability, asset values, and liquidity at the same time, and how each statement tells part of a connected story.
Spotting Red Flags by Cross-Checking Your Financial Reports
Reading the three financial statements side by side turns them into an early warning system. One number moving on its own tells you little. Two numbers moving in opposite directions tell you a great deal. Cross-checking the income statement, balance sheet, and cash flow statement against each other is how problems surface before they become crises.
Start with the relationship between profit and cash. Net income on the income statement is an accounting measure shaped by accruals, estimates, and timing. Operating cash flow on the cash flow statement shows what the business actually collected and paid during the period. Healthy companies generally see these two figures track each other over time. When reported profits climb while operating cash flow falls or turns negative, the gap deserves scrutiny. It often means earnings are being propped up by non-cash items, aggressive revenue recognition, or sales that have not converted into cash. A single quarter of divergence can be seasonal; several consecutive periods of it are a pattern worth investigating.
Receivables offer another useful cross-check. Compare the growth rate of accounts receivable on the balance sheet with the growth rate of revenue on the income statement. When receivables expand notably faster than sales, the company is booking revenue it is not collecting. That may point to loosened credit terms, customers in financial distress, or revenue recognized before it is truly earned. Eventually some of those receivables may need to be written off, which hits future earnings. Days sales outstanding, tracked over several periods, makes this trend easy to see.
Retained earnings on the balance sheet provide a third check. The change from one period to the next should reconcile cleanly: prior retained earnings, plus net income, minus dividends paid, adjusted for any specified items. When the math does not tie out, or when adjustments appear without clear explanation, the reconciliation deserves attention. Unexplained movements can signal restatements, prior-period corrections, or items routed around the income statement.
Individually, each of these signals can have an innocent explanation. Together, they form a picture. Building the habit of tying the three statements together each reporting period gives you a practical, low-cost way to catch accounting issues while they are still small.
Frequently Asked Questions
Why do you need three different financial statements instead of just one?
Each financial statement serves a distinct purpose: the income statement focuses on profitability over a period, the balance sheet gives a snapshot of financial position at a specific point in time, and the cash flow statement tracks cash movement and liquidity. No single report can capture all three dimensions, so the statements are interconnected and provide a more holistic view together.
What is the difference between gross profit and net income on the income statement?
Gross profit is what remains after subtracting costs directly tied to producing revenue, such as raw materials, manufacturing labor, and shipping. Net income is what remains after also deducting operating expenses, interest on debt, and taxes.
What does the balance sheet show?
The balance sheet offers a snapshot of a company’s financial position at a specific moment, listing assets, liabilities, and equity. It is governed by the accounting equation that assets equal liabilities plus equity.
What are the three sections of the cash flow statement?
The cash flow statement is divided into operating activities, investing activities, and financing activities. Operating activities cover cash generated or used in the core business, investing activities reflect cash flows from long-term assets, and financing activities show cash from transactions with owners and creditors.
How does net income affect retained earnings on the balance sheet?
Net income is the final line of the income statement and is carried directly into the equity section of the balance sheet. Ending retained earnings equal beginning retained earnings plus net income for the period, minus any dividends paid to shareholders.
Why can a profitable company still have little cash in the bank?
The gap arises because the income statement is prepared under accrual accounting, which records revenue when it is earned and expenses when they are incurred, regardless of when cash actually changes hands. A sale made on credit appears in revenue immediately even though the customer may not pay for thirty, sixty, or ninety days, and non-cash expenses like depreciation can also reduce reported profit without touching the bank account.