
Variable Costs
Variable costs are expenses that change in direct proportion to production or sales volume, such as raw materials, direct labor, packaging, and sales commissions. Total variable cost equals output quantity multiplied by variable cost per unit, while per-unit cost stays constant. Unlike fixed costs, variable costs rise as output increases and fall when output declines.
Table of Contents
- What Are Variable Costs in Business Accounting
- Fixed versus Variable Costs
- Why Do Variable Costs Scale Directly With Production Volume
- How to Calculate Total Variable Cost Using the Standard Formula
- Calculating Average Variable Cost Per Unit Produced
- Real World Examples Across Retail E-Commerce and Manufacturing
- Uncovering Hidden Variable Costs in Service Based Businesses
- How Variable Costs Impact Your Break Even Analysis
- Practical Strategies to Lower Variable Costs Without Sacrificing Quality
What Are Variable Costs in Business Accounting
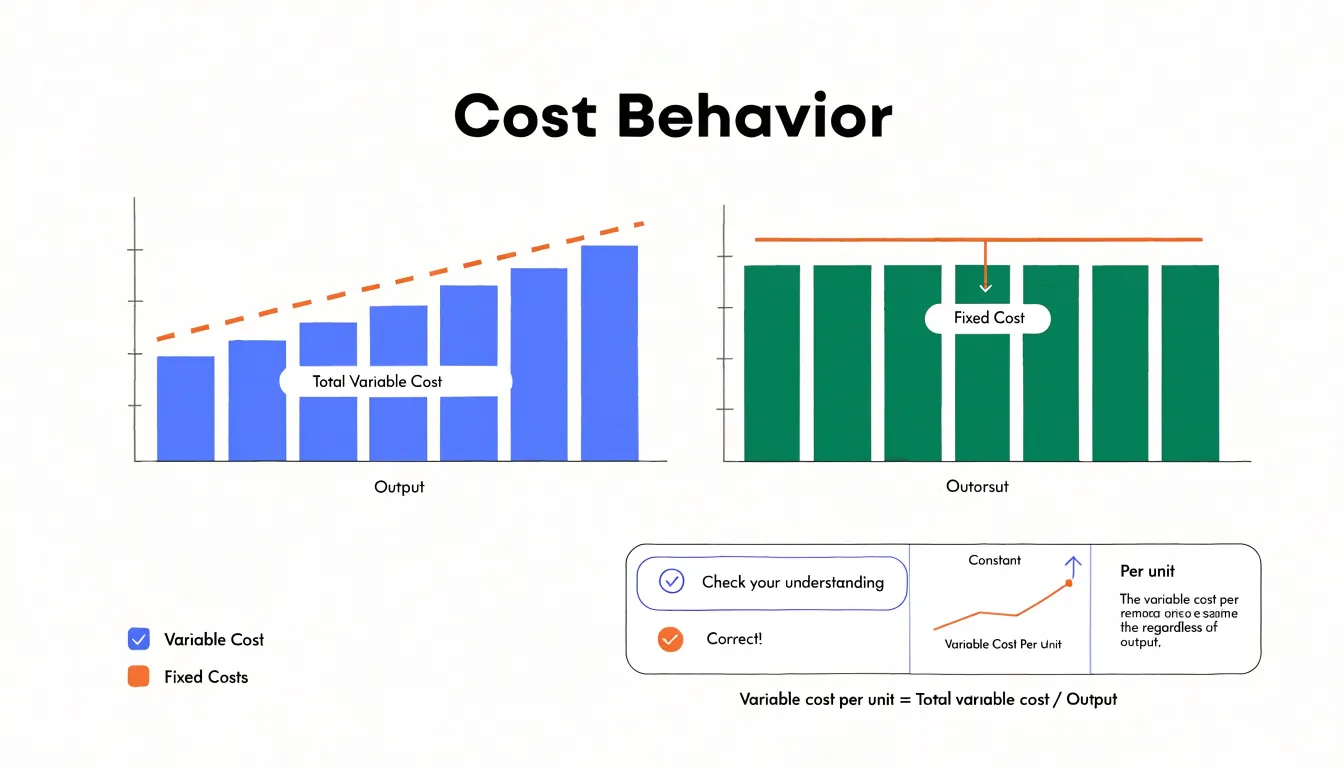
Variable costs are expenses that change in direct proportion to a company’s level of production or sales activity. In business accounting, they are classified as costs that rise as output increases and fall when output declines, remaining constant on a per-unit basis even as the total amount fluctuates. Common examples include raw materials, direct labor tied to production, packaging, sales commissions, and transaction fees. Because these costs scale with volume, they stand in contrast to fixed costs such as rent or salaried management, which stay stable regardless of output within a relevant range.
On the income statement, variable costs are typically recorded within cost of goods sold for manufacturing and retail businesses, capturing the direct materials and labor consumed in producing goods. For service businesses, they may appear as cost of revenue. Under absorption costing, variable manufacturing costs are allocated to inventory and only recognized as expenses when goods are sold, while period costs like variable selling expenses are expensed immediately. Under variable costing, a managerial accounting method, all variable manufacturing costs are treated as product costs and fixed manufacturing overhead is expensed in the period incurred. This distinction affects reported profit and inventory valuation, so accountants and managers must understand which method their statements follow.
Variable costs matter significantly for cost-volume-profit analysis, which examines how changes in volume, price, and cost structure affect operating profit. The contribution margin, calculated as sales minus variable costs, represents the amount available to cover fixed costs and generate profit. Because variable costs move with volume, the contribution margin per unit remains stable, allowing analysts to compute the break-even point, target profit volumes, and operating leverage with clarity. A high proportion of variable costs gives a company more flexibility during downturns, since expenses shrink automatically when sales fall. Conversely, understanding the variable cost ratio helps managers set pricing, evaluate product profitability, and forecast the profit impact of changes in sales volume. In short, proper classification and treatment of variable costs underpin accurate income statements and reliable CVP decisions.
Fixed versus Variable Costs
Fixed costs and variable costs behave in fundamentally different ways as output changes, and understanding that contrast is central to reading your bottom line accurately. Fixed costs remain constant in total across a relevant range of activity. Rent, insurance premiums, salaried management, and equipment depreciation land on the books at the same amount whether you produce a hundred units or a thousand. Because the total stays put, the fixed cost per unit falls as volume rises: the same rent spread over more units shrinks with every additional sale. Variable costs move in the opposite direction. Materials, hourly labor, packaging, and sales commissions rise and fall roughly in proportion to output, so their total changes with volume while their per-unit amount stays relatively stable. This distinction sets the stage for nearly every cost decision that follows.
The mix of these costs determines operating leverage, which describes how sensitive profit is to changes in sales. A business carrying a high proportion of fixed costs has high operating leverage: once sales cover the fixed base, each additional unit contributes heavily to profit, but a downturn cuts deeply because the fixed obligations remain. A business weighted toward variable costs has lower operating leverage, with profits that move more gently in both directions. Knowing where you sit on this spectrum tells you how much risk your cost structure carries and how much sales cushion you need before reaching the break-even point.
Pricing decisions draw directly on both behaviors. Variable costs establish the floor beneath which a price cannot sustainably fall, since every sale must at least cover the costs incurred to make it. Fixed costs must be recovered across the full volume of sales, which means pricing has to generate enough total contribution to clear that base. Profitability emerges from the interplay: contribution margin per unit multiplied by volume must exceed fixed costs. When you raise prices or shift costs from fixed to variable, you change the volume required to break even. When you invest in fixed capacity, you bet on future volume to justify it. Mapping each expense into the right category gives you a clearer picture of how volume, price, and profit connect in your operation.
Why Do Variable Costs Scale Directly With Production Volume
Variable costs scale directly with production volume because they are incurred by the act of producing each additional unit. The economic logic rests on a simple observation: some inputs are consumed in proportion to output. Every additional unit manufactured requires its own share of raw materials, its own packaging, its own energy to run the machines, and its own slice of direct labor time. When production doubles, the consumption of these inputs doubles as well, and when production falls, consumption falls with it. This direct proportionality makes variable costs distinct from fixed costs, which remain largely unchanged across a range of output levels because they support capacity rather than individual units.
Raw materials offer the clearest illustration. A furniture maker building one hundred tables needs one hundred tabletops, four hundred legs, and the corresponding screws, glue, and finish. Building two hundred tables requires exactly twice those inputs, assuming no waste or spoilage. The cost of materials rises in step with the number of tables because each table embodies a fixed quantity of material. Direct labor behaves similarly in many settings. If a worker is paid per piece assembled, or if staffing is adjusted to match the line’s pace, the labor cost attributable to each unit stays roughly the same, and total labor cost grows with the number of units produced. Packaging, sales commissions, and per-unit shipping charges follow the same pattern.
The assumption of a constant variable cost per unit is central to this model. It treats the cost of each unit as stable, so total variable cost equals unit variable cost multiplied by quantity. This simplification holds well over the normal operating range, where input prices are steady and production processes are efficient. In practice, the constant per-unit figure is an average that smooths over minor variations such as quantity discounts on bulk materials or small changes in worker productivity. Analysts accept this approximation because it yields a reliable, linear relationship between volume and cost, which supports straightforward calculations of contribution margin, break-even points, and incremental profitability. Where the assumption strains, as with steep volume discounts or capacity constraints that force overtime premiums, the model can be refined with stepped or nonlinear cost functions, but the underlying logic of proportionality remains the foundation for understanding how variable costs behave.
How to Calculate Total Variable Cost Using the Standard Formula
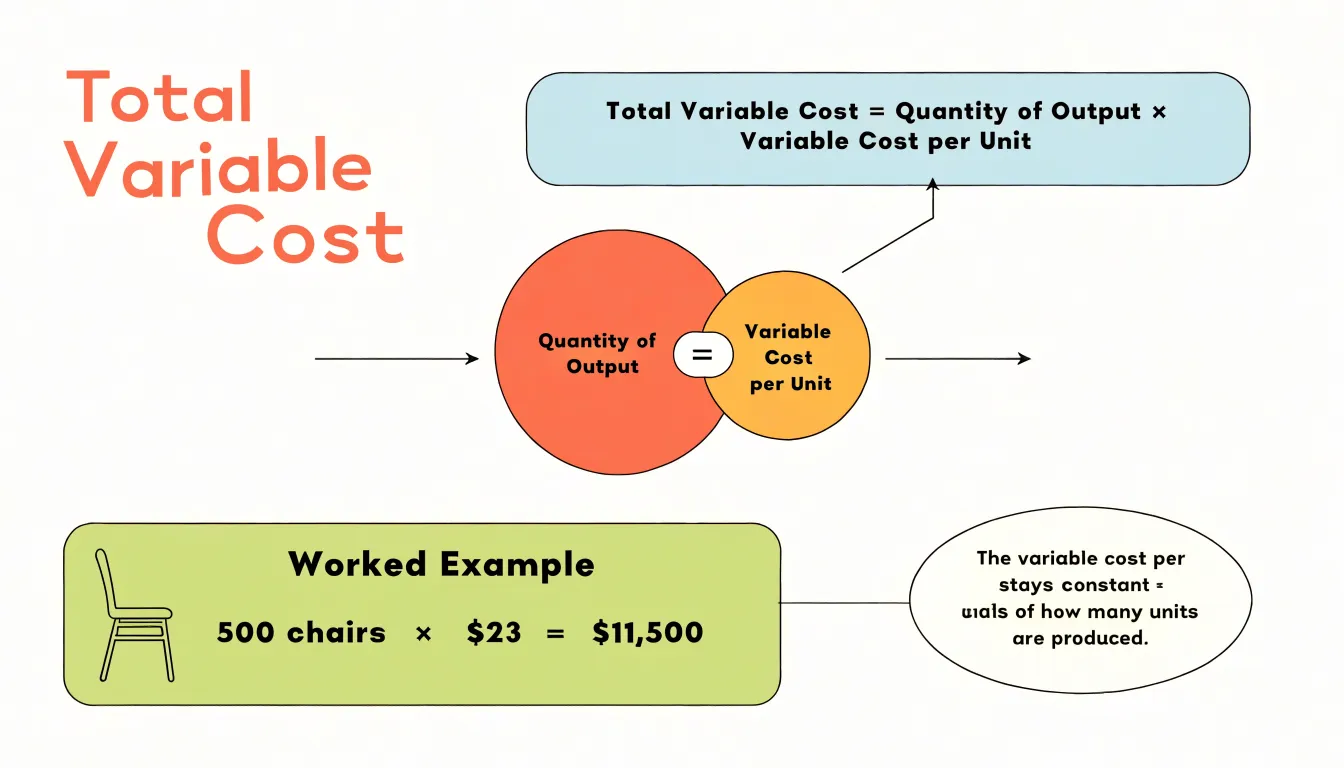
Calculating total variable cost begins with identifying every expense that rises or falls with the level of production. The standard formula is straightforward: Total Variable Cost = Total Quantity of Output × Variable Cost per Unit. In practice, this means listing each variable component separately, determining its per-unit rate, and then multiplying by the number of units produced during a given period. Doing the work component by component keeps the calculation transparent and makes it easier to spot which costs are driving changes over time.
A step-by-step walkthrough helps clarify the process. First, define the production period you are analyzing, such as a single month or a specific batch run. Second, list all costs that behave variably within that period. Common examples include raw materials, direct labor paid per unit, packaging, and variable portions of utilities or shipping. Third, determine the quantity of each input required per unit of output, along with its price. Fourth, multiply quantity per unit by price to get the variable cost per unit for that component. Fifth, multiply that component rate by total output to find the component’s total variable cost. Finally, sum the component totals to arrive at the overall total variable cost.
Consider a small furniture workshop producing 500 chairs in a month. The workshop identifies three variable cost components. Lumber costs $12 per chair, upholstery fabric costs $8 per chair, and finishing supplies cost $3 per chair. The combined variable cost per unit is $12 + $8 + $3 = $23. Multiplying by output gives $23 × 500 = $11,500 in total variable cost for the month. If output rises to 600 chairs with the same per-unit rates, total variable cost becomes $23 × 600 = $13,800, illustrating how the total scales with volume. This worked example shows how summing individual components produces a clear, verifiable figure that can be used in budgeting, pricing, and break-even analysis. Consistent tracking of each component also allows managers to update the formula quickly when input prices or production methods change.
Calculating Average Variable Cost Per Unit Produced
Average variable cost per unit is calculated by dividing total variable cost by the quantity of units produced. In formula form, AVC equals TVC divided by Q. If a manufacturer incurs $40,000 in variable costs to produce 8,000 units, the average variable cost is $5 per unit. All components of variable cost—direct materials, direct labor, packaging, and variable overhead—feed into the numerator, while the denominator reflects finished output for the same period. Consistency matters here: if the quantity figure counts partially completed units, the cost figure should correspond to that same basis, otherwise the ratio will misstate the true per-unit burden.
Interpreting the result ties the number to production volume. Average variable cost describes the variable expense embedded in each unit at a given level of output, so as activity changes, the figure moves in response. Managers use it to set price floors, evaluate contribution margins, and model how profit shifts when volume rises or falls. A clear picture of the average variable cost also supports break-even analysis, since a price above the average variable cost contributes toward covering fixed costs.
The relationship with marginal cost adds a second dimension. Marginal cost measures the extra expense of producing one additional unit, while average variable cost spreads total variable expense across all units. When marginal cost sits below average variable cost, each new unit pulls the average down. When marginal cost sits above the average, each new unit pulls the average up. The point where the two intersect marks a boundary in short-run cost behavior.
Economies of scale come into play as volume grows. Spreading variable inputs over larger batches—through improved purchasing terms, more efficient labor use, or reduced setup frequency—can lower the average variable cost per unit. Eventually the decline may flatten or reverse as capacity limits and coordination demands push marginal cost higher, lifting the average. Tracking the calculation across output levels, not just at a single point, reveals where efficiency gains give way to strain.
Real World Examples Across Retail E-Commerce and Manufacturing
Variable costs appear in distinctive forms across retail, e-commerce, and manufacturing, and seeing them in concrete settings makes the concept easier to apply. In retail, packaging is a classic example: every unit sold requires boxes, bags, labels, and protective materials, so packaging expense rises and falls with sales volume. Shipping costs behave the same way, since each order shipped adds carrier fees, fuel surcharges, and handling charges. Payment processing fees also scale directly with transactions, typically calculated as a percentage of the sale plus a fixed amount per transaction, meaning busier sales periods translate into proportionally higher fees. Seasonal retailers see these patterns clearly, as a holiday surge in orders drives up packaging, shipping, and card processing costs in step with revenue.

In e-commerce, fulfillment and returns processing provide further illustrations. Fulfillment covers picking, packing, and dispatching each order, and third-party logistics providers often charge per item or per shipment, so costs track order volume. Returns processing adds another layer: each returned item involves inspection, restocking, refund administration, and sometimes reshipping, all of which increase with the number of returns rather than remaining fixed. A seller running a promotional event that doubles order volume will typically see fulfillment and returns costs double as well, which is why margin planning must account for these per-unit expenses.
Manufacturing offers perhaps the clearest examples. Raw materials are the most direct variable cost, since producing more units requires proportionally more steel, fabric, plastic, or components. Direct labor follows a similar logic when workers are paid per unit produced or when additional shifts are scheduled to meet demand. Energy consumption also varies with output, as running machinery longer and at higher intensity increases electricity and fuel use. A factory that doubles its production run will generally double its material, direct labor, and energy costs, even though its rent and equipment depreciation stay unchanged. Together, these examples show how variable costs take different shapes depending on the business, yet share the same defining trait: they move with the level of activity.
Uncovering Hidden Variable Costs in Service Based Businesses
Service-based businesses tend to have cost structures that look simpler than those of product companies, which makes it easy to assume that most expenses are fixed. In practice, several variable costs run quietly beneath the surface, and these are the ones most often overlooked when owners build budgets or set prices. Contractor payments are a prime example. Many service firms rely on freelance specialists, subcontractors, or part-time professionals to handle overflow work or niche projects. Each engagement adds a direct cost that scales with the volume of business, yet because these payments arrive as invoices rather than payroll, they can slip outside the regular cost review and distort the true margin on each project.

Software usage fees create a similar pattern. Service businesses depend on project management platforms, billing tools, communication apps, and design or analytics software, and most of these charge per user, per seat, or per transaction. As the team grows or a client load expands, subscription costs climb in step with activity. Seat-based pricing means every new hire adds a recurring charge, and usage-based tiers mean heavy months cost more than light ones. Without tracking these fees against revenue, a firm can find a meaningful share of its gross margin absorbed by tools that seemed inexpensive at sign-up.
Customer acquisition costs belong on this list as well. Referrals and word of mouth may dominate new business early on, but growth typically requires spending on advertising, content production, events, or sales outreach. These outlays rise and fall with the pace of new client pursuit and behave as variable costs even when they are budgeted as a fixed monthly figure. Travel expenses follow the same logic, since client meetings, on-site delivery, and conferences generate costs that scale directly with the number of engagements and the distance involved.
The practical challenge is that none of these costs announce themselves as variable. They arrive as separate line items across different categories, which means they are rarely aggregated and reviewed together. Mapping each one to the revenue it supports gives a service firm a clearer view of its real cost per client and per project, and a firmer foundation for pricing decisions.
How Variable Costs Impact Your Break Even Analysis
Variable costs sit at the center of any break-even analysis because they scale directly with output. The break-even point is the sales volume at which total revenue equals total costs, and since variable costs rise with every additional unit sold, they determine how much of each sale is available to cover fixed expenses. This relationship is captured by the contribution margin, the difference between a product’s selling price and its variable cost per unit. That margin represents the money each sale contributes toward fixed costs and, once those are covered, toward profit. Dividing total fixed costs by the contribution margin per unit yields the break-even quantity in units, while dividing by the contribution margin ratio gives the break-even point in sales dollars.
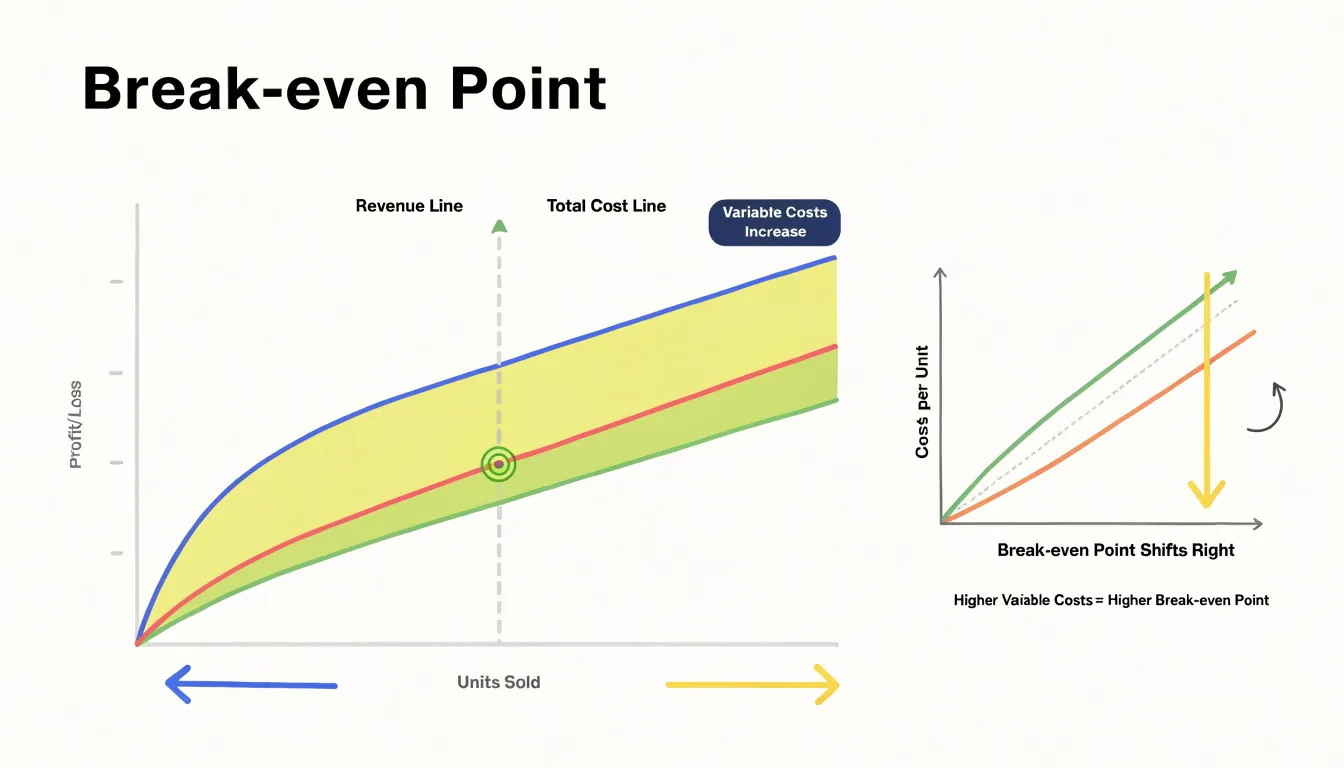
The sensitivity of this calculation to variable cost changes is significant. When variable costs rise, the contribution margin shrinks, and the break-even point moves higher. A company that once needed to sell 5,000 units to break even might suddenly need 6,500 if material or shipping costs climb, forcing a higher sales target or a price adjustment. Conversely, reducing variable costs through better supplier terms, process improvements, or economies of scale lowers the break-even threshold and gives the business more cushion before losses begin.
Managers use this relationship in several practical ways. They can model scenarios by plugging different variable cost assumptions into the contribution margin formula to see how sensitive the break-even point is to price shifts in raw materials or labor. They can also compare product lines: items with high contribution margins require fewer sales to justify their share of fixed costs, which informs decisions about promotion and resource allocation. Pricing decisions often hinge on the same logic, since a price change alters the contribution margin in ways that can be tested against the break-even calculation before a new strategy is adopted. Understanding how variable costs drive the contribution margin gives decision-makers a concrete tool for evaluating risk, setting sales targets, and responding to cost changes in the operating environment.
Practical Strategies to Lower Variable Costs Without Sacrificing Quality
Lowering variable costs begins with a close examination of supplier relationships, since contract terms often carry more room for adjustment than they first appear to. Revisit agreements before renewal cycles rather than after, and come prepared with data on order volumes, payment history, and comparative market rates. Suppliers frequently respond well to proposals that trade longer commitments or steadier order patterns for better unit pricing. Bundling purchases across product lines with a single vendor can also unlock volume discounts that separate orders would never reach. Bulk purchasing offers similar leverage, though it only pays off when storage capacity, shelf life, and realistic consumption forecasts are taken into account; overstocking converts a cost saving into a write-off. Where demand fluctuates, consider negotiating tiered pricing that rewards larger orders without forcing a commitment to volumes you may not use.
Process automation addresses variable costs from a different angle by shrinking the labor and error costs embedded in repetitive tasks. Automating invoicing, inventory tracking, or order processing reduces the hours spent on manual work and the costly mistakes that accompany fatigue. The key is to target high-frequency, rules-based activities first, where the return on the investment is easiest to measure. Waste reduction deserves equal attention, because material losses, rework, and energy inefficiency are variable costs that quietly accumulate. Simple practices such as tracking scrap rates, reviewing production schedules for changeover waste, and auditing utility usage often surface savings that require little capital outlay. Outsourcing non-core functions can convert fixed obligations into variable ones, giving the business flexibility to scale spending with demand, provided the provider’s quality standards are written into the agreement and monitored.
Quality protection runs through every one of these tactics. Define acceptable quality thresholds before negotiating, so cost discussions have a clear boundary. Build service-level agreements and penalty clauses into supplier and outsourcing contracts, and schedule regular quality checks rather than relying on spot inspections. Engage frontline staff in cost-reduction efforts, since they notice waste and inefficiency that spreadsheets miss, and their buy-in prevents savings from eroding morale or workmanship. Review results quarterly to confirm that savings are real and that quality metrics hold steady.
Frequently Asked Questions
What are variable costs in business?
Variable costs are expenses that change in direct proportion to a company’s level of production or sales activity, rising as output increases and falling when output declines. Common examples include raw materials, direct labor tied to production, packaging, sales commissions, and transaction fees.
How do variable costs differ from fixed costs?
Fixed costs remain constant in total across a relevant range of activity, while variable costs rise and fall roughly in proportion to output. As volume rises, fixed cost per unit falls, but variable cost per unit stays relatively stable.
What is the formula for total variable cost?
The standard formula is Total Variable Cost = Total Quantity of Output × Variable Cost per Unit. You can calculate it component by component, then sum the component totals to arrive at the overall total variable cost.
How is average variable cost per unit calculated?
Average variable cost per unit is calculated by dividing total variable cost by the quantity of units produced, or AVC = TVC ÷ Q. For example, $40,000 in variable costs to produce 8,000 units equals $5 per unit.
How do variable costs affect break-even analysis?
Variable costs determine how much of each sale is available to cover fixed expenses because they rise with every additional unit sold. When variable costs rise, the contribution margin shrinks and the break-even point moves higher; reducing variable costs lowers the break-even threshold.
What are examples of hidden variable costs in service-based businesses?
Hidden variable costs in service businesses can include contractor payments, per-user or per-transaction software usage fees, customer acquisition costs, and travel expenses. These costs scale with activity but may arrive as separate line items rather than being reviewed together.