
WACC Formula
WACC (Weighted Average Cost of Capital) is the blended annual cost of a company’s debt and equity, weighted by each source’s share of total capital. Calculated as WACC = (E/V) × Re + (D/V) × Rd × (1 − Tc), it produces the minimum return a firm must earn on investments to satisfy lenders and shareholders.
Table of Contents
- What Weighted Average Cost of Capital Means for a Business
- Why Finance Teams Depend on WACC for Capital Budgeting
- Breaking Down the Standard WACC Equation
- Step One to Calculating Market Values for Debt and Equity
- Step Two to Estimating Cost of Equity with the Capital Asset Pricing Model
- Step Three to Finding the After Tax Cost of Corporate Debt
- Step Four to Combining Weights and Costs into a Final Rate
- WACC Pitfalls
- How Capital Structure Shifts Impact Your Overall Cost of Capital
What Weighted Average Cost of Capital Means for a Business
Weighted Average Cost of Capital, commonly shortened to WACC, is best understood as the blended price a company pays for the money it uses to operate and grow. Every business draws on two broad pools of funding: debt, such as loans and bonds, and equity, meaning the money shareholders have invested in exchange for ownership. Each pool carries its own cost. Lenders charge interest and expect timely repayment, while shareholders give up the use of their money and expect a return in the form of dividends or a rising share price. WACC combines these costs into a single percentage, weighting each source by how much of the company’s total capital it represents. The result is an overall figure that expresses, in one number, what the company’s capital actually costs on an annual basis.
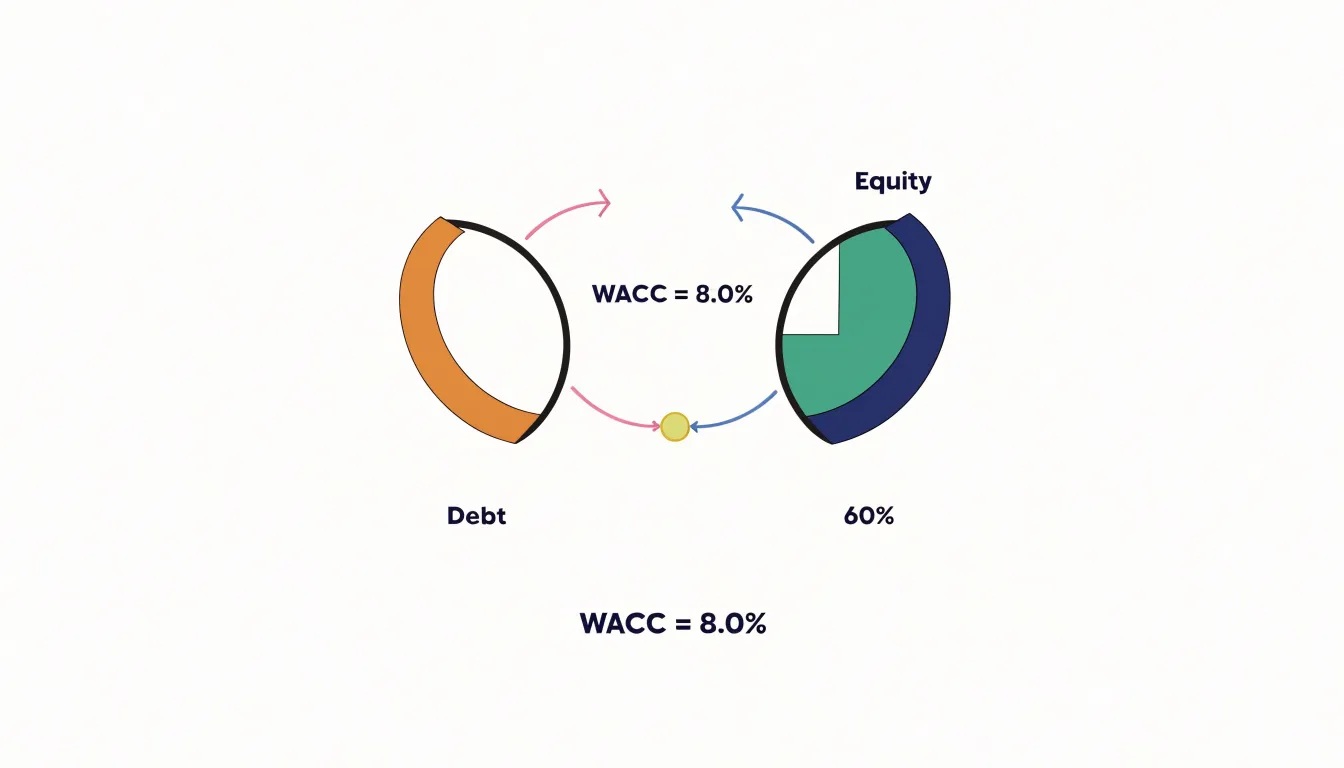
The practical meaning of that number is straightforward. If a company’s WACC works out to 9 percent, the business must generate at least 9 percent on the projects and investments it funds in order to leave its lenders and shareholders no worse off than they would have been elsewhere. Earn less than that, and the company is effectively consuming value: it is taking on risk and using capital without producing enough to compensate the people who supplied that capital. Earn more, and the surplus belongs to the business and can be reinvested or distributed.
This is why WACC functions as a hurdle rate. When managers weigh a new factory, an acquisition, a product line, or any other use of money, they compare the expected return on that proposal against the WACC. A project that clears the hurdle adds value; one that falls short destroys it, even if it looks profitable in isolation. The hurdle rate gives decision-makers a consistent, defensible benchmark, which is especially valuable when a company is choosing among several competing opportunities. It also disciplines capital allocation, because it forces managers to justify spending in terms of the return investors and lenders require. In short, WACC translates the expectations of a company’s financiers into a single test that every investment must pass.
Why Finance Teams Depend on WACC for Capital Budgeting
Finance teams rely on the weighted average cost of capital as the central reference point for capital budgeting because it translates the cost of raising money into a single, comparable hurdle rate. When a company funds itself through a mix of debt and equity, each source carries its own cost: lenders demand interest, and shareholders expect a return that compensates them for risk. WACC blends these costs in proportion to their share of the capital structure, producing the minimum return the business must earn on its assets to keep investors satisfied. That single figure becomes the discount rate applied throughout net present value analysis. By discounting a project’s projected future cash flows back to today’s dollars at the WACC, analysts convert a stream of uncertain future benefits into a present value that can be compared directly against the upfront investment. A positive NPV signals that the project is expected to generate returns above the cost of the capital tied up in it, while a negative NPV signals the opposite.
Beyond individual NPV calculations, WACC functions as a screening tool across the entire pipeline of potential projects. Capital is finite, and finance teams typically face more proposals than they can fund. Using WACC as the threshold, managers can rank opportunities and quickly set aside those whose expected returns fall short of the hurdle rate. This discipline keeps resources flowing toward initiatives with the strongest risk-adjusted prospects and prevents the organization from spreading investment too thinly across marginal ideas. The screening role also standardizes comparisons between projects of different sizes and durations, since every proposal is judged against the same cost-of-capital benchmark.
The deeper strategic value of WACC lies in its role as a test of whether new investments create or destroy value. When a project earns more than the WACC, it generates a surplus above what debt holders and shareholders require, and that surplus accrues to the firm. When a project earns less, it consumes more capital cost than it produces in return, eroding shareholder wealth even if the project appears profitable on an accounting basis. Finance teams use this logic to guide decisions on acquisitions, major equipment purchases, market expansion, and divestitures. Because WACC reflects the firm’s overall risk profile and capital mix, it gives leadership a consistent, defensible standard for judging whether growth is genuinely worthwhile. Recalculating WACC as debt levels, interest rates, or equity risk change keeps the hurdle rate current, so capital budgeting decisions stay aligned with the real cost of funding the business.
Breaking Down the Standard WACC Equation
The standard WACC equation brings together several distinct inputs, and understanding each one clarifies how the final discount rate is assembled. The formula is typically written as WACC = (E/V) × Re + (D/V) × Rd × (1 − Tc), where E represents the market value of equity, D the market value of debt, and V the sum of the two, or total firm value. Each of these variables plays a specific role in shaping the resulting rate.
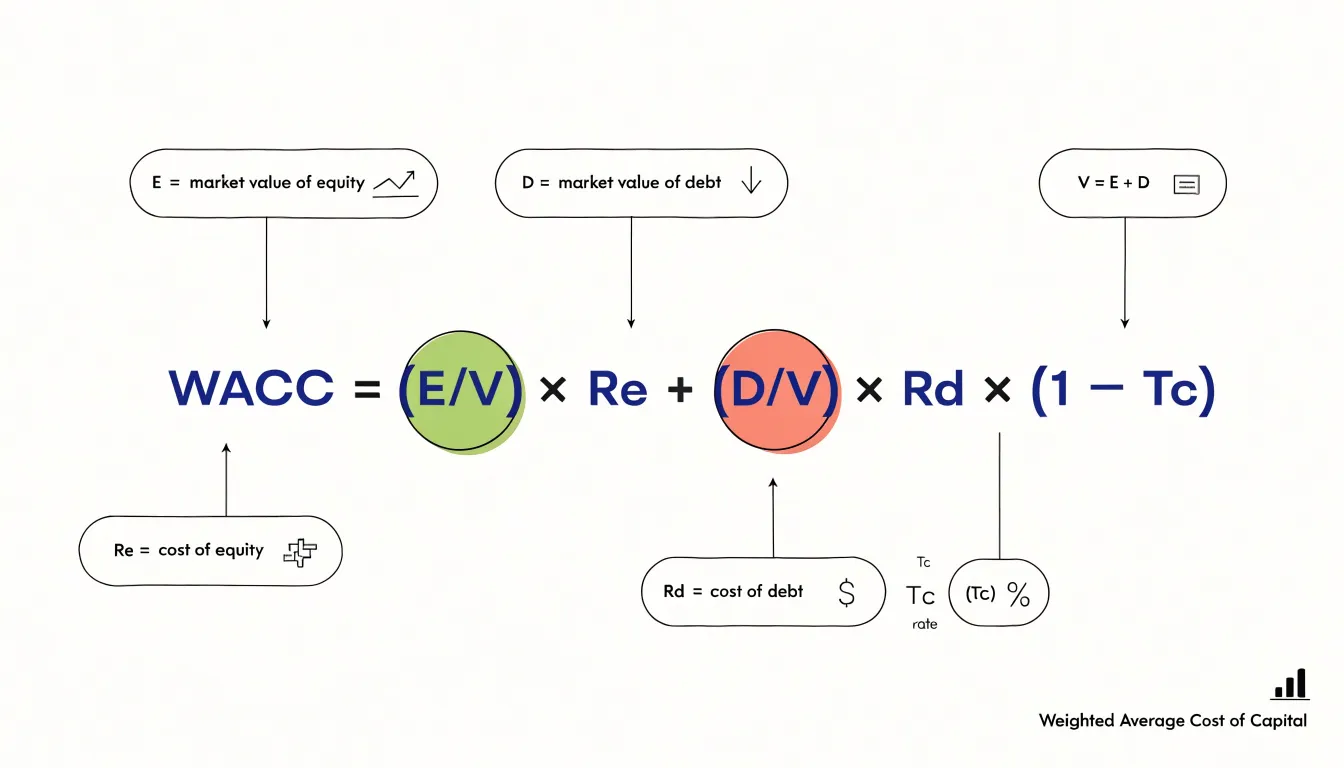
Equity, E, captures the market capitalization of the company, meaning the value investors assign to ownership claims. Debt, D, reflects the market value of borrowed funds, including bonds and other interest-bearing obligations. Total value, V, is simply E plus D, and it serves as the denominator that converts each capital source into a proportional weight. The terms E/V and D/V therefore represent the capital structure weights, showing the share of total financing supplied by shareholders and lenders respectively.
The cost of equity, Re, is the return shareholders require given the risk they bear. It is commonly estimated using models such as the capital asset pricing model, and it generally exceeds the cost of debt because equity holders face greater uncertainty and hold residual claims. The cost of debt, Rd, reflects the interest rate a firm pays on its borrowings, adjusted for the risk profile of the company.
The tax shield enters through the (1 − Tc) factor applied to the debt component, where Tc is the corporate tax rate. Because interest payments are deductible, the effective cost of debt is lower than the stated rate, and this adjustment captures the tax savings associated with debt financing. The weighted sum of these components produces a single blended rate that reflects the overall cost of funding the firm’s assets.
How the weights and costs fit together matters for interpretation. A firm with heavier debt will place more emphasis on the cheaper, tax-adjusted debt cost, which can lower the WACC, while greater reliance on equity raises it. The equation assumes market values and proportions remain stable, so the output represents a snapshot of the firm’s cost of capital at a given point in time.
Step One to Calculating Market Values for Debt and Equity
The first step in calculating the weighted average cost of capital is to establish the market values of the company’s debt and equity, since these values serve as the weights in the overall formula. For equity, the calculation begins with the current share price, which can be taken from any public exchange listing or a recent private valuation. Multiply that price by the total number of shares outstanding, a figure reported on the face of the balance sheet and confirmed in the company’s most recent filings. This product gives the market capitalization, the total value the market currently assigns to the equity claim on the business.
For debt, the process depends on what information is available. When a company’s bonds or loans trade actively, the market price of each instrument can be obtained from exchange quotes or dealer pricing, and those prices are multiplied by the outstanding principal to arrive at a market value. For many private companies, and for bank loans or privately placed notes where no quoted price exists, the book value of the debt reported on the balance sheet serves as a practical proxy, on the reasoning that debt’s market value tends to stay close to its carrying amount when interest rates and the company’s credit standing have not shifted dramatically since issuance.
Using market values rather than book values matters because the WACC is meant to reflect the cost of raising capital today. Investors price equity and debt based on current expectations about future cash flows and risk, and those prices shift continuously with interest rates, earnings news, and market sentiment. Book values, by contrast, record historical transactions and can diverge substantially from what the capital is actually worth. A company whose shares have tripled since its founding will carry an equity weight far larger than its original book equity, and using the book figure would distort the weights and understate the true cost of equity capital. Market values therefore give a WACC that mirrors the financing mix a company would face if it raised funds in the market now, which is the basis on which investment and valuation decisions should be made.
Step Two to Estimating Cost of Equity with the Capital Asset Pricing Model
Step Two of estimating the cost of equity with the Capital Asset Pricing Model centers on assembling the three inputs that make up the CAPM equation: the risk-free rate, the stock’s beta, and the equity risk premium. Each input comes from a different source, and each carries its own estimation challenges that analysts must navigate carefully.
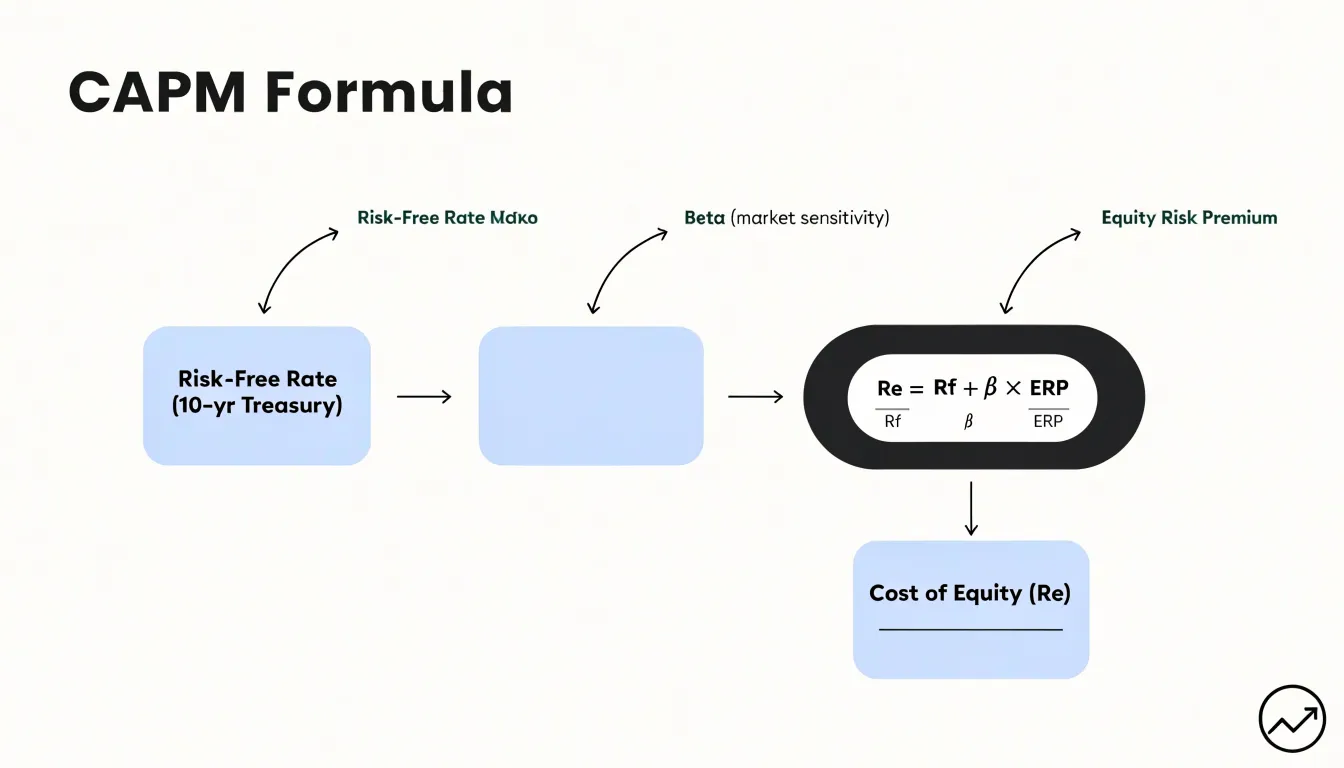
The risk-free rate typically comes from the yield on a long-term government bond, most often a 10-year Treasury note in the United States. This yield is readily available from financial data providers, central bank publications, and Treasury department websites. The main challenge here lies in matching the maturity of the risk-free rate to the investment horizon being analyzed. Using a short-term rate for a long-horizon valuation can distort the result, and in markets where government debt carries default risk, analysts may need to adjust the rate to reflect a truly default-free benchmark.
Beta measures the sensitivity of a stock’s returns to movements in the broader market. It can be sourced from financial data platforms such as Bloomberg, Reuters, or services like Morningstar, which publish regression-based betas against a market index. The estimation challenge is significant: betas vary depending on the time period, return frequency, and benchmark index chosen. Historical betas also tend to revert toward one over time, so many analysts adjust raw betas using techniques like the Blume method or peer-group averaging to produce a more stable forward-looking estimate.
The equity risk premium represents the excess return investors expect from the stock market over the risk-free rate. Sources include historical return studies, such as those published by Damodaran or Ibbotson, as well as implied premiums derived from current market prices and forecast earnings. The challenge is that historical premiums can vary widely depending on the sample period and geography, while implied premiums shift with market sentiment. Analysts must choose a premium that reflects the market and time horizon of their valuation.
Once all three inputs are gathered, they are combined as the risk-free rate plus beta multiplied by the equity risk premium. Careful sourcing and awareness of these estimation challenges help ensure the resulting cost of equity is a reliable input for the WACC calculation.
Step Three to Finding the After Tax Cost of Corporate Debt
Step Three in the WACC construction process focuses on determining the after-tax cost of corporate debt, which represents the effective rate a company pays on its borrowings once the tax deductibility of interest is taken into account. The starting point is the effective interest rate on the company’s debt. This rate reflects the actual cost of borrowing, incorporating the coupon or stated rate along with any fees, discounts, or premiums associated with issuing the debt. For a single bond issue, the yield to maturity is commonly used as the pre-tax cost of debt because it captures the total return investors require given the bond’s current market price. When a company carries multiple debt instruments with different rates and maturities, a weighted average of the individual yields, weighted by each instrument’s market value, produces a representative pre-tax rate for the entire debt portfolio. The market value of debt is preferred over book value because it aligns with how the other WACC components are measured. Once the pre-tax rate is established, the next adjustment reflects the tax shield on interest. Interest payments are treated as a deductible expense in most tax jurisdictions, which lowers taxable income and, consequently, the tax bill. This reduction means the government effectively subsidizes part of the interest cost. To capture this benefit, the pre-tax rate is multiplied by (1 minus the marginal tax rate). For example, if a company’s pre-tax cost of debt is 7 percent and its marginal tax rate is 25 percent, the after-tax cost of debt is 7% × (1 – 0.25) = 5.25%. The resulting figure is the rate that flows into the WACC calculation, properly reflecting the true economic burden of debt financing after accounting for the tax shield. Using the marginal tax rate rather than the effective rate is generally preferable, since new financing decisions affect income at the margin. This adjustment ensures the WACC captures the actual cost of debt capital net of its tax advantages.
Step Four to Combining Weights and Costs into a Final Rate
The final step in the WACC calculation takes the individual costs of each capital component and combines them with their corresponding proportional weights. Having already determined the cost of debt, the cost of preferred stock where applicable, and the cost of equity, and having established what share of the total capital structure each of these sources represents, the analyst now multiplies each component’s cost by its weight. For example, if debt makes up 40 percent of the capital structure and carries an after-tax cost of 5 percent, the weighted contribution of debt is 0.40 multiplied by 5 percent, or 2 percent. If equity represents the remaining 60 percent and its cost is 10 percent, the weighted contribution of equity is 0.60 multiplied by 10 percent, or 6 percent. These weighted contributions are then summed, producing a final WACC figure of 8 percent in this illustration.
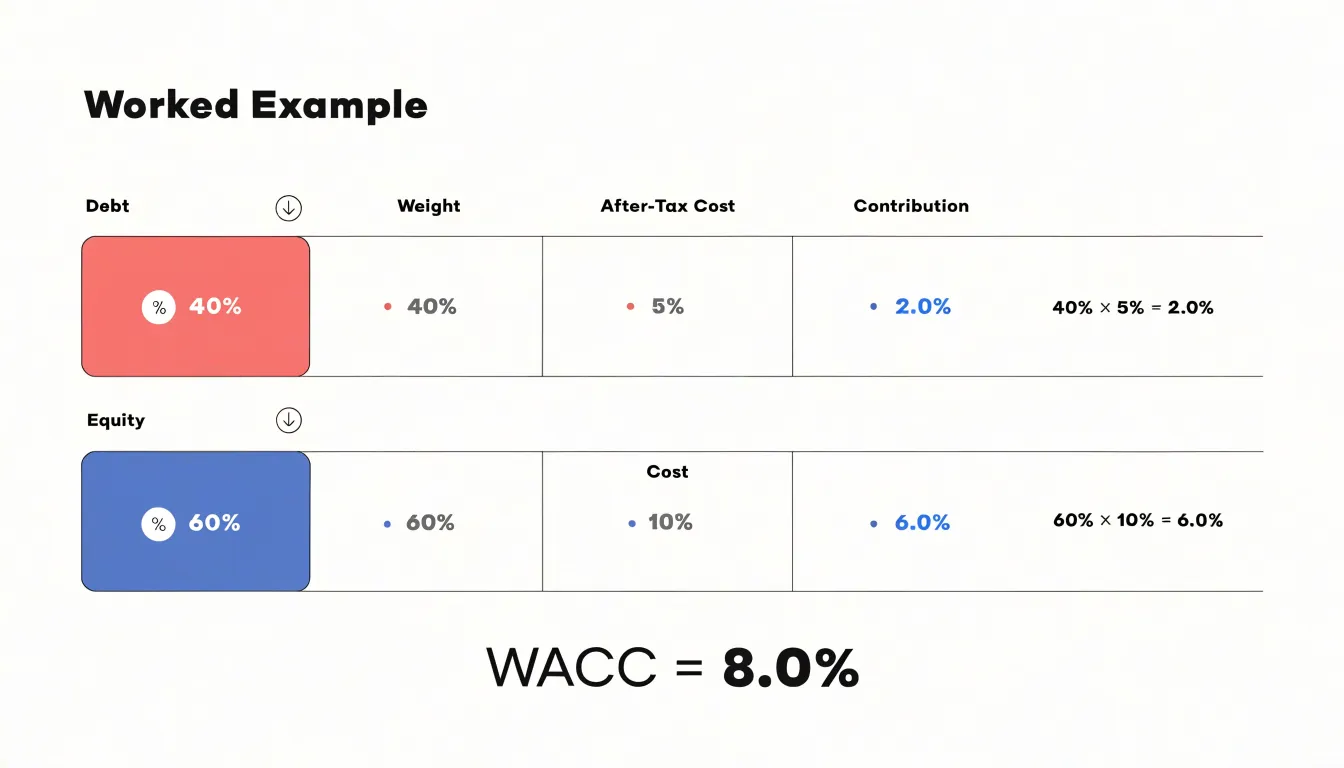
The mechanics of this step are straightforward, yet the arithmetic carries real consequences for every downstream valuation and capital budgeting decision. Each weighted component reflects both how expensive a source of capital is and how heavily the company relies on it, so the sum captures the blended cost the firm must earn on its investments to satisfy all of its capital providers. A company that leans heavily on debt will see the lower cost of debt pull the overall rate down, while a company financed mostly through equity will carry a higher blended rate. Because the weights must sum to one, the resulting figure represents a weighted average in the literal sense: a single rate that stands in for the entire mix of financing sources.
Careful attention to consistency at this stage helps preserve the integrity of the final number. The weights should correspond to the same measurement basis used for the cost figures, typically market values of debt and equity rather than book values, so that the proportions reflect current financing realities. Rounding should be managed so that small discrepancies across components do not distort the final rate. Once computed, the WACC serves as the discount rate for evaluating prospective projects and acquisitions, and as the hurdle rate against which expected returns are judged. Presenting the weighted contributions alongside the final sum also gives readers of the analysis a clear view of which components drive the overall result, lending transparency to the conclusion.
WACC Pitfalls
The weighted average cost of capital is one of the most consequential inputs in any financial model, yet small missteps in its construction can quietly distort every valuation, capital budgeting decision, and investment appraisal that follows. One of the most common mistakes is relying on book values rather than market values for the weights of debt and equity. Balance sheet figures reflect historical accounting entries, while WACC is meant to capture the cost of capital at current market prices. Equity book value in particular can diverge dramatically from market capitalization, and using the accounting figure can misstate the financing mix and therefore the blended rate. A second frequent error is neglecting the tax shield on debt. Because interest payments are generally tax-deductible, the effective cost of debt is the pre-tax rate multiplied by one minus the tax rate. Omitting this adjustment overstates the cost of debt, pushes the WACC too high, and causes analysts to reject projects that would actually create value. Prudent modelers consistently apply the after-tax cost of debt and verify that the tax rate used matches the jurisdiction and period being modeled. A third pitfall is applying a single company-wide WACC to every project the firm undertakes. A conglomerate’s overall WACC reflects its average risk profile, yet individual divisions and projects differ in risk, leverage capacity, and cyclicality. Using the corporate rate for a low-risk, stable division undervalues it, while applying it to a high-risk venture overvalues it and encourages misallocation of capital. Project-specific or divisional hurdle rates, built from comparable pure-play betas, provide a more reliable guide. Finally, analysts often mismatch nominal discount rates with real cash flows, or vice versa. WACC derived from market yields and observed returns is inherently nominal, so it should discount nominal cash flows that embed expected inflation. Pairing it with cash flows stated in constant prices introduces an inflation bias that compounds over the forecast horizon. Keeping the inflation treatment consistent throughout the model preserves the integrity of the discounting process and the reliability of the resulting valuation.
How Capital Structure Shifts Impact Your Overall Cost of Capital
Capital structure is the blend of debt and equity a company uses to finance its operations and growth, and it sits at the center of the WACC calculation. When the proportions of debt and equity shift, the weighted average cost of capital shifts with them, because each source of funding carries a different cost. Debt is generally the cheaper source on a pre-tax basis for two reasons: lenders accept lower returns because their claims are senior and contractually protected, and interest payments are tax-deductible, which creates a tax shield that lowers the effective after-tax cost of debt. Equity is more expensive because shareholders bear residual risk and demand a return that compensates for it. As a result, replacing equity with debt lowers the weighted average, at least initially, because more weight is placed on the cheaper component.
That benefit has limits. Every additional unit of debt raises the firm’s financial risk. Interest and principal payments become fixed obligations that must be met regardless of operating performance, and as leverage climbs, both lenders and shareholders begin to price that risk. Lenders demand higher interest rates on new borrowing, and rating agencies may downgrade the firm, pushing the cost of future debt even higher. Shareholders also react: higher leverage amplifies the volatility of earnings available to equity, so the cost of equity rises as the firm becomes more financially fragile. The tax shield becomes less valuable as taxable income shrinks under heavy interest burdens, and the probability of financial distress grows.
The net effect is that WACC typically follows a U-shaped path as leverage increases. At low levels of debt, adding borrowing reduces WACC because the cheap debt component grows and the tax shield works in the firm’s favor. Beyond a certain point, the rising costs of both debt and equity, together with the expected costs of distress, outweigh the tax advantage, and WACC begins to climb again. The optimal capital structure sits near the leverage level where these opposing forces balance and WACC reaches its minimum.
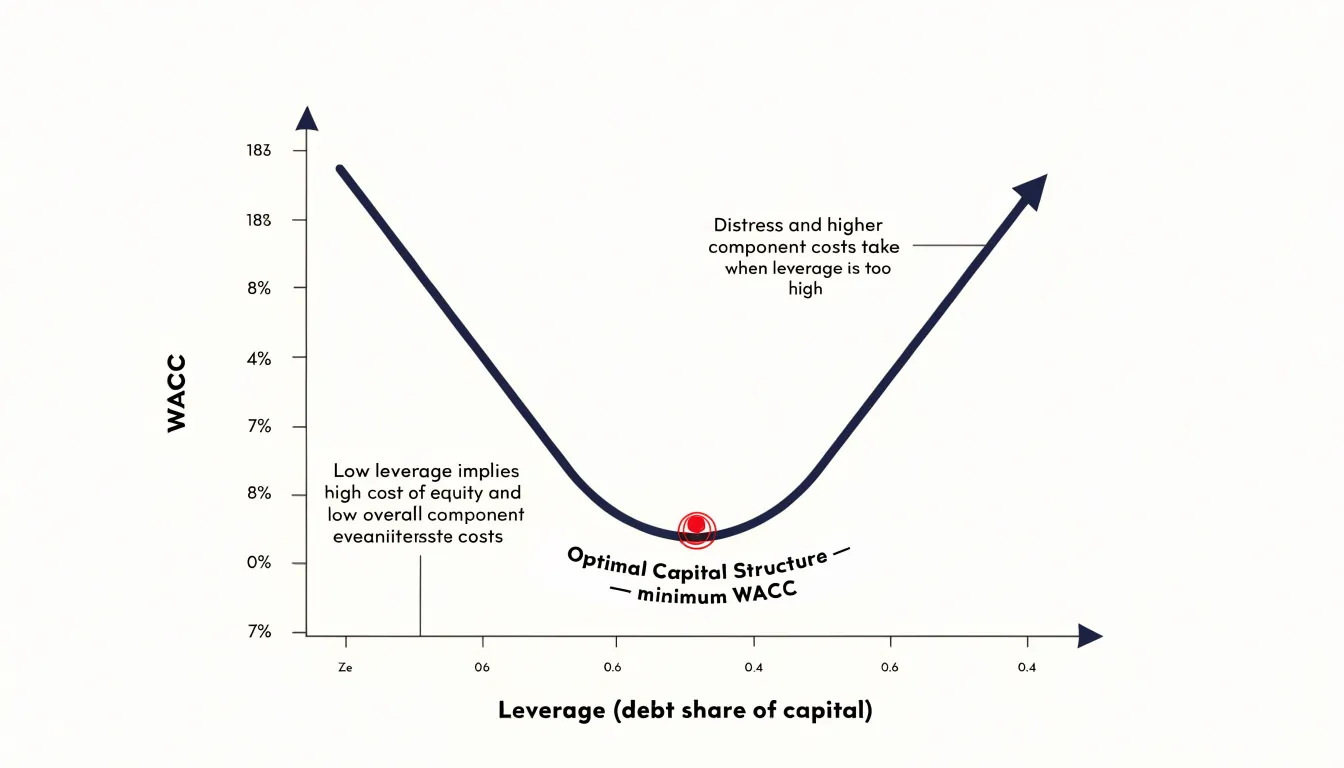
Practical implications follow directly. A firm that issues debt to repurchase shares or fund expansion should model how the change affects both the weights and the component costs, since the cost of equity and debt will not stay constant as leverage rises. Recalculating WACC after each significant financing decision keeps the discount rate aligned with the firm’s actual risk profile and supports sound investment appraisal.
Frequently Asked Questions
What is WACC and what does it tell a business?
WACC is the blended price a company pays for debt and equity capital, weighted by how much of total capital each source represents. It expresses what the company’s capital costs on an annual basis and can serve as a hurdle rate for projects and investments.
How is the standard WACC formula written?
The standard formula is WACC = (E/V) × Re + (D/V) × Rd × (1 − Tc), where E is market value of equity, D is market value of debt, V is E plus D, Re is cost of equity, Rd is cost of debt, and Tc is the corporate tax rate. The (1 − Tc) factor captures the tax shield associated with debt financing.
Why should WACC use market values instead of book values for debt and equity?
WACC is meant to reflect the cost of raising capital today, so market values better mirror current financing realities. Book values record historical transactions and can diverge substantially, which can distort the weights and understate the true cost of equity capital.
What inputs are used to estimate cost of equity with the Capital Asset Pricing Model?
CAPM uses the risk-free rate, the stock’s beta, and the equity risk premium, combined as the risk-free rate plus beta multiplied by the equity risk premium. The risk-free rate often comes from a long-term government bond yield, beta can be sourced from financial data platforms, and the equity risk premium can come from historical return studies or implied premiums.
How do you calculate the after-tax cost of debt for WACC?
Start with the effective interest rate on the company’s debt, using yield to maturity for a bond issue or a market-value-weighted average of yields when there are multiple debt instruments. Then multiply the pre-tax rate by (1 minus the marginal tax rate); for example, a 7% pre-tax cost with a 25% tax rate gives 7% × (1 – 0.25) = 5.25%.
How does increasing debt affect WACC?
Replacing equity with debt can lower WACC initially because debt is generally cheaper and interest payments are tax-deductible. As leverage rises, however, financial risk increases, lenders and shareholders demand higher returns, and WACC typically follows a U-shaped path, with the optimal capital structure near the leverage level where WACC reaches its minimum.