What Is FP&A? Financial Planning and Analysis Explained
Financial planning and analysis (FP&A) is the corporate finance function that turns financial data into forward-looking insight for management. It builds budgets and rolling forecasts, analyzes variances between plan and actual results, and prepares management reporting. FP&A differs from accounting, which records past transactions, by projecting future outcomes and supporting decisions on pricing, investment, and resource allocation.
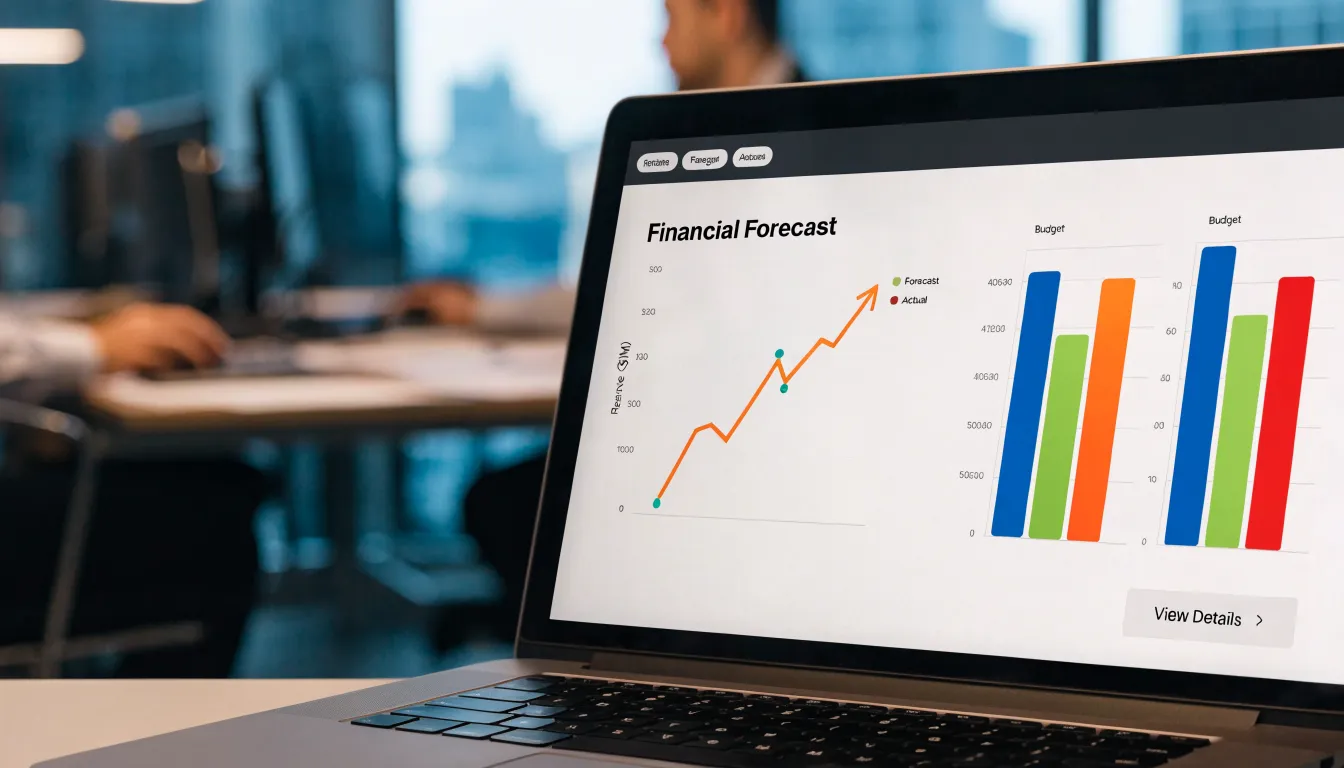
Table of Contents
- What corporate financial planning and analysis actually means
- How FP&A differs from traditional accounting
- Core responsibilities
- What does a financial analyst do on a daily basis
- The annual budgeting process step by step
- Building financial forecasts that guide business growth
- Variance analysis
- Essential software tools used by modern FP&A teams
- How to build a successful career path in financial analysis
What corporate financial planning and analysis actually means
Financial planning and analysis, commonly shortened to FP&A, describes the corporate function responsible for turning financial data into forward-looking insight that management can act on. In practical terms, FP&A sits between the accounting team that records what has already happened and the executives who decide what the company should do next. The function builds the annual budget, maintains rolling forecasts, analyzes variances between plan and actual results, and prepares the management reporting that leadership reviews each month. These activities give decision-makers a structured view of where the business stands and where it is heading.
The role extends well beyond producing numbers. FP&A professionals work alongside department heads to understand the drivers behind revenue and costs, model the financial impact of proposed investments, and stress-test plans against different market scenarios. When a product line misses its target or a cost center overspends, FP&A helps explain why and quantifies the consequences, giving managers the context they need to adjust course. This partnership approach means FP&A analysts frequently join business reviews, pricing discussions, and capital allocation decisions, translating operational detail into financial language that senior leaders can weigh.
Driving performance is central to the function’s purpose. By setting targets, tracking key metrics, and linking financial outcomes to operational activity, FP&A creates a feedback loop that keeps the organization focused on its priorities. Variance analysis identifies where performance diverges from plan, root-cause discussions reveal why, and revised forecasts show what the remainder of the year is likely to look like if current trends continue. Management can then redirect resources, renegotiate commitments, or accelerate promising initiatives with a clearer picture of the financial trade-offs involved. FP&A also supports performance by designing the reporting cadence and dashboards that keep accountability visible across the organization.
In a corporate setting, FP&A acts as the analytical engine behind disciplined decision-making. It combines financial modeling, business partnering, and performance management to help leadership allocate capital wisely, respond to change quickly, and hold the organization to measurable goals.
How FP&A differs from traditional accounting
FP&A occupies a distinct position within the finance function, and understanding how it differs from traditional accounting clarifies why organizations treat it as a strategic capability rather than a record-keeping one. Traditional accounting centers on capturing and reporting what has already happened. Its core outputs, such as financial statements, ledgers, and statutory filings, describe past transactions with precision and conform to established standards. FP&A works in the opposite direction in time: it takes the historical record as a starting point and projects forward, building budgets, forecasts, and scenario models that describe what could happen next. Where accounting aims for accuracy and verifiability, FP&A deals in estimates, ranges, and assumptions that are refined continuously as new information arrives.
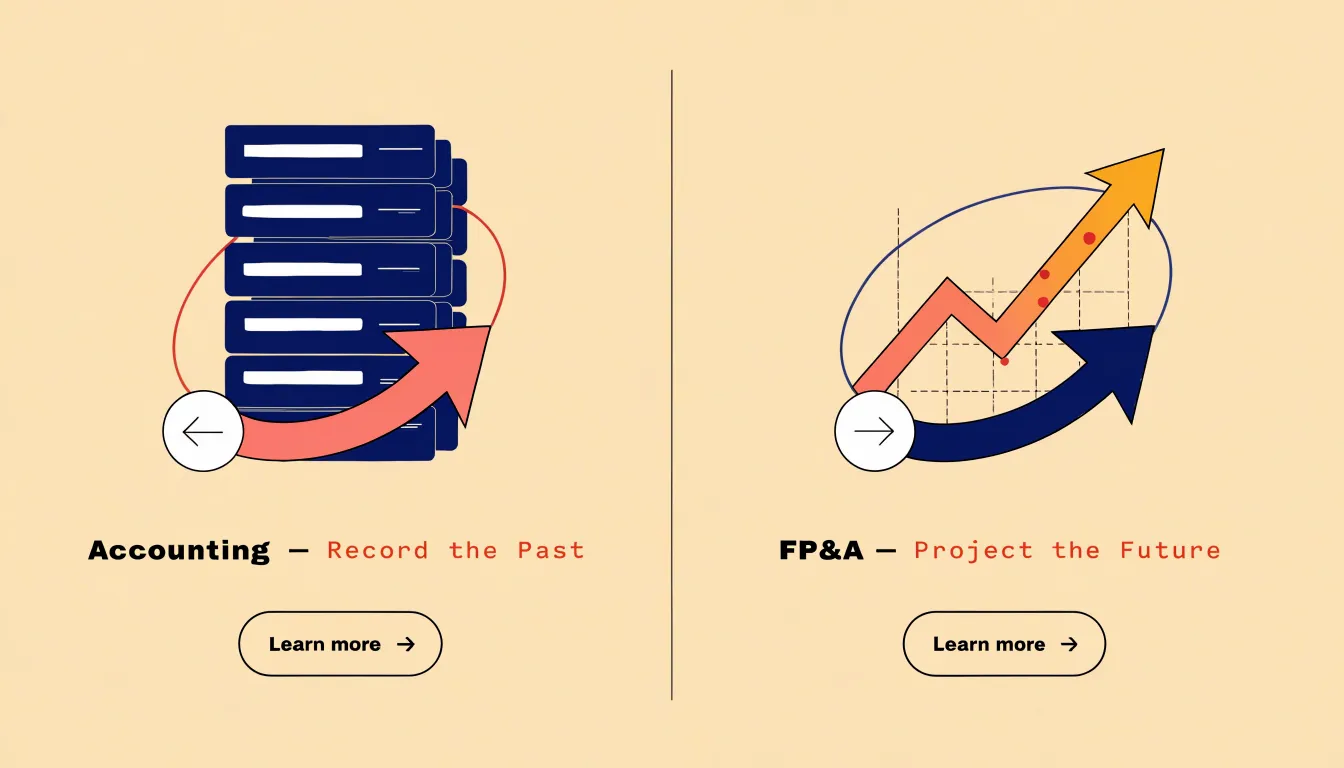
A second distinction lies in purpose. Accounting exists largely to satisfy compliance and stewardship obligations, ensuring that external stakeholders, regulators, and auditors receive reliable information. The work is governed by rules and deadlines, and success is measured by correctness. FP&A is built for decision support. Its analyses inform choices about pricing, hiring, capital investment, cost structure, and resource allocation. The audience is internal, typically executives and department leaders, and the measure of success is whether the insight improves the quality and speed of a business decision.
The skill profiles reflect these different mandates. Traditional accountants develop deep expertise in standards, controls, and reporting accuracy. FP&A professionals need commercial fluency, the ability to model uncertainty, strong communication skills for translating numbers into narrative, and the judgment to challenge business assumptions constructively. They often work closely with operational leaders, which requires an understanding of the business beyond the finance function.
In practice, the two disciplines are complementary. Accounting supplies the reliable baseline against which FP&A measures performance and builds its forward view. Organizations get the most value when the boundaries are clear and the handoffs are smooth, with accounting anchoring the past and FP&A illuminating the road ahead.
Core responsibilities
FP&A teams carry a broad mandate that reaches from the month-to-month mechanics of budgeting to the multi-year horizons of corporate strategy. At the foundation sits budgeting: assembling the annual operating plan by working with department heads to translate operational goals into a coherent financial blueprint. This involves setting revenue targets, allocating costs, and establishing the spending envelopes that guide managers throughout the year. A well-built budget provides the baseline against which all subsequent performance is measured.
Forecasting builds on that baseline with a more fluid rhythm. Where the budget sets a fixed annual reference point, forecasts are refreshed on a monthly or quarterly cadence to reflect actual results, revised assumptions, and emerging conditions. Rolling forecasts in particular allow the business to look twelve to eighteen months ahead continuously, giving leadership a current view of where the company is likely to land rather than where it hoped to be at the start of the year.
Variance analysis connects plan to reality. FP&A analysts compare actual outcomes against budget and forecast, decompose the differences into their drivers, and explain them in language the business can act on. A revenue shortfall, for instance, might trace to volume, pricing, or mix, and each carries different implications for corrective action. This analytical discipline ensures that budget and forecast figures remain decision tools rather than static paperwork.
Strategic planning lifts the function above the annual cycle. FP&A supports long-range planning, capital allocation, investment appraisal, and scenario modeling, testing how the business performs under different market conditions. This work feeds directly into decisions about new products, expansion, acquisitions, and cost structures, positioning finance as a partner in setting direction rather than simply recording outcomes.
Together these responsibilities form a continuous loop: the budget establishes intent, forecasts track progress, variance analysis explains deviations, and strategic planning adjusts the course for the longer term.
What does a financial analyst do on a daily basis
A financial analyst’s day typically begins with data gathering, the foundational activity that supports everything else. Analysts pull actuals from ERP systems, reconcile figures across sources, and check that the numbers they are working with are complete and current. This often involves refreshing dashboards, updating variance reports, and comparing month-to-date results against plan. Because business conditions shift quickly, this data work is rarely a one-time task; analysts revisit the numbers throughout the day as new information arrives from accounting, sales operations, or supply chain systems.
Mid-morning frequently moves into financial modeling. Analysts maintain and update forecast models, adjusting assumptions for headcount, pricing, or volume based on the latest inputs from the business. They run scenarios to test how changes in revenue or cost drivers would affect the outlook, and they document their assumptions so that colleagues and leaders can follow the logic. Model maintenance is iterative work, and analysts often return to the same spreadsheet multiple times in a day as new questions arise.
Reporting consumes another significant share of time. Analysts prepare variance analyses that explain why actuals diverged from budget or forecast, assemble management reporting packs, and draft commentary that translates the numbers into plain language. In many FP&A teams, reporting runs on a fixed calendar, with weekly or monthly deliverables that require coordination across contributors. Analysts also field ad hoc requests, such as a quick profitability analysis for a proposed deal or a cost breakdown for a department leader.
Meetings with business partners anchor the afternoons. Analysts sit down with sales, marketing, operations, or product leaders to review results, understand what is driving variances, and align on forward-looking assumptions. These conversations are where the analysis becomes actionable: an analyst might walk a partner through a budget overrun, discuss trade-offs between initiatives, or gather context on a pipeline change that affects the forecast. Between meetings, analysts respond to email questions, refine their models, and prepare materials for the next review cycle. The role blends independent analytical work with frequent collaboration, and the balance shifts with the reporting calendar and the urgency of business decisions.

The annual budgeting process step by step
The annual budgeting cycle begins well before any numbers are entered into a spreadsheet. The first phase is setting assumptions, where FP&A teams work with leadership to establish the macroeconomic and business parameters that will frame the entire plan. These assumptions typically cover expected revenue growth rates, inflation and wage increases, headcount targets, foreign exchange rates, and pricing changes. Documenting these drivers up front creates a shared reference point that keeps every department working from the same baseline and makes later variance analysis far more meaningful.
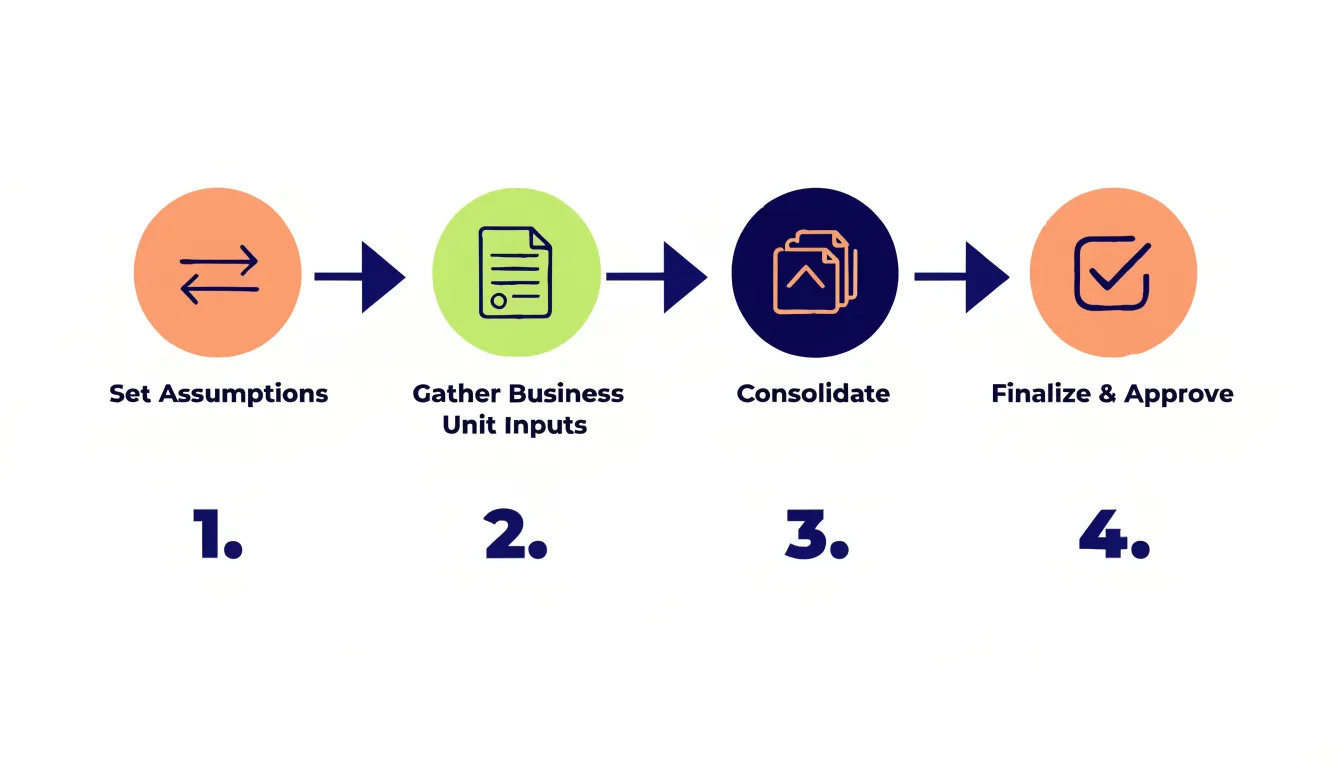
With assumptions agreed, the process moves to gathering inputs from business units. FP&A distributes budget templates and timelines to department heads, who translate their operational plans into financial terms. Sales forecasts pipeline coverage and bookings; operations estimates production costs and capacity needs; HR projects hiring and compensation; marketing outlines campaign spend. This input phase is often the longest part of the cycle, and experienced FP&A teams support it with clear instructions, historical data, and review sessions to improve accuracy and consistency across submissions.
Once inputs arrive, the consolidation phase begins. FP&A rolls departmental submissions into a single company-wide model, checking for internal consistency, eliminating double counting, and testing the combined plan against the top-down targets set by leadership. Gaps between bottom-up submissions and top-down expectations are common, and this is where negotiation and iteration take place. FP&A may run scenarios, challenge optimistic revenue projections, or ask units to reprioritize spending until the consolidated picture aligns with strategic goals and financial constraints.
Finalization follows consolidation. The completed budget is reviewed with senior management and, in many organizations, presented to the board for approval. Once signed off, it becomes the official plan against which performance will be measured throughout the year. The final steps involve loading the approved budget into ERP and planning systems, communicating targets back to budget owners, and archiving the assumptions and documentation for future reference. A well-run finalization phase closes the loop cleanly, giving every stakeholder a clear, approved target and a documented record of the reasoning behind it.
Building financial forecasts that guide business growth
Reliable forecasts begin with a disciplined look backward. Historical data provides the baseline against which every future assumption can be tested, so FP&A teams typically start by assembling clean, consistent records of revenue, costs, headcount, and cash flow across several periods. This involves reconciling data from ERP systems, CRM platforms, and operational tools, then normalizing for one-time events such as restructuring charges or unusual contract timing so the underlying trends remain visible. Seasonality deserves particular attention, since many businesses show predictable peaks and troughs that can distort a simple month-over-month comparison. Once the historical picture is clear, the team can identify which metrics have actually moved the business in the past and use those patterns as the foundation for forward-looking projections rather than relying on flat growth-rate assumptions.
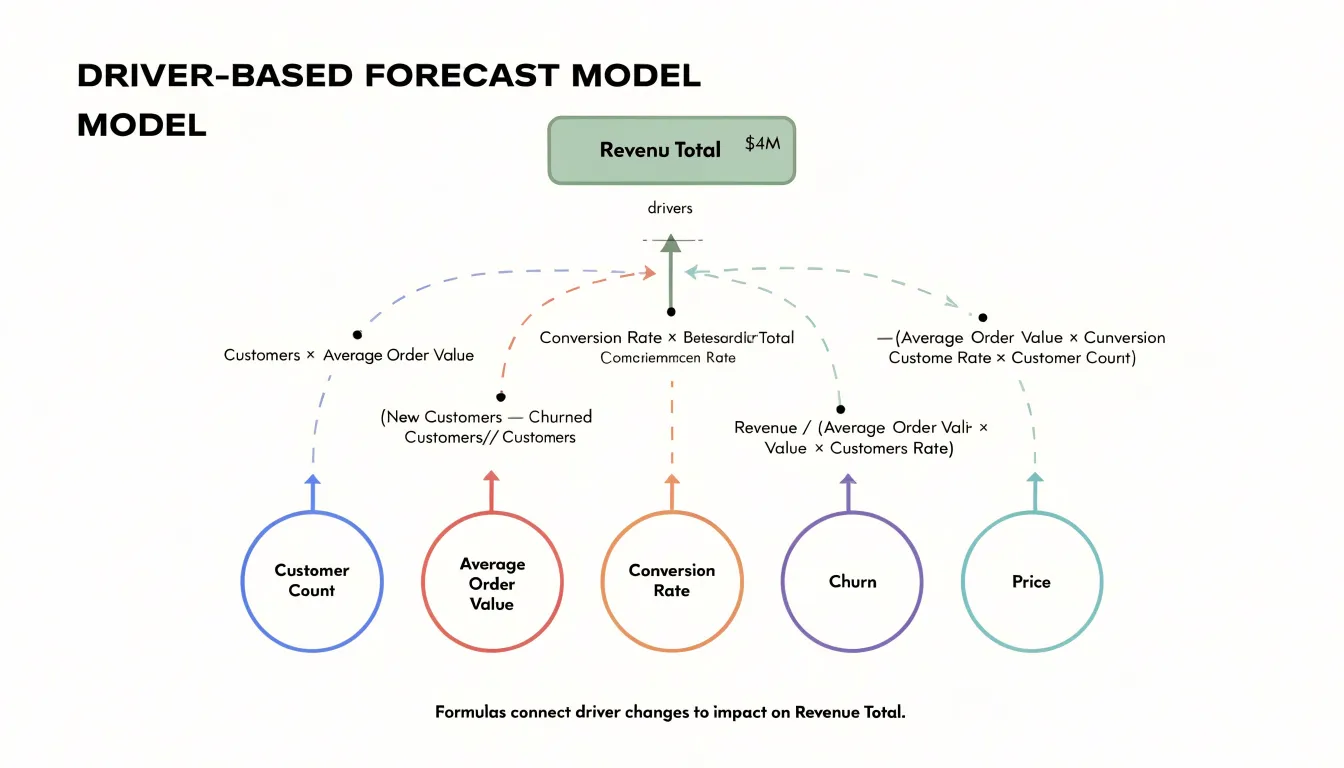
Driver-based modeling extends this foundation by connecting financial outcomes to the operational activities that produce them. Instead of forecasting revenue as a single top-line number, the model breaks it into its components: customer counts, average order values, conversion rates, churn, and pricing changes. Cost forecasts follow the same logic, tied to headcount plans, unit volumes, or capacity constraints. This structure makes assumptions explicit and auditable, which matters when conditions shift. If a key driver such as sales pipeline conversion begins to move, the model can be updated quickly and the downstream financial impact recalculated, giving leadership a fast read on how the business is tracking against plan.
Scenario analysis adds the flexibility that growth planning demands. Rather than committing to a single forecast, FP&A teams build a base case alongside upside and downside variants, each anchored in different assumptions about market demand, hiring pace, or pricing. These scenarios let management stress-test the plan, understand which levers matter most, and prepare contingency actions in advance. The forecast then becomes a living tool for steering growth, revisited monthly as actual results come in, with variances analyzed and assumptions refined. Used this way, forecasting supports decisions on investment, hiring, and capital allocation with a clearer view of the range of outcomes ahead.
Variance analysis
Variance analysis is the discipline of comparing what actually happened in the business against what was expected to happen, and then explaining the difference. Every budget and every forecast is a set of expectations: revenue targets, cost allowances, headcount plans, and cash projections. Once the reporting period closes, FP&A teams place actual results side by side with those expectations and quantify the gap line by line. The comparison itself is straightforward arithmetic, yet the real analytical work begins once the numbers have been calculated.
The first step is determining the size and direction of each variance. Some differences will be small enough to sit within normal tolerance, while others will be large enough to demand attention from leadership. Analysts typically apply materiality thresholds so that effort concentrates on the line items that genuinely move the business. A favorable variance on one line and an unfavorable variance on another may offset each other at the bottom line, which is why variance analysis usually drills into the underlying drivers rather than stopping at the total.
Identifying causes is the heart of the process. A revenue shortfall might stem from lower unit volumes, pricing pressure, a shift in product mix, a timing delay, or a lost customer. A cost overrun might reflect higher input prices, unplanned overtime, or spending that was simply pulled forward from a later period. Some variances are timing-related and will reverse; others are permanent and require a response. Distinguishing between these categories helps decision-makers understand whether they are looking at a temporary blip or a structural change worth acting on.
Communicating findings turns the analysis into something useful. FP&A professionals package variances into reports and commentary for budget owners, the executive team, and the board, explaining what happened, why it happened, and what it means for the outlook. Good variance reporting connects the numbers to operational reality, frames the impact in terms leadership cares about, and recommends actions where appropriate. When done well, variance analysis closes the loop between planning and execution, giving the organization a feedback mechanism that sharpens future forecasts and keeps spending and performance aligned with strategic priorities.
Essential software tools used by modern FP&A teams
Modern FP&A teams rely on a layered stack of software tools that together support planning, analysis, and reporting. Each tool occupies a distinct place in the workflow, and understanding those roles helps explain how financial planning and analysis is carried out in practice.
Excel remains the workhorse of FP&A. Its flexibility makes it well suited to ad hoc modeling, scenario analysis, and quick what-if calculations. Analysts frequently use spreadsheets to build forecasts, test assumptions, and manipulate datasets before results are consolidated. Many organizations maintain their detailed planning models in Excel even after adopting more specialized platforms, because it gives analysts direct control over formulas and logic. Its familiarity also makes it a common language for collaboration across finance and business teams.
ERP systems form the transactional backbone. Tools such as SAP, Oracle, and NetSuite hold the general ledger, accounts payable and receivable, and other core accounting data. For FP&A, the ERP is the source of actuals against which plans and forecasts are measured. Variance analysis, month-end close reporting, and historical trend analysis all draw on data extracted from the ERP. Because ERP data is structured and audited, it provides the reliable foundation that planning activities depend on, even though ERPs are not designed for forward-looking modeling.
Dedicated FP&A software sits between these two layers. Platforms such as Anaplan, Adaptive Insights, and Vena Solutions are built specifically for budgeting, forecasting, and management reporting. They offer centralized data models, driver-based planning, workflow and approval controls, and automated consolidation across business units. These tools reduce the manual effort of gathering and reconciling spreadsheet inputs, improve version control, and enable faster scenario planning. Many also include dashboards and visualization features that support executive reporting.
In practice, these tools work together. Actuals flow from the ERP into the FP&A platform, analysts apply Excel-style logic or use built-in modeling capabilities, and the results feed into reports and dashboards for decision-makers. A well-designed tool stack connects these components so data moves smoothly and finance teams spend less time on manual assembly and more time on analysis.
How to build a successful career path in financial analysis
Building a successful career in financial planning and analysis (FP&A) begins with a solid educational foundation. Most professionals enter the field with a bachelor’s degree in finance, accounting, economics, or business administration. Coursework in financial management, managerial accounting, and corporate finance provides essential knowledge. Many also pursue a master’s degree, such as an MBA with a finance concentration, to deepen their expertise and open doors to senior roles. Beyond formal education, certifications can significantly enhance credibility and marketability. The Chartered Financial Analyst (CFA) designation is highly regarded for its rigorous curriculum covering investment analysis and portfolio management, while the Certified Public Accountant (CPA) license is valuable for those with an accounting background. The Certified Management Accountant (CMA) certification focuses on management accounting and financial strategy, aligning closely with FP&A responsibilities. Additionally, specialized certifications like the Financial Planning & Analysis Professional (FPAP) or courses in data analytics and financial modeling can set candidates apart.
Skill development is a continuous process. Technical proficiency in Excel, financial modeling, and enterprise resource planning (ERP) systems is fundamental. As FP&A evolves, skills in data visualization (e.g., Power BI, Tableau), programming (e.g., Python, SQL), and predictive analytics are increasingly important. Equally critical are soft skills: clear communication, business partnering, and the ability to translate complex financial data into actionable insights for non-financial stakeholders. Gaining hands-on experience through internships, entry-level roles in accounting or financial analysis, and rotational programs provides practical exposure. Networking plays a pivotal role in career advancement. Joining professional organizations such as the Association for Financial Professionals (AFP) or the Financial Planning & Analysis Institute offers access to resources, conferences, and mentorship opportunities. Building relationships with colleagues, mentors, and industry peers can lead to new opportunities and career guidance. Engaging on platforms like LinkedIn and attending industry events further expands one’s network. Advancement in FP&A typically follows a path from analyst to senior analyst, manager, director, and eventually vice president or CFO. Pursuing continuous learning, seeking stretch assignments, and demonstrating strategic thinking are key to climbing the ladder.
Frequently Asked Questions
What is FP&A in finance?
FP&A, or financial planning and analysis, is the corporate function responsible for turning financial data into forward-looking insight that management can act on. It builds the annual budget, maintains rolling forecasts, analyzes variances, and prepares management reporting that leadership reviews. It sits between the accounting team that records what has already happened and the executives who decide what the company should do next.
How is FP&A different from traditional accounting?
Traditional accounting focuses on capturing and reporting what has already happened, such as financial statements, ledgers, and statutory filings, with an emphasis on accuracy and compliance. FP&A projects forward using budgets, forecasts, and scenario models that deal in estimates, ranges, and assumptions to support internal decisions. The two disciplines are complementary, with accounting supplying the reliable baseline against which FP&A measures performance.
What does a financial analyst do on a daily basis?
A financial analyst gathers and reconciles data from ERP systems, refreshes dashboards and variance reports, and updates forecast models and scenarios. They also prepare management reporting and commentary and meet with business partners to review results and align on forward-looking assumptions. The role blends independent analytical work with frequent collaboration.
What are the steps in the annual budgeting process?
The cycle begins by setting assumptions such as revenue growth rates, inflation and wage increases, headcount targets, foreign exchange rates, and pricing changes. FP&A then gathers business-unit inputs, consolidates departmental submissions into a company-wide model, and iterates to align bottom-up plans with top-down targets. Finalization includes senior management and board review, loading the approved budget into systems, communicating targets to budget owners, and archiving assumptions and documentation.
What is variance analysis in FP&A?
Variance analysis compares actual results against budget or forecast expectations and quantifies the gaps line by line. FP&A identifies causes such as volume, pricing, product mix, timing delays, or cost drivers and communicates what happened, why it happened, and what it means for the outlook. It helps close the loop between planning and execution.
How do you build a career in financial planning and analysis?
Many professionals start with a bachelor’s degree in finance, accounting, economics, or business administration, and some pursue a master’s degree such as an MBA with a finance concentration. Certifications such as the CFA, CPA, CMA, or FPAP can enhance credibility, while technical skills in Excel, financial modeling, and ERP systems are fundamental. Advancement typically follows a path from analyst to senior analyst, manager, director, and eventually vice president or CFO.